1 INTRODUCTION
In the period from 1890 to 1980 the transformation of the Portuguese economy from a highly protected and predominantly rural economy to a more industrialised one with a higher degree of openness to the outside world was considerable. Such economic transformation is well documented in the literature, in terms of the evolution of the main macroeconomic variables, but one field has remained largely unexploited; namely, the evolution of regional income distributionFootnote 1. This lacuna is particularly relevant given the qualitative evidence regarding the displacement of economic activity to the urban regions on the coast and the relative decline of the interior regions. The country gained a dense urban area extending for several hundred kilometres along the coast, whereas the inland regions in the northeast and the south lost population in relative and absolute terms. This paper is a first attempt to measure the evolution of regional income levels in Portugal over most of the 20th century. We provide decennial estimates of regional GDP per capita, from 1890 to 1960, using the method proposed by Geary and Stark (Reference Geary and Stark2002), based on data on wages and prices for the eighteen administrative districts. These estimates are then linked to the existing official data from 1960 to 1980. The new data show that regional inequality increased up to 1970 and declined thereafter.
The evolution of regional inequality in the inverted-U pattern in a context of rapid economic growth fits the predictions made by Williamson (Reference Williamson1965), Krugman (Reference Krugman1991) and the «new economic geography», according to which scale economies, the decrease in transport costs and openness to international markets favour the rise of regional inequality in the first stages of industrialisation, which are then followed by a fall in inequality, due to the emergence of congestion costsFootnote 2.
In comparison to other European economies, Portugal's regional inequality peaked at a rather late date (see Buyst Reference Buyst2010; Rosés et al. Reference Rosés, Martínez-Galarraga and Tirado2010; Combes et al. Reference Combes, Lafourcade, Thisse and Toutain2011; Felice Reference Felice2011; Henning et al. Reference Henning, Enflo and Andersson2011). Our analysis suggests that in a small country such as Portugal, the home market effect is strongly related to the degree of trade openness, whereas in countries with larger markets, the home market effect is more closely associated with the level of home market integration. If this is the case, the internationalisation of the Portuguese economy appears to be the single most important cause for the increase in spatial inequality until 1970Footnote 3.
The paper proceeds as follows: the next section presents an overview of Portuguese economic growth, openness and structural change; Section 3 provides a description of our estimates for regional GDP; Section 4 analyses the evolution of regional GDP and the impact of structural change and openness on the location of the economic activity; and Section 5 concludes.
2 ECONOMIC GROWTH, OPENNESS AND STRUCTURAL CHANGE, 1890-1980
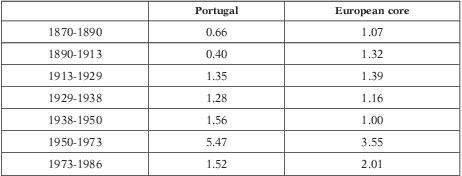
During the 20th century, Portugal entered the convergence club and its level of income per capita caught up, albeit only partially, with the levels of the more advanced European nations. In contrast, the previous century had been marked by the divergence of Portugal's productivity and income levels as, despite industrialisation, GDP per capita expanded at an annual rate below 1 per cent (see Lains Reference Lains2003b, Reference Lains2007; Maddison Reference Maddison2010). Portugal's economic performance in the 20th century occurred with different degrees of intensity. During the interwar period, convergence was relatively slower, whereas after World War II economic growth gained momentum and the rate of convergence was considerably faster. This pattern was common to other peripheral European countries such as Spain and Greece. Following the 1973 oil shock, the European economy entered a period of slower growth and divergence of the less developed economies on the continent returned (see Table 1).
GROWTH OF REAL INCOME PER CAPITA (1870-1986)
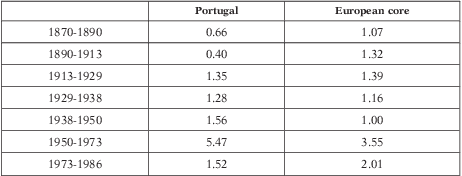
European core: Belgium, Denmark, France, Germany (West Germany to 1991), Italy, Netherlands, Norway, Sweden and United Kingdom.
Source: Lains (Reference Lains2007) and Pereira and Lains (Reference Pereira and Lains2012).
The evolution of the Portuguese economy over the 20th century shows no clear relationship between convergence of incomes per capita with the rest of Europe, and levels of openness and deeper international economic integration. In fact, economic growth was fastest during the interwar years, which was a period of high trade barriers and autarky, as well as during the Golden Age of growth, from 1950 to 1973, which was a period of greater openness all over Europe. However, after 1973, the level of political and economic integration of the country with the rest of Europe increased, particularly after joining the European Union, in 1986, and the single currency in the late 1990s, but convergence of income per capita did not follow suit. Structural change was a major source of convergence up to 1973, as factors moved from agriculture to industry and, within each sector, from less to higher productivity industries, and after 1973, the scope for structural change was substantially reduced (see Lains Reference Lains2003a).
The changes in the structure of the economy had very marked regional features, as Portugal suffered from the dislocation of economic activities across its territory. In fact, the economic sectors that expanded fastest were concentrated in the main coastal cities, particularly in Lisbon, Porto and the vast region between them. Contrarily, the inland regions lagged behind and suffered from substantial population loss as people emigrated to the cities and to other destinations in Europe. By 1981, about 3.5 million people, out of a population of 10 million, lived in the area that stretches along the coast for about 400 kilometres, from Viana do Castelo in the north, to Setúbal, south of Lisbon, constituting one of the largest urban areas of Europe (Valério Reference Valério2001, pp. 142-145). The main drivers of these internal migrations were, however, different, with more concentration of manufacturing activities in the north-western regions and of trade and other services in the central coastal regions, particularly in the capital city, Lisbon.
3 REGIONAL GDP, 1890-1980
Following Geary and Stark (Reference Geary and Stark2002), regional GDP per capita in current prices and at factor costs was estimated by taking first the regional gross value added (GVA) for a given number of sectors and, subsequently, these estimates were aggregated by using sectoral shares in aggregate national outputFootnote 4. For the period from 1890 to 1920, we provide estimates of regional sectoral GVA for agriculture, industry and services; from 1920 to 1950, we add estimates for mining, construction and electricity; from 1930 to 1950 we also add data on electricity and gas; finally, from 1960 onwards we use official data on sectoral production at the regional level. Official data for regional GDP are available from Abreu (1969), with data for three sectors (agriculture, industry and services), for the years 1953 and 1963, da Conceição (Reference da Conceição1975), with data for 1970 for eight sectors, and INE (1991), with data for 1980 and the broadest coverage.
Thus, total sectoral regional GDP per capita up to 1960 is estimated by taking,

where GVA is gross value added and A, M, I, C, E and S are agriculture, mining, industry, construction, electricity and services, respectively. Total GDP is distributed between the different regions, and is defined as
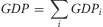
GDPi is the GDP of region i. In that sense, the GDPi is defined as
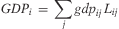
and gdpij is the average value added per worker in region i in sector j and Lij is the corresponding number of workers. If we consider that the differences in regional GDP are related with the differences between the productivity of an economic sector between regions and, at the same time, this is captured by the differences in nominal wages, we can transform [3] as

where wij is the wage paid in region i in sector j and wj is the national average wage in that sector and β is a scalar, which preserves the relative regional differences but scales the absolute levels. As a result, the addition of GDP estimates for each sector at the regional level is equal to the sector estimates at national level.
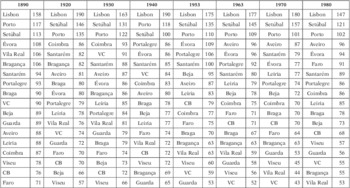
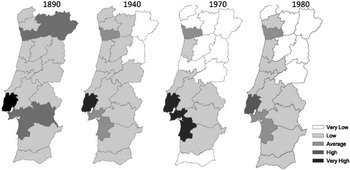
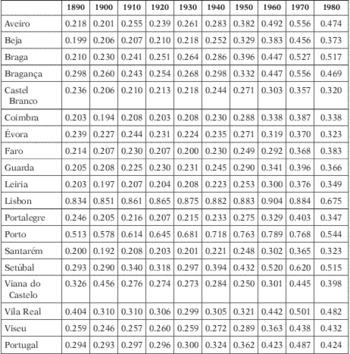
Our estimates for regional GDP per capita are presented in Table 2 and Map 1. As may be seen, the top three regions remained unchanged throughout the period, namely, Lisbon, Porto and Setúbal. On the other hand, at the tail of the ranking, the mobility is higher although Viseu, Guarda and Castelo Branco have remained at the bottom. Some regions, such as Bragança and Vila Real, became worse off as they were among the richest in 1890 and ended up at the bottom by 1980. On the other hand, the position of Leiria and Aveiro improved significantly over the periodFootnote 5. Table 2 also shows that the range of levels of income per capita increased substantially between 1890 and 1970 and declined in the following decade. In 1890 the level of income per capita of the richest region was slightly more than twice that of the poorest; in 1970 the leading region was more than four times richer than the poorest region and, in 1980, this gap narrowed to 2.8. Map 1 clearly depicts the increase in the relative levels of income per capita in the coastal regionsFootnote 6.
PER CAPITA GDP RANKING OF THE PORTUGUESE REGIONS (1890-1980) — PORTUGAL = 100

VC: Viana do Castelo; CB: Castelo Branco.
Source: See text.
REGIONAL GDP PER CAPITA OVER COUNTRY AVERAGE, 1890-1980. We have defined the categories considering five groups equally, distributed for the range for all the values. This is the reason why in 1980 no region had a very high value; and it is also a sign of less inequality.
Source: GDP per capita from Badia-Miró et al. (Reference Badia-Miró, Guilera and Lains2012).

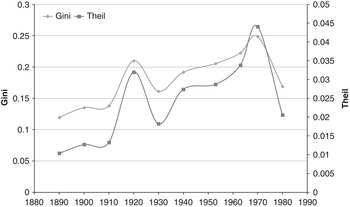
Figure 1 shows the Gini and Theil coefficients for regional per capita GDP inequality. As may be seen in the figure, the two indexes follow a very similar pattern, increasing until 1970 to decrease afterwards. The U-shaped evolution observed by Williamson (Reference Williamson1965) is also observed in other case studiesFootnote 7, but significant differences are noteworthy: the highest value of spatial inequality in Portugal appears in the 1970s and a strong decline is observed thereafter, more than fifty years later than the peak reached in Spain, France or the United States of America. We also observe a lower degree of inequality in Portugal at the beginning of the 20th century, due to the absence of economic structural changes and the delay in driving the industrial modernisation.
PER CAPITA GDP INEQUALITY Source: Badia-Miró et al. (Reference Badia-Miró, Guilera and Lains2012).

4 PATTERNS OF SPECIALISATION
This section aims to identify the underlying forces that drove regional inequality in Portugal. Income differences between regions could be due to divergences in the structure of output, in sectoral productivity levels or to the interaction of both factors. All these variables are closely related to structural change. The identification of the more relevant effects for each region is a key factor in the characterisation of the regional pattern of development and of its impact on overall regional income inequality. Besides, the analysis of the interaction of the three factors may shed light on the existence of agglomeration economies, which can be a major driver of inequality, according to the new economic geography models, as discussed above. Additionally, the identification of the causes of regional backwardness may provide some insights regarding the kind of policies that should have been implemented in order to converge with the richer regions.
Thus, in order to test the relation between regional per capita levels and regional productive structures we compute several measures of specialisation. First, we estimate the Krugman Index (SI), defined as
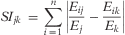
where Eij is the level of employment industry i = 1, … , n for region j and Ej is the total industrial employment for region j and similarly for region k. The index value ranges from 0, when the two regions have similar economic structures, to 2, when they are complementary. The index is estimated for each pair of regions and then regional specialisation is given by the average of the 18-1 estimates for each region. Similarly, the national index is given by the average of the regional estimates.
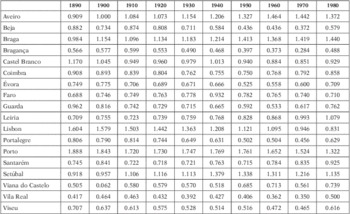
According to our findings, the SI index for Portugal is relatively stable until 1930 and then increases significantly up to 1970 to decline in the decade to 1980 (see Table A1). The trends in the specialisation index from 1930 to 1970 follow closely that of regional inequality. In fact, as may be seen in Table 2 and Table A1, the four regions at the top of the GDP per capita ranking (Lisbon, Setúbal, Porto and Aveiro) are also the regions with the highest values for the specialisation index. This relation may be due to the fact that different economic sectors are associated with different productivity levels, and thus, an increasing regional specialisation would lead to increasing economic inequality. For similar reasons, the decline of the SI index from the 1970s onwards may be associated with the decline in regional inequality.
Our specialisation index at national level remained stable until the 1930s, but changed significantly at the regional level before the 1920s, growing in some regions and decreasing in others. Therefore, it seems that the pattern of specialisation may not be able to explain the variations in the evolution of regional inequality before the 1930s, which point to productivity changes between the different economic sectors as the main candidate to explain those variations.
In order to look more deeply at the process of regional specialisation it may be interesting to focus specifically on the industrial sector, given that the emergence of this sector is often related with modern economic growth. We therefore estimate two other indexes, namely, the Location Quotients (LQs) for Employment and for GVA defined as follows:

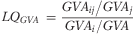
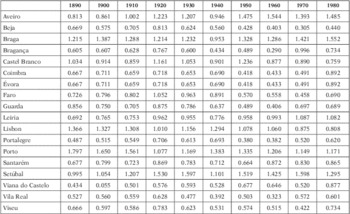
where Eij is the level of employment in industry i for region j and Ej is the total employment for region j. The LQGVA is defined in the same way. LQs above 1 imply a level of industrialisation above the national average and vice versa. As can be seen in Tables A2 and A3, the results for LQ for employment and GVA are very similar. Lisbon, Porto, Setúbal, Braga and Aveiro have LQs above the average. It is also interesting to see that Porto and Lisbon lost ground, while other highly ranked regions increased their LQ. Regarding the rest of the regions, although in some of them their LQ remained stable, in the vast majority, their LQ followed a U-shape, decreasing until 1970 and increasing thereafter, pointing to a process of de-industrialisation at the regional level that would not reverse until the 1970s.
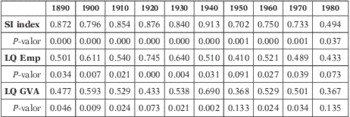
Besides the characterisation of the productive structure of each region, these specialisation indexes may have a clear relation with the regional levels of GDP per capita. In order to assess this hypothesis, Table 3 presents the coefficients of correlation between GDP per capita of each region and the three different indexes. As may be expected, there is a positive relation between the three different indexes and GDP per capita. What perhaps may be counter-intuitive, to a certain extent, is the fact that the intensity of this relation until 1970 is very strong in the case of the Krugman Index but is much less evident for the LQs. This could be due to two different causes. On the one hand, there may be significant productivity differences in the industrial sector of the different regions, which may counterbalance the potential impact of industrialisation on economic growth. On the other hand, the closer relation of the SI index with GDP per capita levels may suggest that the emergence of the service sector may have also played a decisive role in the expansion of economic activity in the more dynamic regions. The evidence presented in the next exercise suggests that both explanations were significant.
COEFFICIENT OF CORRELATION BETWEEN GDP PER CAPITA AND LQ GVA

LQ: location quotients; GVA: gross value added.
Table 3 also shows that the correlation of the three indexes with regional GDP per capita decreases significantly during the last decade. This may be due to the convergence in the productive structure of the Portuguese regions during the last decades of the period. The fading relation between regional productive structures and GDP per capita may indicate that productivity changes are the main drivers of regional inequality during the 1970s.
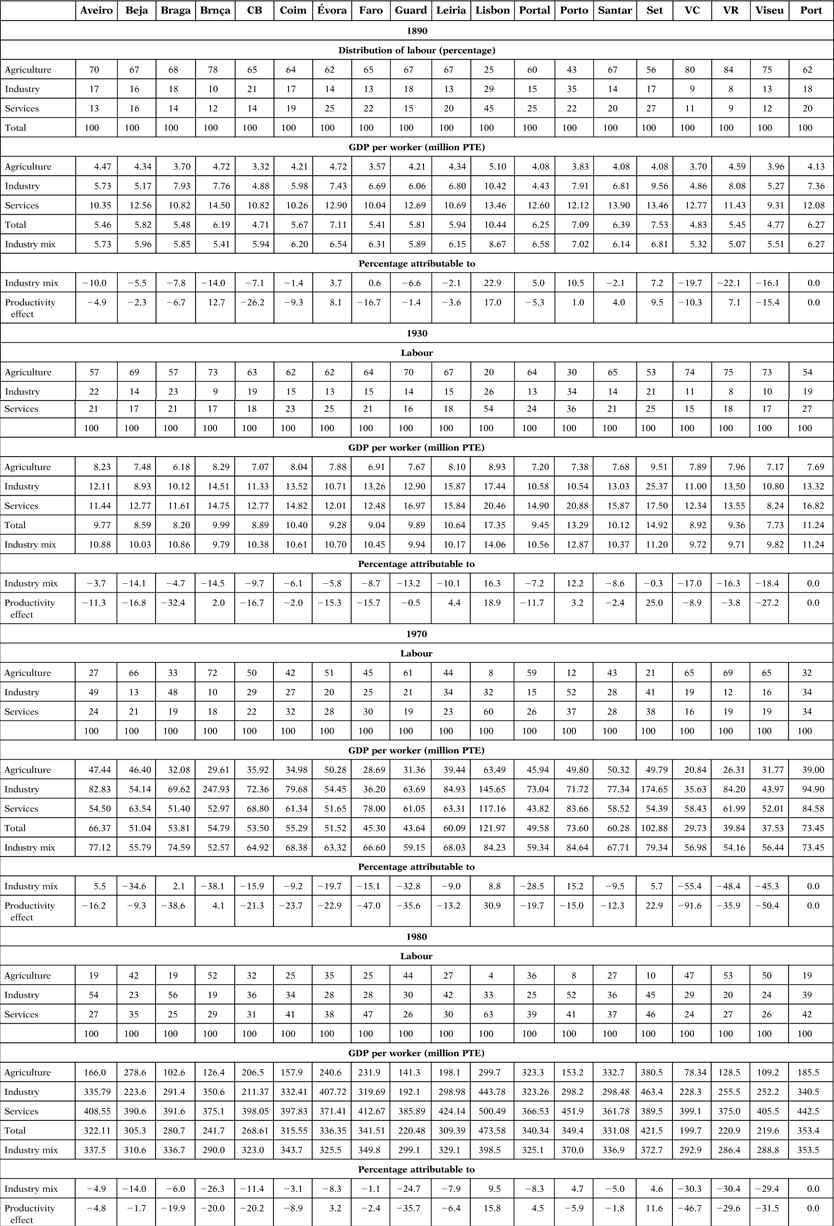
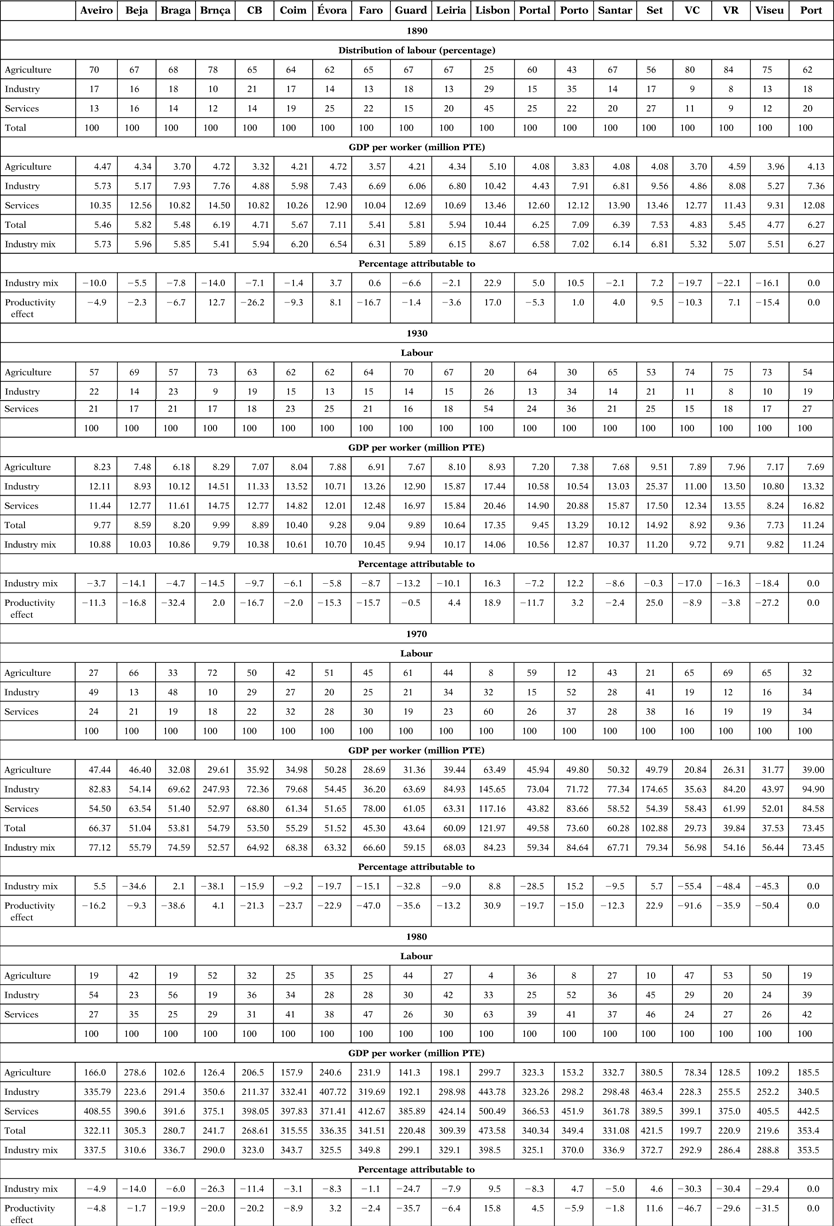
Kim (Reference Kim1999) provides a useful exercise to identify the causes that may explain income differences at regional level. It consists of estimating two hypothetical GDP per worker values. The first is based on the assumption that all regions have the same productivity levels for each sector, and also, that the distribution of the labour force among the different sectors (industry mix) is identical, which would provide an estimate of per worker GDP equal to the national average. The second hypothetical per worker GDP is estimated on the assumption that each region has the same productivity level at industry level but they have different industry mixes. The difference between the two hypothetical incomes provides a measure of income differences due to the divergence in regional industrial structures (industry mix effect). The difference between the actual and the hypothetical industry mix per worker GDP provides a measure of regional per worker GDP differences due to the divergence in productivity (productivity effect).
We also found a strong correlation between industry-mix effects and productivity effects, although the intensity of those effects varies in each region. This relation would imply that there may be economies of scale and agglomeration effects, because this exercise shows that when the productive structure tends to be specialised in industry or services those sectors tend to have higher productivity levels (see Table A4).
Both industry mix and productivity effects have a sizeable impact on the divergence of regional incomes and their relative importance is very similar. Another regularity that should be mentioned is that the divergence of each region tends to be explained by the same force (productivity effects or industry mix) over time. The causes of success and failure of the different Portuguese regions, therefore, would be extremely stable in the long term, which may serve as a guide to the implementation of regional policies aimed at reducing regional inequality. In this sense, if regions diverge because of industry mix, they should promote structural change, whereas if the divergence is due to productivity levels, they should focus their attention on increasing their productivity at the sector level.
This exercise may also be useful to analyse the process of economic growth in Portugal at regional level. Not only are there remarkable differences between the different districts, but also the causes of their divergence differ significantly. It is interesting to focus on the case of Porto. Porto's relatively high per capita income is explained by the industry mix (with a large share of employment in the industrial sector) because productivity effects run in the opposite direction. This is due to the fact that Porto's industrial sector was very large but its productivity levels were below the national average. This situation shows that Porto is specialised in relatively backward industries, such as the textile industry. Porto, until 1980, was the largest industrial region of Portugal both in absolute and in relative terms and it is particularly striking that scale economies and agglomeration effects did not, in fact, appear here.
The case of Lisbon is different, because both industry mix and productivity effects contributed to Lisbon's higher level of GDP per worker. Setúbal is the third region in terms of GDP per worker above the average until 1980. The process of structural change in this region advanced with a very similar timing to the situation at national level, whereas sector productivities were almost always above the national average. In contrast with the case of Porto, then, Setúbal's success would be explained by productivity effects alone.
The remaining regions are below the GDP per worker national average and can also be classified in three different groups according to their main driving divergence force. Aveiro, Braga, Coimbra and Faro's divergence is mainly explained by productivity effects. Beja, Bragança, Leiria, Portalegre, Santarém and Vila Real's divergence is mainly due to their industry mix. In the remaining regions, Castelo Branco, Évora, Guarda and Viana do Castelo and Viseu, both factors play a significant role.
5 CONCLUSIONS
Regional inequality in Portugal followed an inverted U-curve with a turning point in 1970. The ranking of regional per capita income was quite stable over time, although the distance between the top and the bottom regions followed the trend in the evolution of regional inequality closely. In order to see the causes behind the evolution of regional inequality, some exercises were carried out. The evolution of the Krugman Index (SI) shows that regional specialisation also increased until 1970 and decreased thereafter. In 1970, the Portuguese regions achieved maximum heterogeneity in terms of their productive structure. From another perspective, the LQs depicted the same process, showing that the majority of Portuguese regions de-industrialised up to 1970, in the period of highest degree of aggregate national industrialisation. The strong correlation between the share of regional industrial and service sectors and relative productivity levels points to the existence of scale economies. This relation holds in most Portuguese regions, in the sense that both regional productivity and productive structure pushed regional per capita GDP in the same direction, above or below the mean per capita income.
The reasons behind the evolution of the regional inequality also explain the delay in the peak of the inverted U-curve that we observed in the case of Portugal. First of all, a large part of the increase of the regional inequality is explained by the impact of agglomeration economies in the most developed regions, in a context of the intense productive specialisation, accompanied by productivity gains, especially in the industry and the service sectors. This process was favored by the home market effect during the internationalisation of the Portuguese economy, as Buyst (2010) showed for Belgium. Second, the observed inequality pattern can be explained by the differences of the industrial productivity among provinces, and the difficulties that the more traditional industrial and agricultural sectors experienced in their attempts to modernise. Third, the expansion of the service sector, after 1970, led the reduction in regional inequality.
Portugal thus highlights a comparable case of the evolution of regional inequality in Europe. The major difference was in terms of the late peak of inequality levels registered up to 1980, which may be explained by the fact that it was a peripheral economy lagging behind the rest of Europe in many indicators, including the one analysed in the present paperFootnote 8.
APPENDIX
KRUGMAN INDEX

Source: Figures come from Badia-Miró et al. (Reference Badia-Miró, Guilera and Lains2012).
LOCATION QUOTIENTS EMPLOYMENT

Source: Figures come from Badia-Miró et al. (Reference Badia-Miró, Guilera and Lains2012).
LOCATION QUOTIENTS GVA

GVA: gross value added.
Source: Figures come from Badia-Miró et al. (Reference Badia-Miró, Guilera and Lains2012).
DIFFERENCES IN REGIONAL INCOMES ATTRIBUTABLE TO INDUSTRY MIX AND PRODUCTIVITY
CB: Castelo Branco; VC: Viana do Castelo; VR: Vila Real; PTE: Portuguese Escudo.