

Introduction
Many authors have carried out work on settlement studies in archaeology, sometimes focusing on interactions between human groups and the environment, sometimes focusing on relationships between individuals or between human groups, and sometime to visualize and understand how urban networks were born and developed. In every specificity, the main common objective has been to understand how human groups developed in a determined geographical environment and what influenced these evolutions. But, as David Clarke (Reference Clarke1973, 17) noted, ‘archaeology is a discipline that seek to understand unobservable hominid behaviour patterns from indirect traces in bad samples’. In fact, archaeological data are often missing and the global tableau would result in a cracked mirror held to reality. In order to fill these lacunae and to provide a most complete framework for human and environmental interactions, some scholars, especially since the 1950s, adopted interdisciplinary approaches. These approaches, based on archaeological and sometime historico-archaeological data, were then studied through theoretical frameworks to generate models leading to the best fit with reality. The intent has always been to understand how different human groups, individuals or urban entities interacted in a given context. The objective was therefore to make missing data talk, composing a framework as wide as possible. The final objective was also, when possible, to understand how these elements evolved through time.
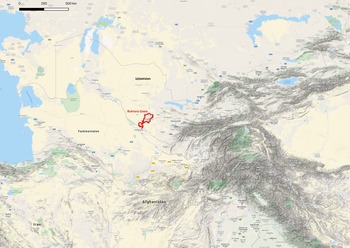
In this context, acknowledging differences in the quantity and quality of data and methods employed, the archaeological study of the Bukhara oasis (Fig. 1) aims to identify the dynamics of population and depopulation within this region. The time frame begins with the birth of the earliest settlements, attested to around the third century bce, tracking their slow depopulation which started in the thirteenth century ad and was mostly complete in the sixteenth. As will be explained below, recent surveys and archaeological excavation brought to light sufficient material to compose a fairly complete historico-archaeological framework, showing the distribution of settlements within the oasis since its geomorphological origin.
Western Central Asia, showing the location of the oasis of Bukhara. (© Google Earth topography).

This paper assesses the quantity and quality of archaeological data to understand the structure of the system of citiesFootnote 1 in the oasis. Our aim is to investigate the oasis as a whole to perform a systemic analysis. Our objectives are, first, to compare the urban system of the oasis with modern urban systems; secondly, to study the impact of the caravan roads on the structure of cities; and thirdly, to provide an explanation for the characteristics of the urban system of the oasis through reference to economic theory. We examine archaeological data, compare the ancient economy to modern institutions and employ modern economic theory and methods to understand aspects of the ancient society and its organization. The questions addressed in this paper relate to fundamental questions: How much does the past resemble the present? And if there is a similarity, what is it its explanation?
Naturally, the breadth of these questions requires a selective focus. In our case, this focus will be on the size and structure of cities, considering the size (or area) and the structure as elements corresponding to the degree of complexity in the development of a settlement, and therefore as two measures of socio-economic dynamics. In particular, in this paper we study the total area of cities in the oasis, their distributions in space and the effects of the Silk RoadFootnote 2 on the internal structure of each city. Initially, we study the oasis’ urban system from the perspective of a set of rank-size relationships, using the case of Bukhara to explain and illustrate our method. After a description of the oasis and its change over time, we present the archaeological methods and the evidence, describing each type of settlement found in the oasis, its evolution, and the city-state system as a whole. Upon this foundation, we explore two questions. First, we investigate variation in city size between the Bukhara oasis and a modern economy (the USA), establishing similarities in patterns that lead us to reconsider modern explanations for variation in city sizes. Secondly, we evaluate the impact of the Silk Road on the Bukhara oasis, describing qualitative similarities with observed patterns in modern economies.
We interrogate Zipf's Law, both to say something about the ancient Bukharan urban and human landscape and at the same time to test Zipf's Law, as applied to modern case studies, in ancient fields and epochs. As a linguist, George Zipf noted that there is a link between the frequency of employing a word and its rank. The same applies to other relationships, such as the distribution of revenues in a country or the distribution size of cities (Zipf Reference Zipf1941).
The former aim, as explained below, stems from our initial questions about the spatial distribution of settlements within the oasis. Once the geographical distribution and the size of population which settled in each site has been determined through surveys and topographical activities, we inquire about the reasons for such a distribution. Why were people distributed in such a way? Why were more populated sites in specific locations, and other ones elsewhere? An initial understanding could come from the analysis of satellite images, thus verifying the landscape and locational data, as well as identifying the routes linking places. Yet because this patterning was not clear, we considered Zipf's Law to generate ranking of the site data, starting from secure archaeological data sets, to observe and explain the distribution pattern.
Previous research: a multidisciplinary endeavour
Questions of spatial structure and interaction across a region have been treated by many scholars. The aims are varied, from assessing pre-agricultural periods, as for example complex hunter-gatherers (Arnold Reference Arnold1996; Dornan Reference Dornan2002; Hayden Reference Hayden1998), or spatial distribution of settlement modelling, in which Alan Wilson (Reference Wilson1967; [Reference Wilson1970] 2011, Reference Wilson2000; 2008; Reference Wilson2010; Reference Wilson2012a,Reference Wilsonb; Bevan & Wilson Reference Bevan and Wilson2013) is one of the most prominent researchers. Researchers highlight different social factors, including prestige, egalitarianism, complexity, inequality, or dominance, that lend themselves to establish a classification, or a rank. As Paul Wason (Reference Wason1994, 128) attests, ‘any differentiation among settlements sufficient to indicate the dominance of one or more is a settlement hierarchy’. Establishing an archaeology of rank, in the specific case of settlement distribution Wason stresses the importance of a definite territory, reflecting the impact of trade, administration and regional defence on the patterning (Wason Reference Wason1994, 127 [citing Trigger 1989, 285]). Ranking implies differentiation and thus stratification (Ames Reference Ames, Bentley, Maschner and Chippindale2007, 488–90), inherent to individuals or to settlements, which led to a hierarchy in the distribution, different to a ranked society, in which there is different access to prestige (see Clarke & Blake Reference Clarke, Blake, Brumfiel and Fox1994), but not to basic resources (Ames Reference Ames, Bentley, Maschner and Chippindale2007, 495).
One of the most widely used attributes to identify stratification is area, which includes a model of a stratified society, rather than a ranked one. In the Bukhara oasis, as in a stratified society, settlements are marked by elites who wielded tactical and organizational power deriving from the political economy (Ames Reference Ames, Bentley, Maschner and Chippindale2007, 495). However, it is difficult to identify this distribution and hierarchy in an archaeological context with partial data, at least compared with the data available in modern sites. Since the 1970s, Wilson has studied and realized models making the best use of partial data, in a process called entropy maximization (Wilson Reference Wilson1967; Reference Wilson1969; Reference Wilson1970; Reference Wilson2000; Bevan & Wilson Reference Bevan and Wilson2013). In appendix 1 of ‘Models of settlement hierarchy based on partial evidence’, Bevan and Wilson (Reference Bevan and Wilson2013) published mathematical models concerning the development of partial interactions in a contemporary context, for example to estimate the flow of money from consumers to retail centres. The authors then used it to estimate the spatial distribution of settlement sizes in Bronze Age Crete, also estimating the missing data, but estimating for the initial models the medium- to large-sized Cretan settlements. The mapped results are useful to understand the nature of interactions among comparable sized settlements, revealing a more complete picture of the regional network of different sites.
Another example showing the application of the ‘entropy of maximizing’ to understand settlement structures was published by Davies et al. in Reference Davies, Fry, Wilson, Palmisano, Altaweel and Radner2014. More specifically, the authors adopt the entropy-maximizing method to create a dynamic model of settlement structures in the Khabur Triangle from the Middle Bronze Age (MBA) and Iron Age (IA). The latter approach shows a structural evolution of settlements in this region from a wide chronological range, applying the Boltzmann and Lotka-Volterra methods (Wilson Reference Wilson2008).
A further study, carried out by Anthony Sunders in 2016 shows how we can apply an economic approach to archaeological data, employing the Huff Model. This study and method focus on trade areas for retail centres in the specific case of Central Idaho, USA. Although distant from the Bukhara oasis, the study employs economic tools in an archaeological field (Rante & Mirzaakhmedov Reference Rante and Mirzaakhmedov2019; Rante et al. Reference Rante, Fouache and Mirzaakhmedov2016).
The size distribution of cities has been extensively studied in other social sciences, from the works of Zipf (Reference Zipf1949) to modern studies, reviewed extensively in Gabaix and Ioannides (Reference Gabaix, Ioannides, Henderson and Thisse2004).Footnote 3 One thing these studies share is use of data for modern economies. To explore city size distribution for the ancient economy of Bukhara, we follow the recommendation of Pumain (Reference Pumain and Holm1997, 7) to compare the size distributions of cities in the very long term, from antiquity to the Medieval period. We then compare the histograms with modern cases from the USA. Building upon previous studies of archaeological data, this paper presents differences in the quantity and quality of data for Bukhara oasis.
We performed a systemic analysis of the effect of the Silk Road on the structure of cities as well. We investigated archaeological data to test whether the role as a stopover city on the caravan roads had an impact on urban structure. The Bukhara dataset allowed for such a study, because it accurately measured the urban structure, distinguishing between the citadel, the residential area and the areas used for manufacturing/production and for the market. The presumption was that a stopover city stimulates growth in the manufacturing sector and marketplace because of the expenditure coming from the caravans. The effect of exposure to imported wealth on city size and on local employment for modern economies is well documented: see e.g. Redding and Sturm (Reference Redding and Sturm2008) and Brülhart et al. (Reference Brülhart, Carrère and Trionfetti2012). For ancient economies, this has not been assessed. We discovered remarkable similarities between past and present.
In the remaining sections of this paper, we describe the oasis and its evolution, investigate the city size distribution and perform an analysis of the impact of the Silk Roads on the structure of cities. Finally, we discuss possible explanations for the findings with reference to Zipf's Law (1949).
The oasis and its evolution
Archaeological methods
The geoarchaeological activities in the Bukhara oasis were accomplished in phases: a geomorphological survey of the territory, an archaeological survey of the settlements of the region, in which is included study of topography, and the excavation of the main sites.
The survey of the Bukhara oasis, in which are incorporated both archaeological and geomorphological operations, was conceived in three steps. The initial step was to collect maps and documents concerning the region. The second was to carry out an archaeological survey, dependent on the nature of the existing data. Finally, digitization of all the data and integration into a GIS database was completed.
For the former analysis, several maps were employed. The first was a geographical map based on Esri imagery (WorldView). Its resolution afforded an initial check of the sites, later verified on other maps, as well as in the field. The 1893 (Rante & Mirzaakhmedov Reference Rante and Mirzaakhmedov2019, fig. 3) and 1989 maps (Rante & Mirzaakhmedov Reference Rante and Mirzaakhmedov2019, fig. 4) were the most complete maps of the whole oasis and were useful in establishing the evolution of sites and the different conditions within the oasis. While the 1893 map was helpful for recognizing the watercourses and their limits in the nineteenth century, as well as toponyms, the Soviet map was useful for the identification of the tepe of the oasis, as well as the territorial evolution of the watercourse network.Footnote 4
The second step involved survey of the entire oasis, an operation following an earlier survey by the Archaeological Institute of Samarkand in 1990,Footnote 5 which the latest research, with the aid of advanced technologies, has revealed as incomplete. After the data were acquired, selection and typological identification of the sites was carried out. The different typologies were organized on a chronological scale and then studied in the context of their individual water and road networks.
Subsequently, all data were studied together with the excavation contexts. The extensive archaeological activity over several sites within the whole oasis provided data with which to identify the settlement distribution on a chronological scale. One result was a superposition of settlement layers relating to every geographical element. Finally, human settlements were studied in their complexity, dealing with their foundations, structural elements (or layouts), defensive systems and urban organization. Accurate identification of the sites to be excavated within the oasis was an important consideration. It was, in fact, possible to compare the results obtained from the excavations with the archaeological evidence of the other sites which globally have shown a homogeneous cultural evolution within the oasis over the centuries. This cultural trend observed since the earliest occupations is valid until the tenth century, when Bukhara became the capital of the extensive Samanid Kingdom (819–1005), concentrating production and commerce, and thus a large part of the population of the oasis and that from elsewhere. Each site excavated was chosen for its territorial, topographical and historical peculiarity, every site different from the others, thus providing cultural markers to be taken as references for the global study.
Those roads that were connected with trade of medium to large scale, which we could call ‘Silk Roads’ or preferably ‘caravan roads’, with detailed itineraries crossing the oasis, according to written sources, as well as itineraries for other territories of Central Asia. The roads shown on the 1893 map were associated with the historical sources referring to the most important ones.
Geographical setting
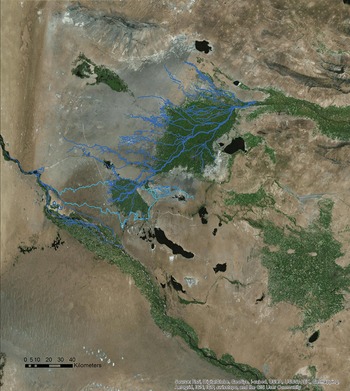
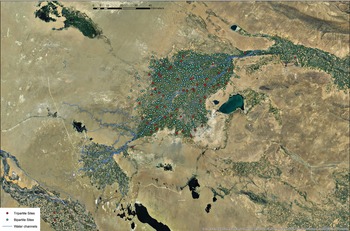
Today, the final section of the Zerafšan River, originating 741 km upstream from the Alai Mountain and the Zerafšan glacier in Tajikistan, flows along a northeast–southwest channel to which a dense network of irrigation and drainage channels is connected. Regional maps and satellite images (Fig. 2) show that these canals follow palaeochannels of the Zerafšan River, and that this river changed during the Pleistocene and Holocene periods.
Map of the oasis of Bukhara and its palaeochannels (© R. Rante 2018; ESRI Imagery.)

The joint oases of Bukhara and Qaraqöl, supported by this dense hydrographic resource, are located in the southeastern part of Uzbekistan. Covering approximately 5100 sq. km, they are bounded to the north by the Kyzyl Kum, a huge erg [a broad, flat area of desert covered with wind-wept sand with little or no vegetative cover], and to the south by the Kara Kum. To the west flows the Amu Darya River, with a south–north course. To the east, the Zerafšan valley is bordered by ranges of cretaceous limestone.
On the basis of correlations among the periods identified through archaeological data and OSL dating, the dynamics of changes to the delta from the Middle Pleistocene to the late the Bronze Age are known.Footnote 6 Geo-archaeological study of the oasis (Rante & Mirzaakhmedov Reference Rante and Mirzaakhmedov2019, 13–22) shows that human occupations located along the present Zerafšan main channel, especially its upper section, such as Iskijkat, and lower section, Paykend, as well as those around the Qaraqöl micro-oasis, cannot be earlier than the third century bc. That dating fixes the last established translation of the Zerafšan main channel to a period slightly earlier, respecting a reclamation ground dynamic, around the fourth century bc. From that period until the present, the delta has not changed, and an intense activity of inner hydrographical transformation, responding to human needs, has taken place.
Until the 1960s the Bukhara oasis received water for irrigation only from the Zerafšan River. In the early 1970s, a canal was created from Amu Darya to the oasis of Bukhara. Today, some 1.2 million people live in the Bukhara oasis and more than 230,000 ha of land are irrigated.
Type of settlements
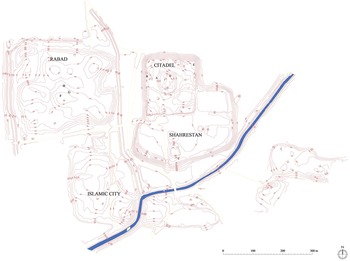
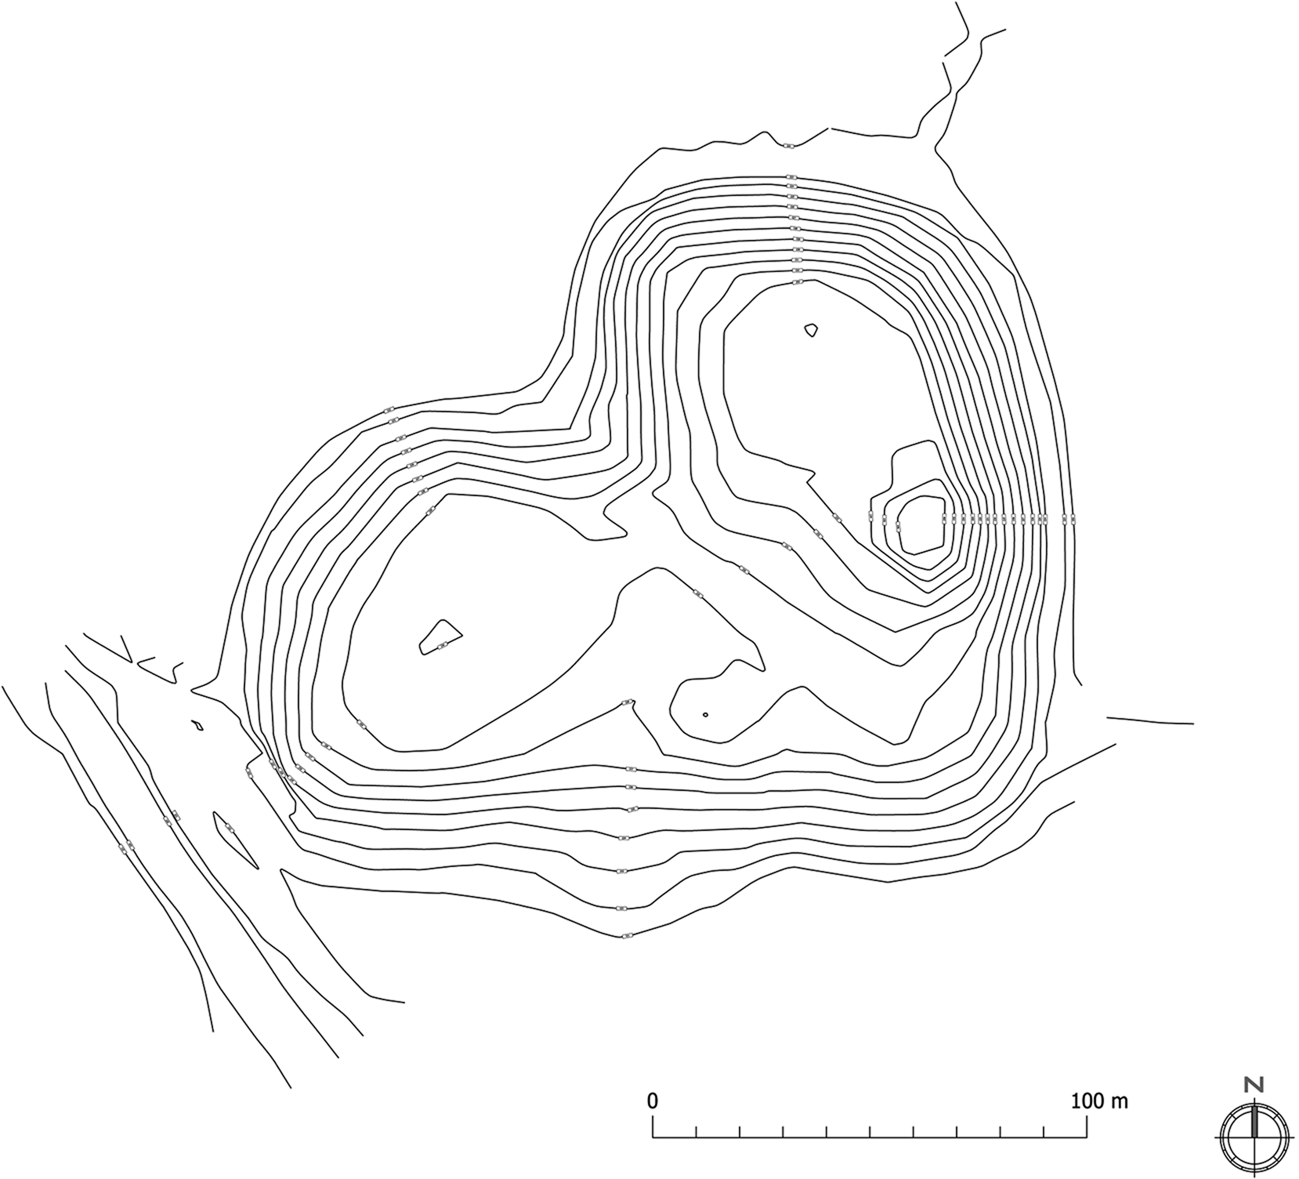
The survey teams recorded 1040 sites, ranging from several artificial mounds, or tepe (corresponding to the overlapping of human occupations), to urban entities. Of these sites, 53 are tripartite sites comprising a citadel, a lower city and a suburb (Fig. 3), 290 are bipartite sites constituted of a citadel and a lower city only (Fig. 4) and 319 are isolated sites or single tepe (Fig. 5). The remaining 378 sites represent archaeological evidence of human activities, cemeteries, isolated monuments and others, but outside substantial settlements. Some are scattered areas of pottery or temporary occupations, water pits and the like, that cannot be integrated into the urban-sedentary system. A large number of the sites have been surveyed with the Georeferential GPS instruments and then measured and studied integrating all surveyed and/or excavated data sets. Moreover, the study of the urban layout, monuments and material culture, across a wide chronology, offers robust data with which to estimate demographic change with a high degree of confidence.
Romitan: Plan of a tripartite site. (© Rilievi srl; R. Rante 2018.)

Site 250: Plan of a bipartite site. (© Rilievi srl; R. Rante 2018.)

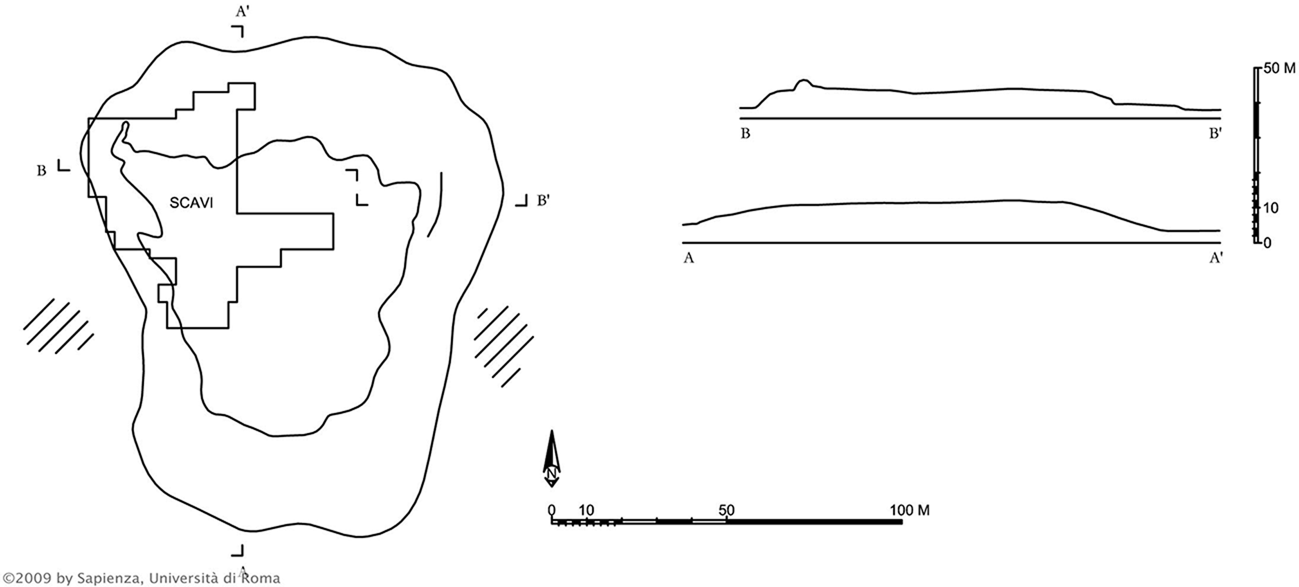
Uch Khulakh: plan of a single tepe. (© Università degli Studi di Roma; Silvi-Antonini & Mirzaakhmedov Reference Silvi Antonini and Mirzaachmedov2009.)

The tripartite and bipartite sites are cities because of their developed urban structure (Fig. 6). The first type, a tripartite site (or city), integrates a citadel, a village and a suburb. The citadel hosted the political activity (royal or other forms of government) and was fortified. The village hosted the largest sector of the population, was sometimes fortified, and at times contained administrative buildings. The suburb hosted commercial and manufacturing areas and often provided areas for caravan stopovers. The latter sector, containing commercial, manufacturing and stopover areas, was designated the business district.
The oasis of Bukhara with palaeochannels; tripartite sites in red and bipartite sites in blue. (© R. Rante 2018.)

Bipartite cities, constituted by a citadel and a village, were structured similarly to those of the tripartite cities, but without a business district.Footnote 7
Lastly, the isolated settlements contain none of the three sectors and were not included as cities in the analysis. These sites consisted of a manor, or a caravanserai, or a fort or large, isolated farms. The smaller isolated sites, agriculturally self-sufficient like the bipartite sites, depended politically and economically on tripartite sites, revealing socio-economic interdependencies within the oasis.
City size distribution and city structure
Cities differ in size and structure. Since the dawn of history, cities have varied in size, but are there systematic patterns? Our first objective was to assess city size for the Bukhara Oasis, through a rank-size model, in light of Zipf's Law. We then compared it to the pattern observed in modern times. A resemblance between past and present patterns is observed, although differences are recognizable. We reconsider the theoretical explanation for the rank-size distribution in the light of these comparisons below.
The second objective was to investigate the structure of the city. Some cities have a large manufacturing sector and large marketplaces, while others do not. What patterns are visible beyond this initial contrast? We will first characterize the pattern observable in the Bukhara oasis, especially in relation to its proximity to the Silk Road, then explain it as a pattern in the light of economic theory.
Patterns of city size
Zipf's Law states that the number of cities with populations greater than S is proportional to 1/S. It implies the following relationship between population size and a city's rank: the population of the second most populous city (rank = 2) is half of the population of the most populous city (rank = 1); the population of the city ranked third (rank = 3) is two-thirds of the population of the city ranked second (rank = 2), and so on. The general rule is that the population of the city ranked nth is equal to nth–1/nth times the population of the cities ranked nth–1. Three questions follow: first, why does city population differ? Modern people are accustomed to living in a world where cities differ by population. Yet city populations result from diverse, uncoordinated individual decisions. Second, even if there is an economic or social reason for differences in population, it is intriguing that the population decays from the most to the least populous cities according to the equation described by Zipf. Why is the population of the nth city equal to nth–1/nth times the population of the cities ranked nth–1 and not any other number? Third, given differences in the history and geography among different modern countries, one would expect the rank-size relationship to differ when computed on sets of cities across the globe. Instead, empirical studies find that Zipf's Law corresponds to the reality for many urban systems in many countries for modern times. The data fit Zipf's Law particularly well for larger cities.
Patterns of city structure
With little knowledge of city structure, researchers would probably imagine a world in which cities are exact replicas of each other; but they are not. Cities in modern times exhibit very different patterns; some are industrial centres, others are mainly agricultural cities, while still other cities have large service sectors. In studying the Bukhara oasis, we sought to understand the causes of these patterns. In particular, we sought to explain the city structure through reference to the Silk Road. Is the structure of those cities most shaped by the Silk Road and its activities different from other cities? We try to answer this question qualitatively (answering yes or no) and quantitatively (by how much). Interestingly, we find qualitative similarities between Bukhara and other examples in modern economies. Through a systematic analysis of archaeological data and in the light of economic theory we can ask new questions, properly identify existing patterns and better understand past (and modern) societies, developing archaeo-economics.
Zipf's law and size distribution
Formally, Zipf's Law for cities may be written as follows:
 $$\eqalign{& {\rm ln}\;Rank = c_0 + c_1\;{\rm ln}\;Pop \cr & where \ c_0 > {\rm }0\;and\ c_1 = \ndash 1}$$
The coefficient  $c_1$ is known in the literature as Zipf's coefficient, and Zipf's Law says it is equal to –1. We can also picture Zipf's law graphically as follows. Consider a set of cities; rank them by population size and draw a graph plotting the logarithm of the population on the abscissa and the logarithm of the rank on the ordinates. Then plot dots whose coordinates correspond to each city's logarithm of rank and population. Connect all the points. Zipf's Law predicts that connecting the points gives a downward sloping straight line whose slope is exactly –1. The resulting line is straight: why not convex or concave? Secondly, the slope is –1: why not –7 or –2000? Thirdly, the –1 relationship is found for many sets of cities in many different countries. To understand the significance of the slope better, note that if the differences in city population are small, Zipf's coefficient would be near to minus infinity. If, instead, the differences in city population are enormous, Zipf's coefficient would be close to zero. Thus, the magnitude of Zipf's coefficient is a measure of the differences in the population of cities: when the magnitude of the coefficient is small, the difference is large. When Zipf's coefficient is equal to –1, our data reflect Zipf's Law. Empirical verifications of Zipf's Law involve estimating the coefficients c 0 and c 1 using actual population data. It is customary to denote such estimations as ĉ 0 and ĉ 1, respectively. Zipf's Law is verified empirically when ĉ 1 is ‘most likely’ equal to –1. What does ‘most likely’ mean in a statistical sense? It means that there is a 95 per cent probability that the true value ĉ 1 (not observed) is exactly –1.Footnote 8
A comparison between ancient and modern economies
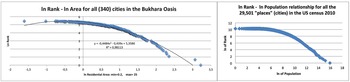
This section compares the data of the Bukhara Oasis with data of modern studies realized on cities in the USA, in order to test and validate the method. Figure 7 shows the rank-size relationship for the US cities (census data for 2010) compared to relationship for the 340 bipartite and tripartite cities of the Bukhara oasis. This comparison is interesting because it refers to two distinct socio-economic realities: the modern and complex US economy of the twenty-first century and the ancient economy of the Bukhara oasis in the ninth–tenth centuries.
Rank size distribution: Bukhara oasis (left) and USA (right).

The two distributions are remarkably similar in spite of separation in time and space. Both relationships are concave, and for a subset of cities, both relationships satisfy Zipf's Law. The subsets are not the same, however. Of 29,501 US cities (called ‘places’ in the census terminology), only the largest cities satisfy Zipf's Law.Footnote 9 Many other studies show similar results for modern economies.Footnote 10 Among the 340 bipartite and tripartite cities of the Bukhara oasis, only the group of medium-sized cities satisfies Zipf's Law, and these account for 57 per cent of all cities. There is an inherent difference between estimations for modern economies and for the Bukhara oasis due to the nature of data. In estimating Zipf's Law for the Bukhara oasis, population data are unavailable so the area of the residential area of the city serves as a proxy for population. In Figure 7, the abscissa of the left panel (Bukhara oasis) reports the logarithm of the residential area, while the abscissa of the right panel (USA) reports the logarithm of the population. To verify the validity of Zipf's Law for the Bukhara oasis, analysis proceeded in reverse, asking first what the population of cities would be if they had to satisfy Zipf's Law, then assessing whether such a population is plausible, given the archaeological and historic data. The first step involved computing the population per city that would satisfy Zipf's Law for all the 340 cities for which usable data exist.Footnote 11
The results of this reverse process contrasted with plausible estimates of population per hectare from archaeological or historic data. For instance, this calculation gave a population of 18 persons per hectare in the smallest cities, suggesting that the entire set of cities of the Bukhara oasis do not satisfy Zipf's Law, a conclusion precisely in line with what was observed for modern economies. As already mentioned with regard to the US data, only the largest cities satisfy Zipf's Law.
Our second step sought to discover the subset of cities in the oasis of Bukhara for which we could compute a population per city that satisfied Zipf's Law and that gave plausible population figures per hectare. Only the subset of 193 cities with size ranges from 1.4 to 3.7 ha fit Zipf's Law, implying a plausible population per hectare that ranged from 160 to 200 persons.
Theoretical explanation for Zipf's Law and evidence from the Bukhara Oasis
We examined the evolution of city size from the third century bc to the eighth century ad. Before doing so, we briefly discuss theoretical explanations for Zipf's Law proposed in the literature. Three categories exist: the first depends on economic mechanisms typically associated with mature economies, such as economies of scale and the evolution of transport technology. If city sizes are different, it is due to economic factors that push people to agglomerate in a small geographical space: a city. For instance, large-scale production technologies (think of car factories or steel mills) require thousands of workers to reside near a factory, which contributes to the formation of large cities. On the other hand, the high rents that characterize large cities push towards the formation of smaller cities. The different strengths of these agglomerative or dispersive forces could, in principle, give rise to cities of different size and to Zipf's Law. Research along these lines has been fruitful in many respects but, as noted by Fujita et al. (Reference Fujita, Krugman and Venables1999) in a comprehensive study, fails to explain Zipf's Law for cities.
A second category of explanations refers to random growth. Influential theoretical papers (e.g. Eeckhout Reference Eeckhout2004; Gabaix Reference Gabaix1999; Simon Reference Simon1955) have shown how random growth processes influencing cities that are initially similar leadsthe rank-size distribution to converge toward Zipf's Law in the long run. An analogy with the throwing of dice may help illustrate. The most likely number obtained by throwing two dice is seven. Not every single throw necessarily gives seven, but the average calculated across repeated throws converges to seven. The emphasis is on convergence over time: in the long run (and only in the long run), we observe that Zipf's Law holds. Furthermore, if another factor perturbs the Zipf's Law relationship reached in the long run, a new random process begins, ultimately converging to Zipf's Law. Each city's position in a ranking will probably not be the same as it was before the perturbation. For instance, if we perturb the current rank-size relationship in the USA, a new random process will eventually ensure that in the long run Zipf's Law is again satisfied, but New York would most likely not be the largest city since another would have taken its place, and the same for all the other cities.
A third category of explanation for Zipf's law for cities is based on the heterogeneity of location fundamentals. Such an explanation posits that the exogenous characteristics of available locations suitable for human settlement are such that they give rise to Zipf's Law for cities. Applied to this case, the location fundamental theory would tell us that different locations within the Bukhara oasis have different exogenous appeal (fertile land, water, morphologic configuration) and that such appeal is distributed in Zipf's fashion, thus attracting population in a way that conforms to Zipf's Law. This theory predicts persistence over time rather than convergence. According to this third theory, the rank-size relationship satisfies Zipf's Law time after time, and from the beginning of time. Furthermore, if something comes to perturb it, not only does Zipf's law return to hold in the long run, but also each city's position will be exactly the same. Davis and Weinstein (Reference Davis and Weinstein2002) find strong evidence for this persistence; only three decades after the nuclear bombing, Hiroshima and Nagasaki returned to the same position in the ranking of Japanese cities that they had held before the Second World War.
For the purpose of trying to elaborate the relations between the predictions of Zipf's Law and the Bukhara oasis patterns, we tracked the evolution of the rank-size distribution in the Bukhara oasis over thirteen centuries, grouped into three time periods. We considered the size of cities (measured by area) for three periods: the first from the third to the first century bc; the second from the first to the third century ad; and the third from the third to the eighth century ad. The area of the sites was measured by direct observation from the topography, which gives the last expansion of the urban sprawl. Excavation of the major settlements provided the size of those cities in different epochs. Through comparisons, we assumed that the area of non-excavated sites was no larger than the largest for which we have direct observation. A population estimate of 200 people per hectare was used.
First period: Fourteen settlements existed between the third and the first century bc, and all cities occupied an area of approximately one hectare. Clearly, there is no Zipf's Law for this period because all cities are the same size. The Zipf's coefficient is near minus infinity.
Second period: The oasis had 323 settlements between the first and the third centuries ad. None was a tripartite site, but all would become tripartite or bipartite sites later. Their surface areas range from one to three hectares. This variation leaves no room for Zipf's Law for cities. Simply, the Zipf's coefficient would have to be approximately equal to –5.2590 to connect the largest and smallest city using a straight line. There is insufficient variation in the city population distribution to satisfy Zipf's Law for cities.
Third period: For the period from the third to the eighth century ad, 334 settlements were assessed. The variation in surface area is substantial for this period, ranging from 1 to 29 hectares, but not sufficient to satisfy Zipf's Law for cities. The Zipf's coefficient would have to be approximately equal to –1.7258 to connect the largest and smallest city with a straight line.
Exploration of the earlier centuries finds evidence coherent with the random growth theory, explaining Zipf's Law as a convergence process over a long time. This is what the analysis found—namely, that for none of the three periods before the ninth century ad was the rank-size relationship coherent with Zipf's Law. Furthermore, the convergence hypothesis is supported by the fact that the Zipf's coefficient seems to move towards –1 over time, moving from minus infinity in the first period to near –1.7 in the third period. The evidence in favour of the random growth theory is mitigated, however, by instances of persistence. Perhaps the most striking example is that of Romitan, a city that maintained the third position in the ranking throughout the second and third periods, as well as during the ninth/tenth centuries ad, in spite of adverse political and military events in the sixth century ad. Romitan was, with Bukhara, one of the largest cities in the oasis until these two cities came into conflict for hegemony. Archaeological and historical evidence (Rante & Mirzaakhmedov Reference Rante and Mirzaakhmedov2019) shows that Romitan was conquered and its royal palace destroyed by the Bukhara army in the middle of the sixth century ad. Such an event was probably similar in proportion to the effect that the nuclear bombing had on Hiroshima and Nagasaki. Although Romitan never reacquired the political influence it had before, the city continued to retain its position of third largest city in the oasis in the subsequent centuries. As a remarkable example of persistence, it can be understood by reference to location fundamentals theory.
To complete the description of the evolution of city size, important changes in the structure and organization of production are known to have occurred from the ninth century. Previous rudimentary and homemade production of ceramics evolved into specialized workshops, later concentrated in dedicated areas of the city. Furthermore, excavations realized in Bukhara (citadel and lower city), but also in the suburb of Romitan and in Iskijkat, successively compared with the other surveyed sites, have shown a clear change in production, as part of which ceramics diversified in quality and type. The increase in the quantity and variety of ceramics found from the ninth century onward is testament to this. These changes in the organization of production occurred at the same time as changes in the shape of the rank-size relationship observed in the data. The rank-size relationship seems to have taken the smooth concavity shown in Figure 7 only in the ninth–tenth centuries. In the third period (third–eighth centuries ad), the shape seems to be composed of two straight lines. We have to use the conditional because the lack of precise measurement of the surface of small cities does not allow more precision in the conclusion. However, it is not to be excluded that the change in the organization of production might be responsible for the change in the shape of the rank-size relationship. If this were the case, then the first explanation for Zipf's Law, which rests on agglomeration mechanisms and technology of production, might have some influence in explaining the rank-size relationship observed in the ninth–tenth centuries ad. It turns out that it might have made the rank-size distribution consistent with Zipf's Law for a subset of cities (those whose size is between 1.4 and 3.7 ha), but might also have created the smooth concavity that means that the rank-size relationship is not consistent with Zipf's Law when we consider all the cities of the ninth–tenth centuries ad.
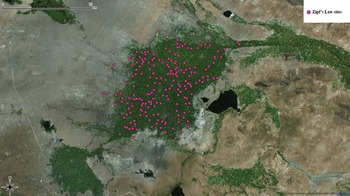
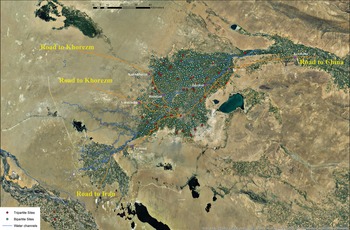
Lastly, looking more closely at the subset of cities that satisfies Zipf's Law for the Bukhara oasis, inspection of the map (Fig. 8) shows that their geographical distribution does not seem different from the distribution of all cities. Interestingly, however, the tripartite sites included in this group are located along the caravan roads, and an important proportion along the major Khorasan Road joining Iran to China (see Fig. 9, Road to Iran–Road to China). Moreover, in this group of cities, the largest and the medium–large ones, corresponding to those with political leadership, are not among those that satisfy Zipf's Law.
Map showing the distribution of the sites through Zipf's Law. (© R. Rante 2018.)

Map showing the main roads crossing the oasis of Bukhara. (© R. Rante 2018.)

The impact of caravan roads on the business district
The relationship between the suburban area (belonging to the tripartite city), the population of the city-state, and the fact of being a caravan stopover city are significant. The suburban area contained the manufacturing activity and the marketplace. This business district corresponds to the suburban area found in each of 53 tripartite sites, and absent from the others. Excavations of several sites constantly showed the presence of production activity and marketplaces (Rante & Mirzaakhmedov Reference Rante and Mirzaakhmedov2019, 192–3, 216–30). The area was calculated from the topography. Here, as in the previous section, the residential area proxies for population. Lastly, archaeological and historical data reveal whether a city was a stopover for caravans. The relationship under scrutiny is the following for each city-state:
 $$Business\_District\_Area = b_0 + b_1Residential\_Area + b_2D$$
where D = 1 when the city is a stopover place on a caravan road and D = 0 if not. The most important stopover citiesFootnote 12 are: 0069 Varakhsha, 0074 Romitan, 0095 Paykend, 0104 Kermana, 0317 Kakishtuvan, 0751 Tavovis and 0847 Iskijkat (Fig. 9). As for Zipf's law, Bukhara has been excluded because of the impossibility of precisely determining its different urban entities. These cities have characteristics that made them an outpost for caravans, such as geographical location or the presence of caravanserais. To compute the population served by the business district of the tripartite sites, we have associated every bipartite and single tepe to its closest tripartite city. The residential area calculated in this way constitutes the variable Residential Area used in our analysis. The statistical method allows estimation of the value of b 0, b 1 and b 2. The values obtained are  $\hat{b}_0 = 0$,
 $\hat{b}_1 = 0.055$, and
 $\hat{b}_2 = 4.207$. This means that an increase in the size of the residential area brings about an increase in the suburban area measured by
 $\hat{b}_1$. Most interestingly, however, the positive value of
 $\hat{b}_2$ shows that stopover cities have larger business districts compared to non-stopover cities. The average size of the suburban area in the oasis is 2.5 ha. Being a stopover city increases the size of the business district area to
 $4.207$ ha, which is an increase of 68.3 per cent. A possible explanation for the effect that being a stopover city-state has on the business district could be the exposure to additional demand. The explanation would be that the additional demand for local goods and services emanating from the people travelling with the caravans could give a push to the business district, directly or indirectly. While formulating a precise theoretical explanation is beyond the scope of the present paper, it is interesting to note the similarity with analogous situations in modern economies. For instance, Brülhart et al. (Reference Brülhart, Carrère and Trionfetti2012) study the effect of that exposure to additional demand on eastern Austrian cities. Such exposure to additional demand occurred after the fall of the Iron Curtain in the years 1990–2002. In those years, eastern Austrian cities found themselves closer than other cities to the new demand for goods and services emanating from consumers located in countries to the east of Austria. The empirical analysis shows that such exposure gave rise to an increase in employment and wages in the eastern municipalities of Austria relative to other Austrian municipalities.
Lastly, it would be interesting to see whether the push to the business district gave rise to an increase in per capita income too. The absence of data on per capita income makes it impossible to test this hypothesis. However, the suggestion finds anecdotal support in some field evidence. For example, Paykend and Kakishtuvan, which are located at the extreme southwest and northwest frontiers of the oasis and traversed by two different main caravan roads, have shown a huge quantity of artefacts in every historical layer, as well as an important dynamic of building activity from the third/second centuries bc to the fifteenth century ad which seems to reveal a higher economic well-being than other cities. The same can be said about Iskijkat. Furthermore, the fact that Iskijkat is situated in the middle of the oasis (away from possible trade with nomads, for example) is further in favour of the hypothesis that per capita income was higher in stopover city-states. Paykend and Romitan contain further anecdotal evidence. These two cities present material that was most probably produced in Iran, such as some kinds of pottery (lustreware or opaque white blue-cobalt type), as well as Chinese coins.
Conclusion
Testing Zipf's Law, the analysis revealed similarities between modern post-Industrial Revolution and medieval economics. The utility suggests it may be a reference model for other archaeological regional data analysis. We have argued that in ancient times the structure of a city was linked with local economic demand, demonstrating this dynamic through the study of cities along the Silk Road in the Bukhara Oasis.
Our approach stimulated new research questions, such as questions about the reasons for the spatial similarities between ancient and modern economic systems, or comparing the economic forces operating now and then. Further investigating how the economic mechanisms might have influenced the history of the Bukhara oasis, we hope to have shown that such an approach is fruitful in terms of findings and offering a broader analytical perspective on change in both ancient and modern economies.
In future, it would be interesting to define better the density of the social networks within the oasis, through their infrastructures and their evolution, for example. Moreover, it would also be interesting to document the density of cities and their relations with population better. One of the most attractive studies on these matters has been performed by Luìs Bettencourt (Reference Bettencourt2013). Although the author presents this research only in a theoretical way and although his work is at present far from the aims of our study, the investigation path employed by Bettencourt can certainly be useful for our further objectives of research.
Acknowledgements
The Louvre Museum, in collaboration with the Ministry of Foreign Affairs, the Archaeological Institute of Samarkand and the Uzbek Academy of Sciences, opened an archaeological mission in the Bukhara oasis in 2009. This cooperation is part of a broader research programme that began several years ago aimed at studying the cultural evolution and population dynamics of the area that links Eastern Iran with Central Iran and Khorasan.