Area variations and whole systems
Differences between European countries in the general health of their populations reflect factors such as age, education and unemployment, as well as GDP per capita and welfare regime (Bambra and Eikemo, Reference Bambra and Eikemo2009; Olsen and Dahl, Reference Olsen and Dahl2007). Spending by governments on health care has little relationship with these differences, possibly because it is already sufficiently high for further expenditure to have limited effect (Olsen and Dahl, Reference Olsen and Dahl2007). The World Health Organisation's recent Commission on Social Determinants of Health (2008) advocates more government action on the determinants of health, especially to narrow within-country health inequalities, and argues for setting specific targets against which progress can be reported. Given the complexity of health inequalities, however, setting targets presents a methodological challenge for understanding how to achieve them (Blackman, Reference Blackman2006).
In England, health inequality targets were introduced in 2000 to ‘close the gap’ in life expectancy and infant mortality by 10 per cent by the year 2010 (HM Treasury, 2000). These gaps are measured between the bottom 10 per cent of local authority areas and the national average for life expectancy, and between manual groups and the population as a whole for infant mortality. Responsibility for delivering the targets was given to the local planning and service commissioning arms of the National Health Service, Primary Care Trusts (PCTs), working with partners, mainly local authorities.
The approach in England has been to target the gap between the poorest sections of the population and the national average, rather than between the poorest and wealthiest groups or the whole health inequality gradient (Graham, Reference Graham2004). This is still a significant policy challenge, given that while the health of the poorest areas and groups has generally been improving, the health of the rest of the population has improved even more (Department of Health, 2008). The causes of health inequality are also complex and associated with combinations of material disadvantage, health-related behaviours and access to services that interact together. This complexity makes it very difficult to take an evidence-based approach. There is an evidence base for tackling health inequalities, but it is not of the type that enables prediction with much accuracy that if ‘A’ is done then ‘B’ will follow in ‘C’ amount of time. Different local circumstances and settings, different ways of working and multiple interactions make such generalisations very tricky (Asthana and Halliday, Reference Asthana and Halliday2006; Bauld et al., Reference Bauld, Judge, Barnes, Benzeval, MacKenzie and Sullivan2005). These factors can be summed up as ‘whole system effects’.
The issue of whole system effects has been brought into sharper focus by the extent to which there is variation in the progress local authority areas in England are making with narrowing their health inequality gaps. The 70 local authority areas in England with the worst health and deprivation indicators were designated as ‘Spearhead areas’ in 2004; these areas were in the bottom fifth nationally for three or more of the following: male life expectancy, female life expectancy, premature mortality from cancers, premature mortality from cardiovascular disease and an official index of multiple deprivation. They include 28 per cent of the national population. The most recent data show that only 14 per cent of Spearhead areas are on track to meet their life expectancy targets for both males and females; for just males 21 per cent are on track and for just females 11 per cent are on track (Department of Health, 2008). Underlying these differences are contrasts in progress with reducing premature mortality due to cancers and circulatory diseases, major contributors to the life expectancy gap.
The local governance of Spearhead areas involves three key players: PCTs, local councils and local strategic partnerships (LSPs). Partnership working is widely regarded as essential to meeting the health inequality targets and is managed through the health partnerships of LSPs, where all the main partners should be represented. The effectiveness of these partnerships very much depends on the quality of relationships across them (Hunter et al., Reference Hunter, Marks and Smith2007). It is possible in this respect to consider the health inequality targets as addressed by a local system: the network of local agents who come together and are interconnected to fulfil a purpose (Plsek, Reference Plsek2001). Outcomes from this system are a reflection of the purposeful design of services, the nature of interactions between agents and contextual attributes (Wrede et al., Reference Wrede, Benoit, Bourgeault, Teijlingen, Sandall and De Vries2006). For example, services may be reactive or proactive, interactions between agents may be more or less aligned to common goals, and contextual attributes such as organisational leadership, aspirations and demographic, ethnic and socioeconomic factors may have a wide range of states that have effects on outcomes. The need to take a whole system perspective follows, and is reflected in recent developments in England towards the area-based assessment of how local public bodies perform (Bundred, Reference Bundred2006).
As attractive as the holism of whole systems may be, it is still necessary to reduce them to attributes if decision-makers are to identify and act upon the best practices that come together to make one system more effective than another. In other words, there is likely to be something absent in a Spearhead area where the health inequality gap has been widening compared to one where it has been narrowing. The holism of a local system can still be acknowledged by recognising that these attributes operate in combination and that these combinations occur in particular places. Unfortunately, much research on population health models the data as if in an abstract space, such as multivariate regression models using national survey data. The resulting ‘independent effects’ are averages across many different local contexts that isolate each single variable by keeping all other variables constant in the statistical model. Local decision-makers can rightly be wary about the results: their own context is unlikely to be ‘average’ and effects are unlikely to be independent. They will be outcomes of variables combining in each case.
Ragin (Reference Ragin2000) has developed a method called Qualitative Comparative Analysis (QCA) to handle data in a more ‘real’ way that enables logical statements to be made describing the combinations of attributes in a place that are sufficient for a given outcome. Software packages such as fsQCA and Tosmana are freely available on the worldwide web to analyse data using QCA (http://www.u.arizona.edu/~cragin/fsQCA/). The method involves constructing indicators for each case in the form of a series of attributes and the states of these attributes (equivalent to variables and their values, although normally dichotomised because QCA is based on the binary mathematics of Boolean algebra). Each series can then be compared with the value of the outcome for each case (equivalent to a dependent variable). Conventional multivariate analysis often uses a simple linear model that takes insufficient account of contextual and interactive effects or, if linear modelling is used to explore multivariable interactions, runs into problems with estimating and interpreting these effects because of multicolinearity (Drass and Miethe, Reference Drass, Miethe, Meier, Kennedy and Sacco2001). Above all, these models assume the effect of a variable on an outcome to be independent of all the other variables in the model, which is a simplifying assumption unlikely to reflect the reality of how outcomes from policy programmes are produced. QCA, on the other hand, assumes that outcomes are produced by variables acting together in combination, including the possibility of different combinations leading to the same outcome.
Using QCA to explore causal complexity
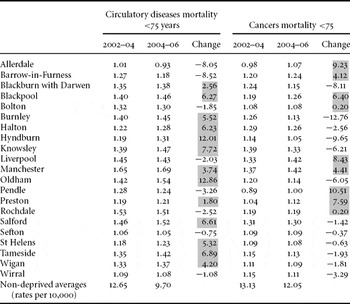
An opportunity to use QCA arose with one of the authors being commissioned by the Government Office for North West England to explore differences in health inequality outcomes across 21 LSP areas in the North West region that were among the most deprived 88 local authority areas in England (designated as Neighbourhood Renewal Areas; see Social Exclusion Unit, 2001). There were marked differences across these areas in the extent to which the gap with the average for ‘non-deprived’ local authority areas in the region was narrowing for premature mortality from circulatory diseases and cancers. Table 1 shows these differences in outcome for the period 1998/00 to 2002/04 (presented as relative differences using three-year rolling averages). In eight areas, there is a narrowing gap in circulatory diseases mortality and in 12 there is a narrowing gap in cancers mortality. There is no consistent pattern; a narrowing gap in circulatory mortality often co-exists with a widening gap in cancer mortality. In general, it is not possible to talk of well-performing or poorly performing areas since performance varies by type of health issue. If data can be gathered on attributes of these areas that show a systematic relationship with particular outcomes, it may be possible to identify why it is that one area is doing better than another for a given outcome.
Change in relative gaps in premature mortality between ‘deprived areas’ and the average for ‘non-deprived areas’ in North West England

A value of ‘1’ in the columns for 1998–00 and 2002–04 would indicate no difference compared to the non-NRF average. The higher the number, the greater the gap. The shaded cells identify a widening relative gap.
With the aim of exploring reasons for these differences, an exercise was planned in three stages: establishing the attributes of these areas that could be associated with their outcomes; undertaking a survey asking key informants to assess the extent to which these attributes were present in their areas; and analysing the responses using fsQCA to explore how the attributes configured against each outcome.
The first stage involved deciding what should be included in two questionnaires, one for each of the outcomes of circulatory diseases and cancers. QCA requires a model to be specified, with the independent variables assumed to be important conditions that configure to cause the outcomes (Drass and Miethe, Reference Drass, Miethe, Meier, Kennedy and Sacco2001). As with specifying any statistical model, judgement is involved in selecting the variables. Prior qualitative research can be useful if the issue is little understood, following a grounded theory approach (Byrne, Reference Byrne, Byrne and Ragin2009). In the present study we reviewed existing evidence on ways of working and context that might affect these outcomes at local area level, drawing particularly on evaluations of Health Action Zones (Barnes et al., Reference Barnes, Bauld, Benzeval, Judge, Mackenzie and Sullivan2005) and the Neighbourhood Renewal Strategy (GFA Consulting, 2005). A provisional list of possible attributes was drawn up and discussed at a workshop of practitioner stakeholders attended by LSP, PCT and local authority staff from most of the 21 areas. This led to some additions, notably the inclusion of ‘individual championing’ as a potentially important attribute of the local working culture.
The questionnaires were designed to include those attributes that evidence pointed to as likely to be relevant to outcomes or that participants in the workshop considered important. They were based on self-assessment using structured questions, with a request for responses to be evidenced by examples and case studies. The survey was administered by university researchers, and respondents were guaranteed confidentiality, with no area being individually identified in the analysis. The Government Office provided the names and addresses of key local contacts, and small teams were organised by the researchers to answer the questionnaires, including the director of public health in each area, relevant clinical leads and generally an officer from the local authority with a health improvement role.
Respondents were asked to report on ways of working and contextual conditions prevailing three years ago as well as at the time of completion. Comparisons with outcomes used the responses for three years ago in an attempt to align assessments of the attributes with the recent trend in the data. Health trend data for these outcomes are not up-to-date, usually lagging by one to two years, and it takes time for interventions to have an impact. This is not as long as sometimes suggested in discussions about tackling health inequalities; interventions that have even a small effect on average cholesterol levels, blood pressure and smoking may impact on premature mortality rates within 12–24 months, although the impact becomes more noticeable after five to ten years (Unal et al., Reference Unal, Critchley and Capewell2005; Wilcox and de Gruchy, Reference Wilcox and de Gruchy2006). An attempt was made to take these lags in both data and effects into account by looking back a few years, so the assessments were made for 2003 and the trend was measured for 2002–04 to 2004–06. This meant that some areas could not be included in the analysis because informants were not in a position to assess what was happening three years ago and so made a partially complete return. Out of 21 areas, for circulatory diseases there was a complete return for 14, a partially complete return for six and no return for one; for cancers there was a complete return for 15, a partially complete return for five and no return for one.
The data were coded for analysis using SPSS and fsQCA. The latter works out combinations associated with given outcomes: in this case, whether or not relative gaps in premature mortality rates had been narrowing. What attributes are included in the model is a matter of judgement based on the wider evidence base, theory and empirical analysis. In this exercise, all the attributes included in the questionnaire and from the secondary data sources had some justification for being regarded as possible causal factors from either the published evidence or from practitioners’ theories about what was important.
All attributes were dichotomised to aid analysis and interpretation. Dichotomisation reflects the ‘qualitative’ in QCA; a decision is made as to whether the case has the quality or not. This is known as ‘crisp’ QCA and contrasts with ‘fuzzy’ QCA when attributes are measured in degrees, making analysis and interpretation more complicated (Ragin, Reference Ragin2000). Some questions in the questionnaire had only yes/no answers while others used scales, with both explored using crosstabulation. Four secondary variables used in the analysis were continuous and were the average score for each local authority area on the 2004 Index of Multiple Deprivation (IMD) and three variables from the 2001 population census: percentage of the population aged 65 plus, that had moved address in the past year and that were in black and minority ethnic (BME) groups.
When crosstabulated against whether the mortality gap had been narrowing, there was a point in the distribution of each of these variables where it was possible to identify a marked fall in the prevalence of areas with a narrowing gap. With the IMD, this was identified at a score of 32 or more, with aged 65 plus at 15 per cent or less, with moving address at 16 per cent or more, and with BME at 15 per cent or more. Variables were selected for inclusion in the QCA model initially on the basis of bivariate associations and then by exploring other possible combinations based on evidence from the literature.
Results from the QCA
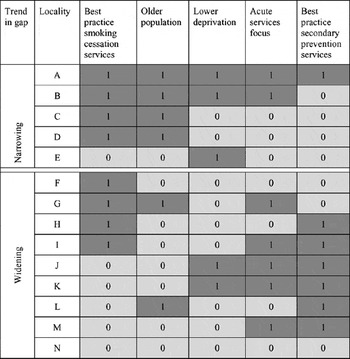
A relatively small group of attributes emerged as showing a plausible pattern with whether or not the mortality gaps were narrowing. Table 2 shows the results of the analysis for circulatory diseases. The first five rows are the areas with a narrowing gap and the next nine rows are the areas where the gap has not been narrowing. Five attributes were included in the QCA model. The presence of any one of these attributes in an area is indicated by a ‘1’ in the appropriate cell in the table.
Attributes associated with a narrowing gap in premature mortality from circulatory diseases (1 = present; 0 = absent)

Four of the five areas with a narrowing gap assessed their smoking cessation services as conforming with best practice, compared to less than half of the areas with a widening gap. The description of best practice was:
The cessation support needs of smokers in high prevalence groups and areas are well-understood and smoking interventions work to overcome cultural and environmental barriers to quitting as well as providing NRT and Zyban largely reactively to people who want to quit (in other words, you are confident that a substantial number of smokers are quitting who would have been unlikely to have quitted without the work going on in your area).
This clearly emerges as an important attribute but, assuming here that association can be taken as evidence of causation, is neither necessary (given case ‘E’) nor sufficient (given cases ‘F’ to ‘I’) within this sample of cases to be narrowing the circulatory diseases gap.
The one area with a narrowing gap but no best practice smoking cessation services, area ‘E’, has only one relevant attribute, which is lower deprivation. Two areas with a widening gap, areas ‘J’ and ‘K’, also have lower deprivation but in a different type of combination. These two areas have a focus on acute services and secondary prevention (principally the targeted prescribing of statins to those most at risk). Care needs to be exercised in inferring too much from this, but it suggests that areas with a focus on a ‘medical model’ for tackling inequalities in circulatory mortality are being less successful than those areas where there is no such focus reported. It is apparent from Table 2 that very few areas where the gap has been narrowing report a focus on either acute services or secondary prevention. Those areas that do have such a focus, areas ‘A’ and ‘B’, have other attributes that appear to be associated with their success.
Best practice smoking cessation services is one of these attributes, but there is no case where this is associated with narrowing the circulatory mortality gap without being combined with a relatively older population. This is an interesting contextual attribute, present in only two of the areas with a widening gap, and pointing to the possibility that an older population presents a more receptive context for smoking cessation services. There is one case where this combination exists but with a widening gap, area ‘G’. There is an acute services focus reported for this area as well, but with two areas where the gap is narrowing also having this focus it seems unlikely to be a reason why the combination of best practice smoking cessation services and an older population is not associated with a narrowing gap. Area ‘G’ has higher deprivation, and it might be this attribute that explains the greater difficulty with closing its gap.
Overall, Table 2 suggests that there are two combinations of attributes that are sufficient to be narrowing the circulatory diseases gap among these cases. The first of these is best practice smoking cessation services, an older population and the absence of a focus on acute services (areas ‘C’ and ‘D’). The second is best practice smoking cessation services, an older population and lower deprivation (areas ‘A’ and ‘B’). Case ‘E’ is difficult to explain as its lower deprivation appears to be the sole attribute associated with its narrowing gap. There are two areas with a widening gap that also have lower deprivation, but these areas have a focus on acute services and secondary prevention. These ‘medical model’ attributes appear to be obstacles to making progress with narrowing the circulatory diseases gap.
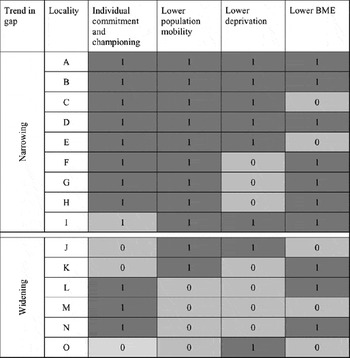
Table 3 shows results for cancers. Four attributes showed associations with the outcome sufficient to be considered in the QCA. Every one of the nine areas with a narrowing gap in cancer mortality had lower population mobility, compared to only two of the six areas with a widening gap. While neither sufficient nor necessary on its own for the gap to be narrowing, when lower population mobility combines with respondents choosing ‘individual commitment and championing’ as the best description of the local professional working culture, this combination appears to be sufficient for the gap to be narrowing. Case ‘I’ is the only area with a narrowing gap without this combination. In this case, there is a sufficient combination of lower population mobility, lower deprivation and a lower BME population. The association with ethnicity is potentially important, most likely in terms of screening uptake and access to early treatment (Lodge, Reference Lodge2001).
Attributes associated with a narrowing gap in premature mortality from cancers (1 = present; 0 = absent)

Making sense of QCA configurations
The analysis presented above is based on cross-sectional data and a relatively small number of areas (although these areas include 15 of the 21 LSP areas in this particular Government Office region, which might be regarded as a single health governance space). It would be very interesting to repeat the survey in future years so that the relationships between the configurations of attributes and outcomes can be studied longitudinally, giving more confidence in regarding associations as causal. It will also be important to explore whether the relationships found hold in other English regions. For now, the results need to be considered in terms of their plausibility, based on what is already known.
Bauld et al. (Reference Bauld, Judge, Barnes, Benzeval, MacKenzie and Sullivan2005) describe the difficulty of evaluating multifaceted area-based health improvement programmes, calling for the better design of interventions to enable robust evaluations to be planned. There is little doubt that this would be valuable, but it is likely to be the exception rather than the rule in the ‘messy’ world of policy-making. This article has suggested an alternative approach based on QCA, seeking to capture relevant attributes of the whole local system, and then exploring possible causal combinations using structured questionnaires and secondary data to make systematic comparisons with population-level outcomes.
An interesting finding from this approach is the interaction between contextual attributes and ways of working. For circulatory diseases, the two attributes of most importance to the mortality gap narrowing are related to smoking: smoking cessation services delivered in accordance with best practice and an older population. Given that reductions in smoking can feed through to reductions in mortality from heart attacks and strokes over quite a short period, and that this analysis was comparing attributes assessed for 2003 with trends in inequality over the years 2002–04 to 2004–6, it is plausible that that these smoking-related attributes were having an effect on the measured trends. The two attributes needed to be in combination to be sufficient for the gap to be narrowing in all but one case. It is possible that smoking cessation services are more likely to be effective in reducing smoking prevalence with an older local population since prevalence declines sharply as people enter their 60s, probably because it aggravates age-related conditions and there is more likelihood of encountering advice and support about quitting (Office for National Statistics, 2008). The well-established effect of deprivation on smoking and on the likely effectiveness of smoking cessation services is a similar example of a receptive context, given that three of the five areas with a narrowing circulatory mortality gap were lower deprivation areas, compared to only two of the nine areas with a widening gap (Blackman, Reference Blackman2008).
Smoking cessation services were not a relevant attribute in the case of cancer mortality, possibly because the effect of lowering smoking prevalence in a population takes longer to impact on cancer mortality than is the case with circulatory diseases, where, as already noted, the effect can be quite rapid. The apparently striking effect of lower population mobility on a narrowing cancer mortality gap is interesting and may reflect a better likelihood of accessing services, early diagnosis and treatment when households are moving address less often. With the exception of two cases, lower population mobility appeared to be sufficient for the gap to be narrowing. These two exceptions lacked one attribute that combined with lower population mobility in all but one of the areas with a narrowing gap: individual commitment and championing. This suggests that for the gap to narrow, a certain level of commitment from services is needed. (For example, given the importance of early diagnosis in preventing cancer mortality, it is possible to envisage one area having a proactive stance towards screening and raising awareness of symptoms, while another area may not have such active approaches. Interestingly, individual commitment and championing was identified as a potentially important attribute by practitioners in our workshops and is not so evident in the research literature.) In the one area with a narrowing gap where individual commitment and championing were not reported, three apparently important contextual attributes were all present: lower population mobility, lower deprivation and a lower proportion of the population in BME groups. However, three of the six areas with a widening gap reported the local working culture as one of individual commitment and championing, but with relatively higher population mobility and deprivation this appears not to have been enough for their gap to be narrowing.
Ragin (Reference Ragin2000) describes QCA as being theory and knowledge dependent, meaning that the researcher needs to be informed about the subject matter and in a position to ‘make sense’ of the causal conditions that the attributes are claimed to represent. The selection of attributes requires judgement, although we found that from the large number of attributes that could be derived from the questionnaire assessments, only a small number were clearly associated with the outcomes. A similar point can be made about the respondents in our study who completed the questionnaires. We required the questionnaires to be completed and agreed by teams reflecting at least three different perspectives (public health, clinical and local authority) and designed the questionnaires as pre-coded structured forms, with a request to write a short evidence narrative to support each self-assessment. Respondents were unaware of whether we had classified their area as closing the mortality gap or not (although they would have no doubt been familiar with their own data on this) and were urged to be candid under conditions of confidentiality and anonymity. The particular standpoint of a respondent, though, cannot be ruled out as a possible source of bias. Indeed, some of the attributes may genuinely be assessed differently for a locality depending on standpoint, such as whether that of the local authority or PCT. Similarly, the discussion above about the likely causal implications of our findings is open to alternative explanations (if evidence can be cited in support) and provisional until confirmed or contradicted by further investigation. This includes the possibility that important conditions have been missed that might alter our configurations.
The analysis of necessary and sufficient conditions is strengthened in this study by considering both positive (gap narrowing) and negative (gap widening) cases. The process that Ragin suggests should be followed is to identify all positive and negative cases, and then study them using the causal commonalities shared by positive cases as guides. The causal conditions identified by the researcher after comparing positive and negative cases then need to be presented as making sense, theoretically and substantively.
Conclusion
QCA is an attractive type of analysis for people who develop policy and strategy because it points to attributes and important combinations in ways that can be acted upon. This contrasts with both qualitative narrative and statistical measures such as odds ratios, which can leave a great amount of ambiguity about the actions that should follow. A theme in a qualitative narrative or an odds ratio of a certain value may give little insight into what actually needs to be done in a particular place or organisation because these approaches rarely point to how conditions combine to form the context for different types of outcome. QCA offers a possible strategy for isolating the key drivers of change in their combinations, capturing the importance of both interventions and context case by case, rather than estimating the effects of individual variables averaged across all cases.
The results from the present study can be regarded as either a basis for further investigation or for action. For example, best practice smoking cessation services were identified as associated with the circulatory mortality gap narrowing over a time horizon of a few years. This can either be used by areas whose smoking cessation services do not reach this benchmark as justification for prioritising improvement and investment in these services, or as a basis for visiting areas that have assessed their services as best practice to learn from them. Of course, these are associations (albeit based on substantive and theoretical reasoning) rather than clear demonstrations of causation, so follow-up evaluation needs to be part of the learning process.
An issue for areas with a widening gap is the contextual attributes that appeared to inhibit progress with narrowing the mortality gaps. Best practice smoking cessation services appeared to need a combination with an older population to be narrowing the circulatory diseases mortality gap, and local demography is not as easy to change as smoking cessation services. Such a finding means that there needs to be recognition of the extra resources likely to be needed in areas where certain key contextual factors are present. These factors, however, may themselves be amenable to intervention. For instance, the apparent effect of population mobility on the cancer mortality gap points to a need to make a special effort either to stabilise local populations or to tailor services such as screening to these conditions by deploying well-advertised mobile facilities.
Two important features of public policy in the UK in recent years have been the notion of evidence-based practice and the use of targets. Targets are what programmes are aiming to achieve, while evidence is the knowledge to get there. Both approaches have been widely scrutinised and critiqued in the academic literature (Bevan and Hood, Reference Bevan and Hood2006; Klein, Reference Klein, Powell, Bauld and Clarke2005; Marinker, Reference Marinker2002; McCormick and Fulop, Reference McCormick, Fulop and Marinker2002; Nutley et al., Reference Nutley, Walter and Davies2007). There have been criticisms of evidence presented as if such knowledge can be independent of the context in which it is produced or applied, and criticisms of targets as either too general or too prescriptive.
Some criticisms are fundamental as they relate to the theory behind both evidence and targets. Theory is a question of epistemology or what can be claimed to exist, and one of the key issues is generalising from statistical relationships. This can be exemplified by considering a significant linear statistical relationship between two variables, say a correlation of 0.7 between an index of deprivation and the cancer mortality rate. It might be claimed that an important relationship ‘exists’. However, the extent to which this relationship exists for any individual, in any single neighbourhood, or even any particular local authority area, could vary substantially (a correlation of 0.7 still means that over half of the variation is ‘unexplained’). Regression lines are ‘tentative bridges between local knowledges’ (Abbott, Reference Abbott2001: 5). It is, of course, true that more than a correlation coefficient would be needed for even a tentative claim, in that there needs to be a plausible theory for the relationship. Equally, such bridges can be built by qualitative studies. But the general point is that what exists is neither all universal nor all specific; any particular instance of a relationship such as that between deprivation and mortality is a combination of processes that operate on a wide scale and processes that are particular to a place or time. This is now, thanks to the work particularly of Pawson and Tilley (Reference Pawson and Tilley1997), a convention of evaluation research and is summed up in their model of how an intervention programme interacts with local contexts to produce a patterning of outcomes.
This article has sought to demonstrate how this complex causation can be investigated systematically, recognising both the whole system nature of a local area and the combinations of attributes that define that system, and from which outcomes emerge in patterned ways. The analysis has identified attributes associated with narrowing health inequalities. These are the attributes of local authority areas where the gap has been closing, and these areas are likely to have positive lessons to share with areas where the gap has not been closing. Importantly, in an era when inspection regimes for public services in England tend to classify organisations as succeeding or failing, most areas had something to offer in this respect. The inclusion of contextual attributes helps PCTs and local authorities to identify others that are like them, but also reveals the particular challenges that some areas are facing.