


Introduction
Montmorillonite (Mnt) is a natural 2:1 lamellar aluminosilicate featuring an octahedral sheet sandwiched between two tetrahedral sheets, wherein the replacement of trivalent Al ions by divalent Mg and/or Fe creates a permanent negative charge on the layers (Chen et al., Reference Chen, Sun, Zhang, Zhou, Liu, Zeng, Ren, Feng, Yang, Zhang, Wang and Cao2023; Tong et al., Reference Tong, Wu, Adebajo, Jin, Yu, Ji and Zhou2018). This unique structure imparts a large specific surface area, a large cation exchange capacity and versatile adsorption/desorption capabilities on Mnt (Al Kausor et al., Reference Al Kausor, Sen Gupta, Bhattacharyya and Chakrabortty2022; Chen et al., Reference Chen, Yuan, Zhao, Rao and Song2019; Liu et al., Reference Liu, Li, Otitoju, Wang, Zhang and Zhang2021), as well as excellent stability, swelling properties, and non-toxicity (Jayrajsinh et al., Reference Jayrajsinh, Shankar, Agrawal and Bakre2017; Liu et al., Reference Liu, Shen, Wu, Chen, Gao, Hu and Li2022). Mnt can be used as a biomaterial in the chemical industry, in environmental protection, and in medicine, etc. In recent years, because of the unique structure and properties mentioned above, Mnt has shown great potential in the field of delayed-release functional modification and, as a delayed-release carrier, its applications include fields such as drug delivery (Saadh et al., Reference Saadh, Abdulsahib, Mustafa, Zabibah, Adhab, Rakhimov and Alsaikhan2024; Wang et al., Reference Wang, Wu, Chang, Yang, Si, Nan, Peng and Cao2024) and slow-release fertilizer (Cyriac et al., Reference Cyriac, Sreejit, Yuvaraj, Joseph, Priya, Saju and Thomas2024).
The properties of inorganic materials are known to be related to their morphologies, e.g. sphere-like particles, rods, fibers, sheets, and microspheres, all exhibiting different properties to some extent. Among them, sphere-like particles have the advantage of controllable particle size, good dispersity and fluidity, and high packing density (Zhang et al., Reference Zhang, Li, Chen, Zhang, Fan and Bei2024). Furthermore, microspheres with a hollow mesoporous structure offer more advantages than sphere-like particles, which are not hollow. The key parameters controlling the formation of spherical particles in spray drying include the pumping flow rate, inlet temperature, and the solid content in its precursor solution. The flow rate affects the initial size of the atomized droplets directly: high flow rates lead to smaller droplets, which are prone to forming surface depressions or collapses during their drying process; low flow rates are more likely to form uniform spheres (Xiao et al., Reference Xiao, Ren, Zhou, Wang, Wang and Pan2019). High temperatures can promote rapid evaporation from the surfaces of droplets to form a dense shell, which inhibits the migration of interior solutes and helps to maintain a spherical shape. However, excessive temperatures can lead to premature hardening of the outer shell and the internal vapor pressure breaking through the shell to form hollow or ruptured particles (Messa et al., Reference Messa, Souza and Faez2020; Qadri et al., Reference Qadri, Naik, Hussain, Bhat, Naseer, Zargar and Beigh2023). Large solids contents increase solution viscosity and inhibit solute migration to the surfaces of droplets, resulting in solute located within the droplet and the formation of irregular particles. Small solids contents are insufficient for the formation of a continuous shell layer, and particles are prone to collapse (Deshmukh and Naik, Reference Deshmukh and Naik2016).
Chlorine dioxide (ClO2) is a very efficient and safe sanitizer. It has significant antimicrobial and oxidative activity even at a low concentrations (Singh et al., Reference Singh, Maji, Lee and Gaikwad2021). Compared with its aqueous solution, gaseous ClO2, a yellow-green dry sterilization medium, has better infusibility and can penetrate deeply into the rugged surfaces of food and kill bacteria, viruses, and other pathogens (Su et al., Reference Su, Chen, Zhao, An, Huang, Liu and Huang2023; Zhang et al., Reference Zhang, Qiu, Yang, Lu, Xu, Yang, Xu, Wang, Lin, Tong, He, Xiao, Sun, Huang, Yu and Zhong2023). Therefore, ClO2 can be used effectively as a food-preserving agent to prevent microbial contamination and post-harvest decay of fruit. This study aimed to prepare hollow Mnt microspheres using spray drying. These microspheres feature a mesoporous-to-macroporous structure with pore sizes ranging from 5 to 150 nm, and their average diameter (D 50) was ~6 μm. This sets a firm foundation for Mnt to be used in slow release and freshness-retention.
Materials and methods
Reactants and fruit
Sodium-based montmorillonite (Na-Mnt) with a cation exchange capacity of 126.48 mmol 100 g–1 was obtained from Xincheng Mineral Products Co., Ltd (Hebei, China) and used as raw material. Sodium metasilicate (Na2SiO3, 98 wt.%) was purchased from Shanghai Lingfeng Chemical Reagent Co., Ltd (Shanghai, China). Sodium chlorite (NaClO2, 80 wt.%, solid) and sodium bisulfate (NaHSO4, 98.5 wt.%, solid) were purchased from Chengdu Six Biological Technology Co., Ltd (Sichuan, China). Waxberries and grapes were purchased from a local supermarket on the day of the experiments.
Preparation of Mnt microspheres
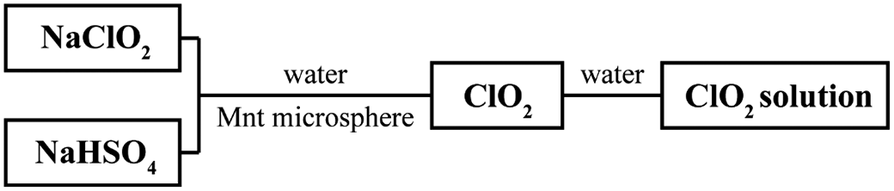
Na-Mnt and deionized water were mixed at a mass ratio of 1:200, stirred, and sonicated at room temperature for 30 min to obtain a Na-Mnt suspension in a beaker. The suspension was set aside over 1 week for water expansion until three layers [upper (colloidal layer), middle (mixed-suspension layer), and lower (particle layer)] could be seen clearly in the beaker; then a laser beam with a wavelength of 650 nm was used to pass through the upper layer of the static liquid, and after a clear light scattering path was observed, the upper colloidal layer was slowly sucked up along the wall of the beaker using a sterile pipette (to avoid disturbing the bottom precipitate), and then centrifuged and freeze-dried to obtain the Mnt. Ten grams of the Mnt was weighed and dispersed in 2000.0 mL of sodium metasilicate solution (0.4 mmol L–1) to prepare a homogeneous suspension. The suspension was stirred for 4 h at 50°C under a water bath, then it was pumped into a spray drier to prepare Mnt microspheres in accordance with Xiao et al. (Reference Xiao, Ren, Zhou, Wang, Wang and Pan2019) but with minor modifications – the pump-in flow rate was set to 4000.0 mL h–1 and the inlet temperature was set to 180°C. The flow diagram for preparing Mnt microspheres is shown in Fig. 1.
Flow diagram for preparation of a Mnt microsphere.

Characterization
The chemical compositions of Mnt and Mnt-based microspheres was analyzed by wavelength-dispersive X-ray fluorescence (WD-XRF) spectroscopy (Advant’X 4200, ThermoFisher Scientific). Prior to analysis, the powdered samples were dried at 105°C for 3 h to remove moisture and pressed into homogeneous discs under a vacuum of 1.60 Pa. The X-rays were generated with the Rh anode. For quantitative analysis, calibration with a series of metallic standards and UniQuant software were used.
X-ray diffraction (XRD) patterns were recorded with a PANalytical X’Pert PRO powder diffractometer using CuKα radiation (λ=0.1541 nm) at a voltage of 40 kV and a current of 40 mA. The patterns were collected between 10 and 80°2θ at a step size of 0.026°2θ and 1 s count time per step.
A Zeiss Gemini 500 field emission scanning electron microscope (SEM) with a working voltage of 15 kV was used to observe the morphology of the microspheres.
Nitrogen (N2) adsorption/desorption characterization [Brunauer-Emmett-Teller (BET)] was used to measure the specific surface area, and aperture distribution of Mnt and Mnt microspheres via an automatic physical chemical desorption instrument (ASAP2020, American Micromeritics Company). The samples were degassed under vacuum of 1.60 Pa at 300°C for 6 h prior to measurement.
The Fourier transform infrared (FTIR)-tested samples of Mnt and Mnt microspheres were prepared by the potassium bromide (KBr) pressing method. Before testing, pure KBr pressings were used for background scanning to eliminate environmental interference, and then the samples were placed in the sample compartment of the Nicolet 6700 FTIR spectrometer (Thermo Nicolet, USA). The scanning wavelength of the instrument was set at the range of 4000 to 400 cm–1, with a resolution of 4.0 cm–1; each sample was measured three times at three different locations to ensure consistency, and the results were analyzed using OMNIC software.
Preparation and quantification of ClO2 and retention of the freshness of fruit
The reaction of sodium chlorite with solid acid was activated in the presence of moisture, as shown in the following equation:

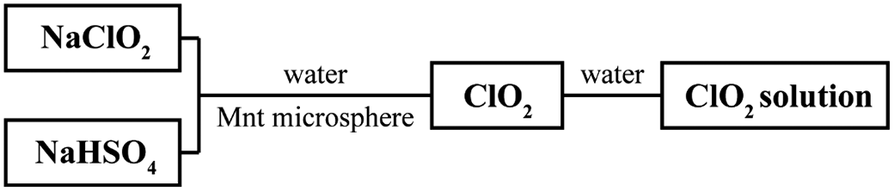
This is the most common approach for producing gaseous ClO2. In the present experiments, solid sodium chlorite (NaClO2) and sodium bisulfate (NaHSO4) were mixed to produce gaseous ClO2, and NaClO2 and NaHSO4 were mixed at a mass ratio of 3:2 (NaClO2 to NaHSO4, the ratio was set in subsequent experiments) to ensure that gaseous ClO2 was produced sufficiently and stably. Mnt microspheres were used to adsorb the ClO2 (Fig. 2).
Flow diagram for production and measurement of the concentration of ClO2.
To measure the long-term releasing property of Mnt microspheres for gaseous ClO2, an experiment was designed and carried out in a closed, dark environment at room temperature, as shown in Fig. 3. Gaseous ClO2 was extracted from the sealed experimental device and dissolved in deionized water to obtain a ClO2 solution, then its absorbance value at 349 nm was measured via a UV–visible spectrophotometer (Shimadzu, UV-160, Japan) to calculate its concentration. To prevent experimental errors caused by the closed environment, nitrogen gas with moisture was passed through the closed environment to activate the reaction to produce ClO2. In this way, the concentration of ClO2 being released from the microspheres was monitored, and its freshness-retention potential for seasonal water fruits was assessed using the process shown in Fig. 3. The number of bacteria in the leaching liquid from rotted fruit was observed by an Olympus SZ61 optical microscope (Shanghai Puhe Optoelectronic Technology Co., Ltd, China).
Schematic diagram showing how the freshness of fruit can be retained through use of ClO2.
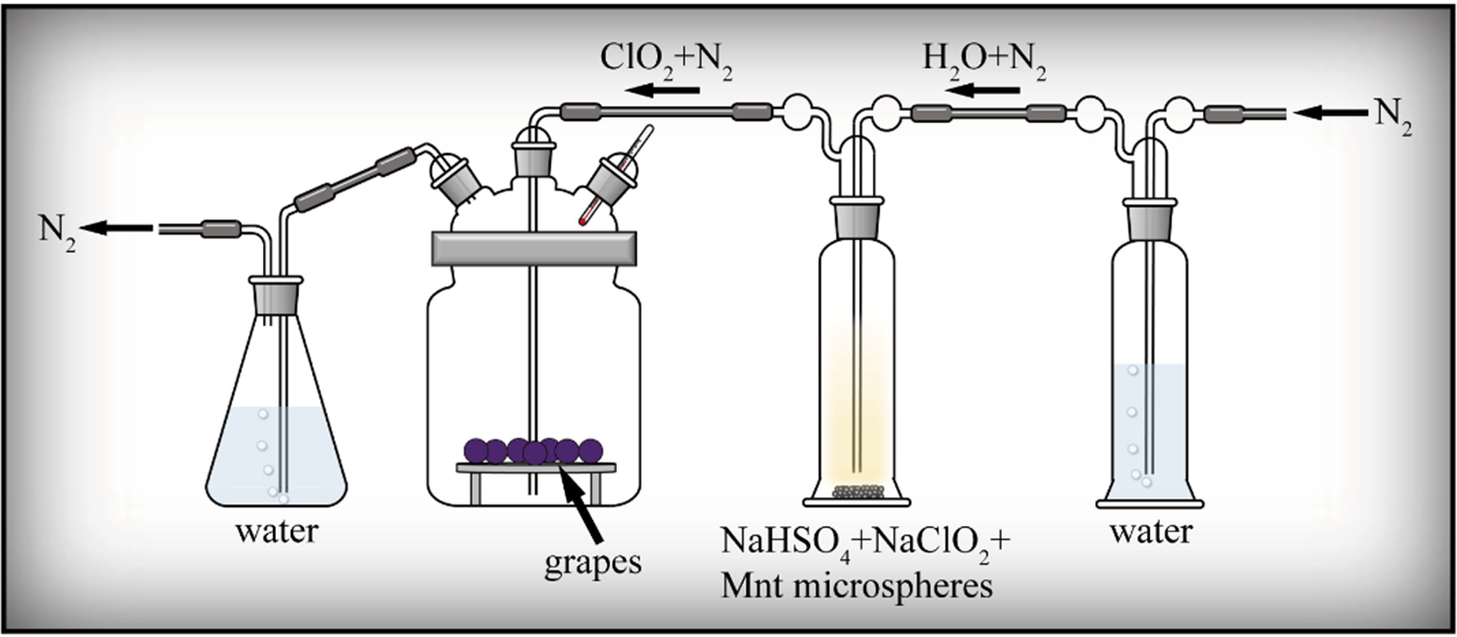
Figure 3. Long description
A series of four glass vessels connected by tubing. The flow begins at the far right with an inlet for N sub 2 gas.
* The first vessel on the right is a tall cylinder containing water. N sub 2 gas bubbles through the water and exits as H sub 2 O plus N sub 2.
* The second vessel is a tall cylinder containing a solid mixture of N a H S O sub 4 plus N a C l O sub 2 plus Mnt microspheres. The gas passes through this mixture and exits as C l O sub 2 plus N sub 2.
* The third vessel is a large wide-mouthed jar containing grapes resting on a raised platform. A thermometer is inserted into the jar to monitor the internal temperature. The C l O sub 2 plus N sub 2 gas mixture enters this jar to treat the fruit.
* The fourth vessel on the far left is an Erlenmeyer flask containing water. The gas from the grape jar bubbles through this water before the final N sub 2 gas is exhausted through an outlet on the left.
Sustainable release of ClO2 from Mnt microspheres
To validate the effect of Mnt microspheres on the sustained release of ClO2, three sets of experiments were set up as follows: (a) blank control group – waxberries only placed in the freshness-retention device with no added reagents; (b) reagent control group – in addition to waxberries, 20 g of solid NaClO2 and NaHSO4 (at a mass ratio of 3:2, NaClO2 to NaHSO4) were added to the freshness-retention device, in which ClO2 was released directly; and (c) Mnt microsphere group – in addition to waxberries, 20 g of Mnt microspheres was mixed with 20 g of solid NaClO2 and NaHSO4 (at a mass ratio of 3:2, NaClO2 to NaHSO4) and added into the freshness-retention device. The freshness-retention experiment was carried out, and ClO2 was sampled and quantified by the method described in the section ‘Preparation and quantification of ClO2 and terms of retention of freshness of fruit’; the status of waxberries was recorded.
ClO2 release
This part of the experiment was conducted to optimize the slow-release concentration of ClO2 by regulating the mass ratio of Mnt microspheres to ClO2 precursors (solid NaClO2 and NaHSO4). Three sets of experiments with different mass ratios were set up. The total amount of Mnt microspheres and the precursors of ClO2 was 20 g, in which the mass ratio of Mnt microspheres to the precursors of ClO2 were 1:2, 2:1, and 5:1, respectively. The experiment was carried out according to the process shown in Fig. 3; sampling and quantification of ClO2 was the same as in the section ‘Preparation and quantification of ClO2 and terms of retention of freshness of fruit’, and the status of the grapes was recorded.
Results
X-ray diffraction
The XRD patterns (Fig. 4) demonstrated that the crystal phases of Mnt and Mnt microspheres are almost identical: montmorillonite, quartz, and albite. These are consistent with a montmorillonite crystal phase (Wu et al., Reference Wu, Zhao, Zhou, Wang, Zuo and Cheng2022). In conclusion, spray drying does not change the crystal phase of Mnt, confirming that it is a convenient and efficient way to make Mnt microspheres.
XRD patterns of the (a) Mnt and (b) Mnt microspheres. M = montmorillonite, Q = quartz, A = albite.
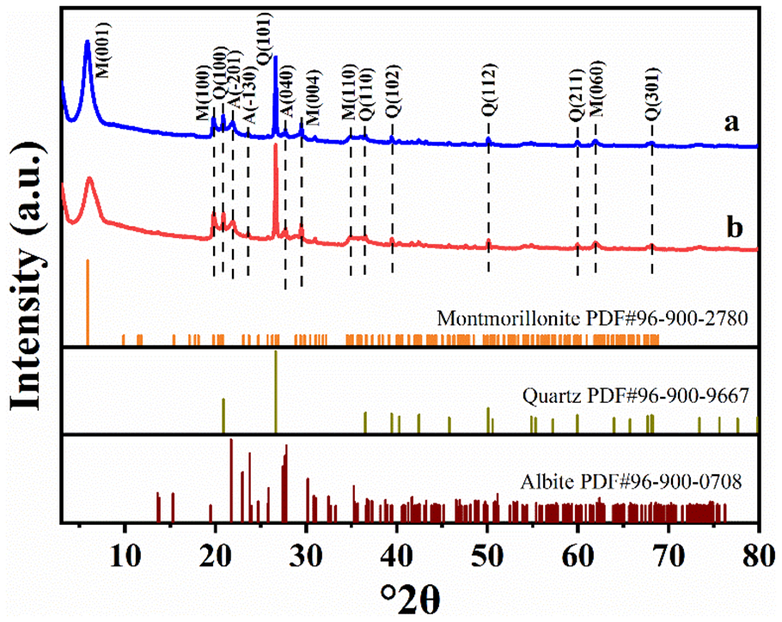
Figure 4. Long description
A stacked X R D plot with the Y-axis representing Intensity in arbitrary units and the X-axis representing degree 2 theta from 0 to 80.
* Top Panel (a): A blue line graph showing a high-intensity peak at approximately 6 degrees labeled M(001). Subsequent smaller peaks are labeled from left to right as M(100), Q(100), A(-201), A(-130), Q(101), A(040), M(004), M(110), Q(110), Q(102), Q(112), Q(211), M(060), and Q(301).
* Middle Panel (b): A red line graph following a nearly identical pattern to panel (a), with vertical dashed lines connecting the peaks of both samples to indicate consistency.
* Bottom Reference Panels: Three horizontal bar charts showing standard diffraction lines.
- Montmorillonite P D F number 96-900-2780 (orange lines).
- Quartz P D F number 96-900-9667 (olive green lines).
- Albite P D F number 96-900-0708 (dark red lines).
The experimental patterns in (a) and (b) show a primary concentration of peaks between 20 and 30 degrees 2 theta, corresponding to the high-density regions of the quartz and albite standards.
X-ray fluorescence
The standard chemical formula for Mnt is usually expressed as: (Na,Ca)0.3(Al,Mg)2Si4O10(OH)2‧nH2O with a molar ratio of the sum of aluminum and magnesium to silicon of 1:2. By calculating the molar ratios of the elements in Table 1, it can be concluded that the molar ratio of (Al+Mg) to Si is 1:3.18 in Mnt, whereas it changes to 1:2.98 in Mnt microspheres. Unexpectedly, the silicon content decreased despite the addition of sodium metasilicate. This is ascribed primarily to the removal of free silica impurities (e.g. quartz) during the preparation of the Mnt colloidal suspension, and the loss of silicon in this process far outweighs the amount supplemented by the sodium metasilicate. On the other hand, both the Mnt and Mnt microspheres exhibit (Na+Ca)/Si molar ratios that differ from the theoretical value (0.3:4). The ratio is 0.35:4 for the former and 0.43:4 for the latter.
Chemical compositions of Mnt and Mnt microspheres (wt.%±SE, determined by XRF)

Table 1. Long description
The table is divided into two vertical sections.
Section 1: Mnt.
- S i O sub 2: 74.48 plus or minus 0.22 wt.%, 1.24 mol; Si: 34.82 plus or minus 0.1 wt.%, 1.24 mol.
- A l sub 2 O sub 3: 14.29 plus or minus 0.17 wt.%, 0.13 mol; Al: 7.56 plus or minus 0.09 wt.%, 0.28 mol.
- M g O: 4.53 plus or minus 0.10 wt.%, 0.11 mol; Mg: 2.73 plus or minus 0.05 wt.%, 0.11 mol.
- N a sub 2 O: 1.79 plus or minus 0.07 wt.%, 0.05 mol; Na: 1.33 plus or minus 0.05 wt.%, 0.05 mol.
- C a O: 2.59 plus or minus 0.08 wt.%, 0.03 mol; Ca: 1.85 plus or minus 0.06 wt.%, 0.06 mol.
- F e sub 2 O sub 3: 1.11 plus or minus 0.05 wt.%, 6.94 times 10 super -3 mol; Fe: 0.78 plus or minus 0.04 wt.%, 0.01 mol.
- K sub 2 O: 0.94 plus or minus 0.05 wt.%, 9.98 times 10 super -3 mol; K: 0.78 plus or minus 0.04 wt.%, 0.02 mol.
- T i O sub 2: 0.13 plus or minus 0.01 wt.%, 1.59 times 10 super -3 mol; Ti: 0.08 plus or minus 0.01 wt.%, 1.58 times 10 super -3 mol.
Section 2: Mnt microspheres.
- S i O sub 2: 72.8 plus or minus 0.22 wt.%, 1.23 mol; Si: 34.03 plus or minus 0.1 wt.%, 1.22 mol.
- A l sub 2 O sub 3: 15 plus or minus 0.18 wt.%, 0.15 mol; Al: 7.94 plus or minus 0.09 wt.%, 0.29 mol.
- M g O: 4.83 plus or minus 0.11 wt.%, 0.12 mol; Mg: 2.91 plus or minus 0.06 wt.%, 0.12 mol.
- N a sub 2 O: 2.78 plus or minus 0.08 wt.%, 0.04 mol; Na: 2.06 plus or minus 0.06 wt.%, 0.09 mol.
- C a O: 2.23 plus or minus 0.07 wt.%, 0.04 mol; Ca: 1.6 plus or minus 0.05 wt.%, 0.04 mol.
- F e sub 2 O sub 3: 1.16 plus or minus 0.05 wt.%, 7.25 times 10 super -3 mol; Fe: 0.81 plus or minus 0.04 wt.%, 0.01 mol.
- K sub 2 O: 0.84 plus or minus 0.04 wt.%, 8.97 times 10 super -3 mol; K: 0.70 plus or minus 0.04 wt.%, 0.02 mol.
- T i O sub 2: 0.12 plus or minus 0.01 wt.%, 1.54 times 10 super -3 mol; Ti: 0.07 plus or minus 0.01 wt.%, 1.54 times 10 super -3 mol.
In summary, the differences in chemical compositions between Mnt and Mnt microspheres are not obvious; Mnt microspheres contain more sodium and less calcium, both are primarily chemical compositions of montmorillonite, and the amount of silica in Mnt and Mnt microspheres is almost the same.
The XRF results indicate that the contents of sodium and calcium in Mnt microspheres increase and decrease compared with that in Mnt, respectively (Table 1), and the d 001 peak of Mnt microspheres shifts slightly to higher angles compared with that of standard montmorillonite (Fig. 4). These can be attributed to:
-
1. The binder – sodium metasilicate released sodium cations into the aqueous liquid prior to the spray drying, hydrolyzed during the spray drying process and produced Si(OH)4 or SiO2.
-
2. The exchange of sodium cations occurred between Mnt and the aqueous liquid, resulting in the d 001 peak of Mnt microspheres shifting slightly, and the hydrolyzed product, Si(OH)4 or SiO2, being adsorbed onto the surface and edge of the Mnt layers during the construction of the Mnt microspheres; in this way, some new Si–O–Si bonds formed on the surface of the Mnt layers, and thus combined different Mnt particles. At the same time, a small number of Si–O–Al bonds formed at the edges of Mnt layers, and acted as connected structures between various Mnt particles also.
-
3. Because the spray drying temperature is only 180°C, insufficient to crystallize the hydrolyzed products, Si(OH)4 or SiO2, into crystal phases, they are amorphous Si(OH)4 or SiO2 only.
Scanning electron microscopy
Scanning electron microscopy images (Fig. 5a,b) show the morphologies of the Mnt obtained by freeze-drying the colloidal layers during water expansion. Mnt appears as micron-sized films composed of Mnt nanoparticles, featuring a loose structure and low packing density. Some of the films curled or folded due to freezing stresses and the thickness of individual Mnt films is 1–5 μm. Multiple millimeter- to nanometer-sized pores, and clear and sharp edges can be seen (Fig. 5c,d). The multiscale pores and lamellar structure of Mnt films may originate from exfoliated Mnt layers. Some smaller Mnt particles along with the hydrolyzed products, amorphous Si(OH)4 or SiO2, adsorbed on the outer surfaces of the Mnt layers under the force of new Si–O–Si and Si–O–Al bands formed during the spray drying, and the hydrogen band of water-ice crystals during freeze-drying. These may provide new forces to combine different Mnt layers to form lamellar structure, and a novel idea for designing a mesoporous lamellar structure.
SEM images of Mnt obtained by freeze-drying in the colloidal layer.
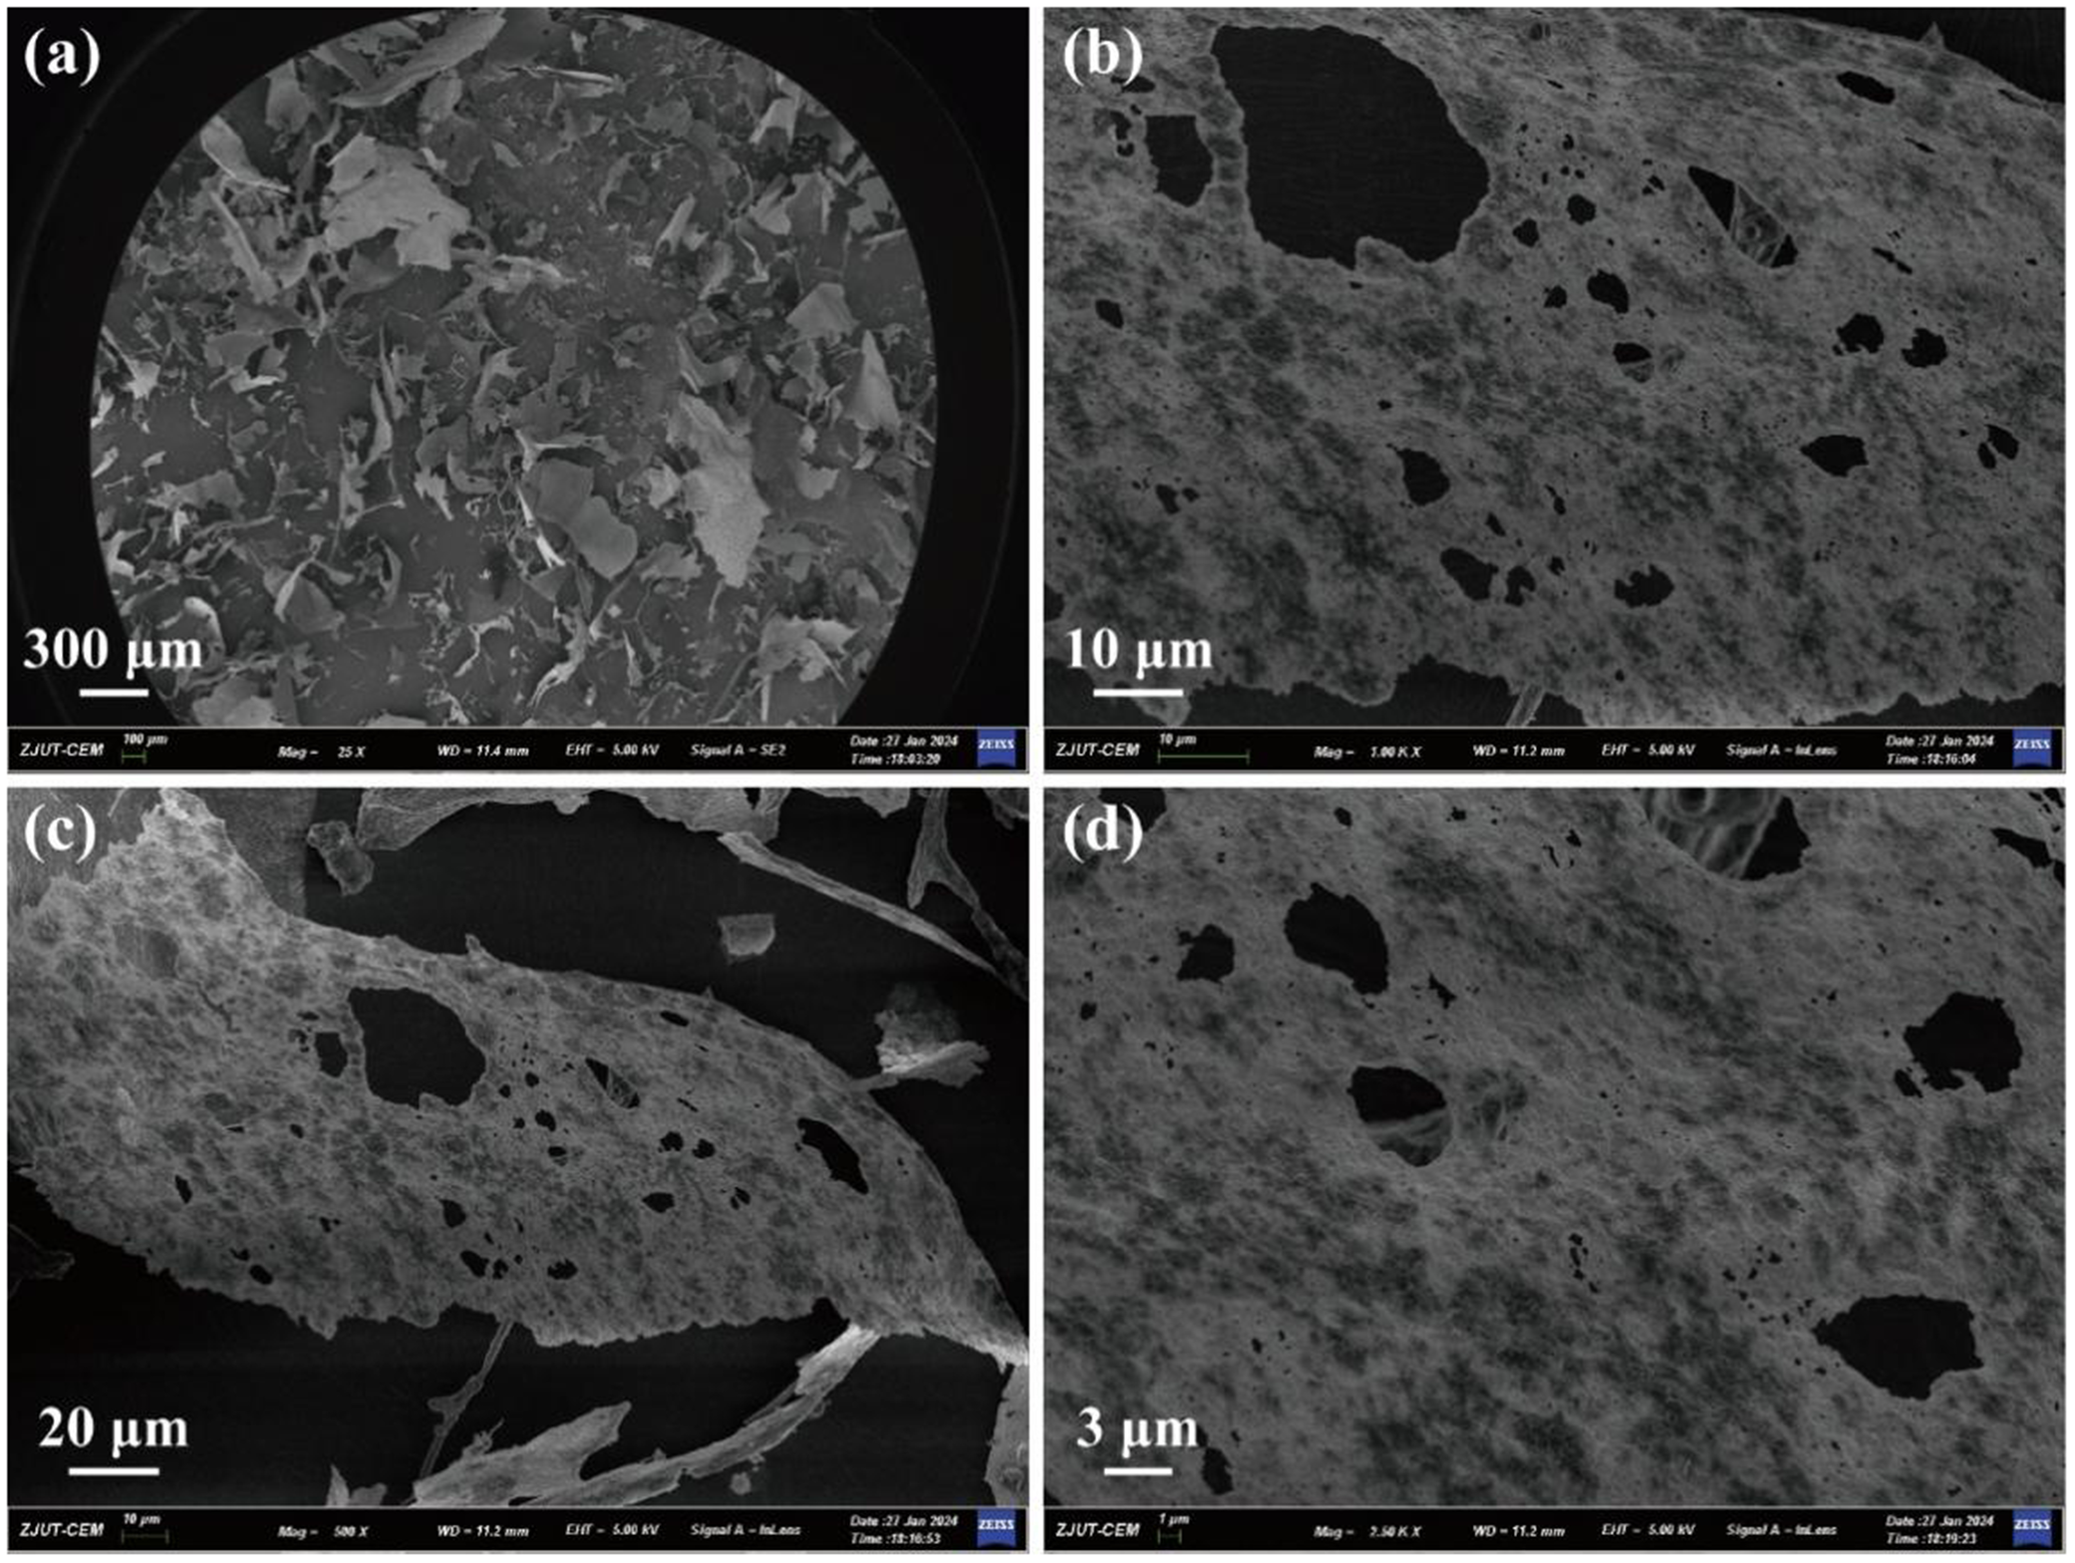
Figure 5. Long description
The figure consists of four panels labeled a through d.
Panel a: A wide-field S E M photo at a 300 micrometer scale showing a collection of irregular, flake-like particles scattered across a dark background. The particles appear as thin, translucent sheets with jagged edges.
Panel b: A higher magnification view at a 10 micrometer scale focusing on a single large sheet. The surface of the sheet is highly porous, featuring numerous dark, irregular holes and a granular, textured surface.
Panel c: A view at a 20 micrometer scale showing a curved, elongated section of the material. The porous structure is clearly visible, with larger voids concentrated toward the center of the flake and smaller pores distributed throughout the matrix.
Panel d: The highest magnification view at a 3 micrometer scale. This panel provides a close-up of the surface texture, revealing the fibrous and interconnected nature of the material surrounding the large, dark elliptical pores.
Each panel includes a technical data bar at the bottom with metadata including Z J U T dash C E M, magnification levels ranging from 25 times to 7.50 K X, and a working distance of 11.2 or 11.4 millimeters.
The SEM images of Mnt microspheres (Fig. 6a) demonstrate that the microspheres are well dispersed, the morphology is spherical or sphere-like (Fig. 6a,c), and have a diameter ranging from 3 to 12 μm (Fig. 6b) and an average diameter, D 50 (50% passing through a particle size), of ~6.0 μm. The wall thickness of the microsphere is ~400.0 nm and composed of nanoparticles with a diameter ranging from ~5 to 20 nm and mesopore to macropore with an aperture of ~5 to 150 nm (Fig. 6c). The mesopores connect the interior cavity with the exterior space of the hollow porous microsphere, and penetrate its wall thoroughly, as observed from a broken microsphere (Fig. 6d). These findings demonstrate that the structure of the microspheres is hollow porous.
SEM images and diameter distribution of Mnt microspheres.

Figure 6. Long description
Panel a is a wide-field S E M micrograph showing a large collection of irregularly shaped microspheres scattered across a surface. A scale bar indicates 20 micrometers. Panel b is a bar graph showing the diameter distribution. The x-axis is labeled Diameter in micrometers with a range from 2 to 13. The y-axis is labeled Percentage % with a range from 0 to 40. Blue hatched bars show a peak frequency between 5 and 7 micrometers, with a red normal distribution curve overlaid. Panel c is a high-magnification S E M micrograph of a single spherical particle with a rough, granular surface texture. A scale bar indicates 1 micrometer. Panel d is a high-magnification S E M micrograph of a broken microsphere, revealing a hollow interior and a thick, porous shell wall. A scale bar indicates 1 micrometer.
The hollow spherical morphology of Mnt microspheres is driven primarily by rapid evaporation dynamics during the spray-drying process of the Mnt colloidal suspension. The mechanism can be explained in three steps. Firstly, a Mnt colloidal suspension is atomized into small droplets. Secondly, upon contacting the hot air, rapid solvent evaporation occurs on the surface of the atomized droplets, causing the Mnt nanoparticles to concentrate outward. Meanwhile, sodium metasilicate acts as a binder, firmly connecting the nanoparticles to form a porous and rigid outer crust. Finally, as heating continues, the remaining water trapped inside the crust vaporizes into steam. The steam escapes through the porous shell, leaving behind a hollow void in the center of the sphere.
Brunauer-Emmett-Teller
The N2 adsorption/desorption isotherm linear plots (Fig. 7a) of the Mnt microspheres are consistent with type IV isotherms, which are typical isotherms of mesoporous materials. The hysteresis loop of the Mnt microsphere is of H2 type, its specific surface area, 41.1 m2 g–1, is less than that of Mnt, 56.6 m² g–1, dried from the Mnt colloidal layer. The reduction in specific surface area may be attributed to: sodium metasilicate hydrolyzed during the spray drying process and produced amorphous Si(OH)4 or SiO2, as mentioned above; these amorphous materials did not only adsorb on and smooth the outer surface of Mnt layer, but also entered the interior voids of Mnt, and thus blocked some voids of Mnt and resulted in the decrease of the specific surface area of Mnt microspheres. The distribution diagram of the aperture of the Mnt microspheres (Fig. 7b) indicated that its aperture distribution ranges from 2 to 20 nm. These findings demonstrate that its structure is hollow mesoporous, and its apertures are mesoporous, consistent with the SEM images.
N2 adsorption/desorption isotherm linear plot (a) and aperture distribution (b) of Mnt microspheres.
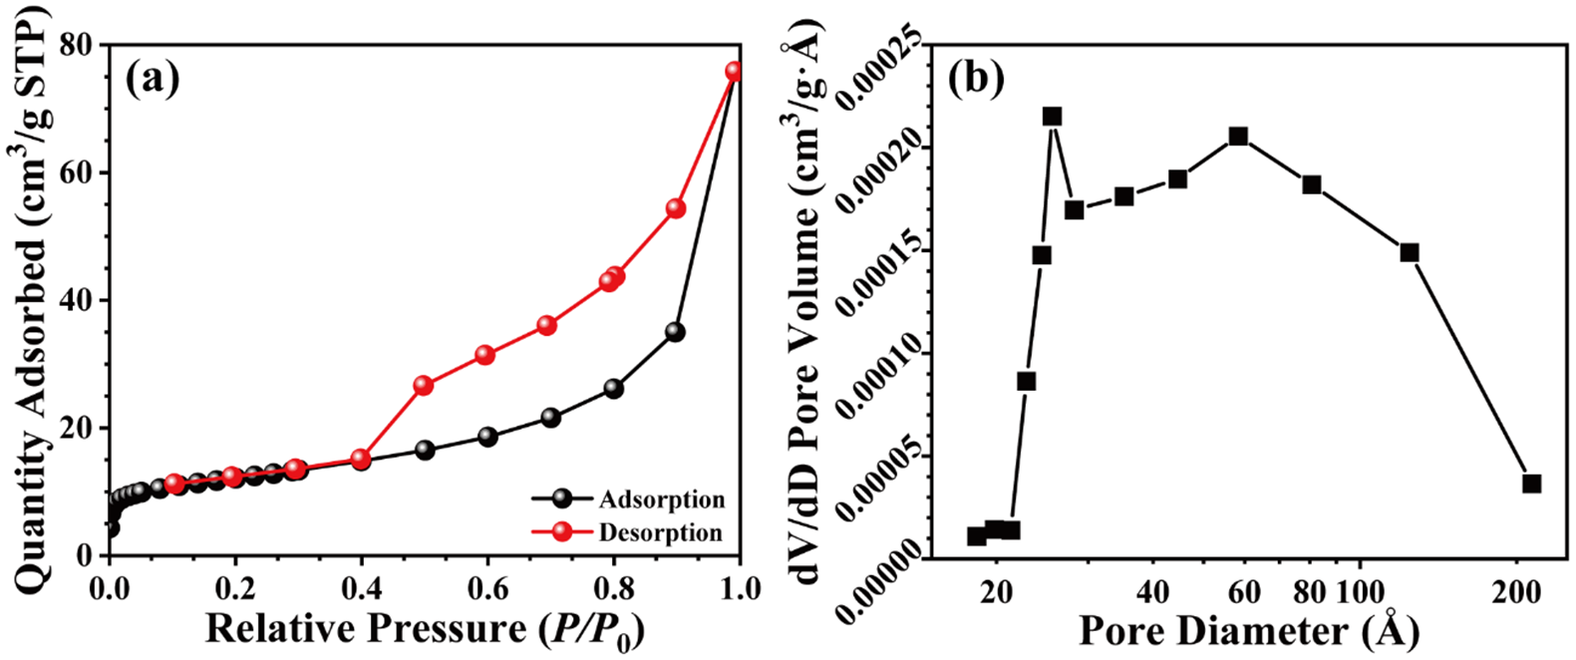
Figure 7. Long description
Panel a is a linear plot of N 2 adsorption and desorption. The x-axis is Relative Pressure P over P sub 0 ranging from 0.0 to 1.0. The y-axis is Quantity Adsorbed in cm super 3 per g S T P ranging from 0 to 80. The adsorption curve, marked with black circles, shows a slow linear increase until a relative pressure of 0.8, followed by a sharp exponential rise to 78. The desorption curve, marked with red circles, follows the adsorption path from 1.0 down to 0.45, where it forms a hysteresis loop, staying significantly higher than the adsorption curve before merging back with it at a relative pressure of 0.1.
Panel b is a line graph of aperture distribution. The x-axis is Pore Diameter in Angstroms on a logarithmic scale from 20 to 200. The y-axis is d V forward slash d D Pore Volume in cm super 3 per g Angstrom ranging from 0.00000 to 0.00025. The data, marked with black squares, shows a sharp peak at approximately 30 Angstroms reaching a volume of 0.00022, followed by a slight dip and a second broader peak centered around 60 Angstroms before declining steadily toward 200 Angstroms.
FTIR
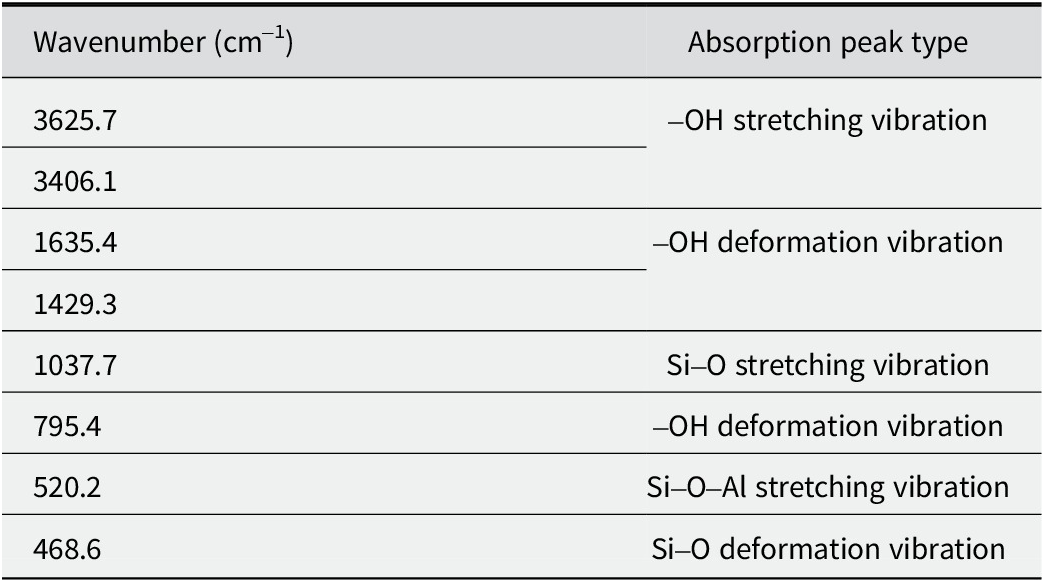
The FTIR spectra of Mnt microspheres (Fig. 8) revealed the characteristic peaks of multiple bonds, such as the stretching vibration of the Si–O bond at 1037.7 cm–1, that of the Si–O–Al bond at 520.2 cm–1, and the deformation vibration of Si–O bond at 468.6 cm–1, as shown in Table 2. Furthermore, the intensity of the –OH vibration of Mnt microsphere at 1429.3 cm–1 and 1635.4 cm–1 is greater than that of the Mnt particle, and the intensity of the Si–O vibration of the Mnt microspheres at 1037.7 cm–1 and 468.6 cm–1 is greater than that of the Mnt particle also. This may be due to the increase of Si–O–Si and Si–O–Al bonds in Mnt microspheres, implying the formation of new Si–O and Al–O bonds. These bonds combine the nanoparticles in the wall of the Mnt microspheres, and enhance the stability of the hollow mesoporous structure.
FTIR spectra of the Na-Mnt (a) and Mnt microspheres (b).

Figure 8. Long description
A line graph displaying two stacked F T I R spectra. The horizontal x-axis represents Wavenumber (centimeters minus 1), ranging from 4000 to 500. The vertical y-axis represents Transmittance in arbitrary units.
* The top spectrum, labeled b in red, and the bottom spectrum, labeled a in black, show nearly identical absorption patterns with vertical dashed lines marking key peaks.
* From left to right, the first major absorption bands occur at 3625.7 and 3406.1 centimeters minus one.
* In the mid-range, two distinct peaks are labeled at 1635.4 and 1429.3 centimeters minus one.
* The most intense absorption band occurs in the fingerprint region at 1037.7 centimeters minus one.
* To the right of the main peak, smaller features are identified at 795.4, 520.2, and 468.6 centimeters minus one.
* Both spectra follow the same trend, though spectrum b is shifted vertically above spectrum a for clarity.
FTIR peaks and peak types of the samples
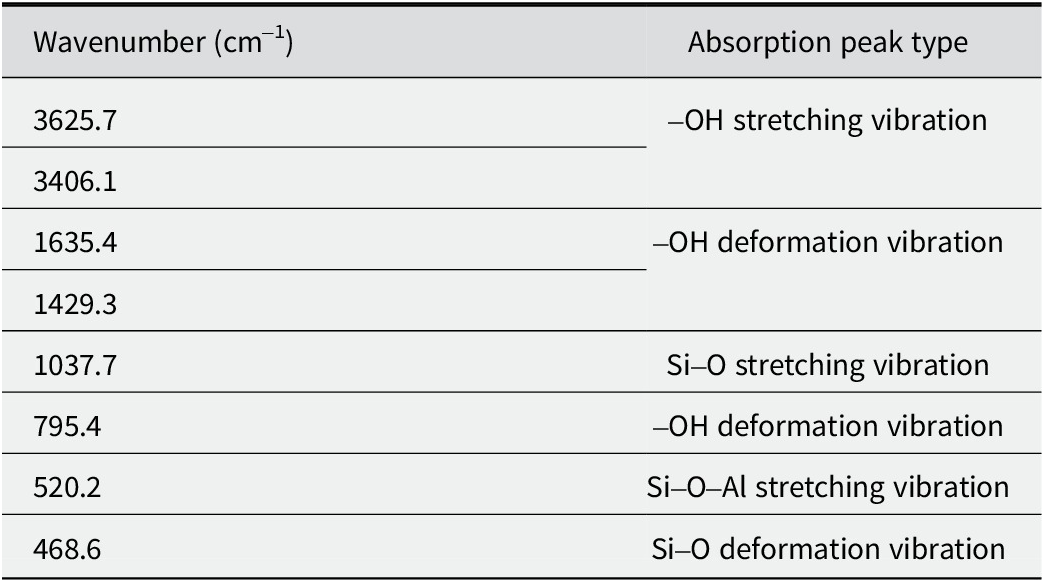
Table 2. Long description
The table consists of two columns: Wavenumber in centimeters super minus 1 and Absorption peak type.
Row 1: 3625.7 and 3406.1 correspond to hyphen O H stretching vibration.
Row 2: 1635.4 and 1429.3 correspond to hyphen O H deformation vibration.
Row 3: 1037.7 corresponds to S i hyphen O stretching vibration.
Row 4: 795.4 corresponds to hyphen O H deformation vibration.
Row 5: 520.2 corresponds to S i hyphen O hyphen A l stretching vibration.
Row 6: 468.6 corresponds to S i hyphen O deformation vibration.
Sustainable release of ClO2 from Mnt microspheres
The concentrations of ClO2 being released from various samples for a range of times (Fig. 9) showed that the concentration of ClO2 increased rapidly within the first 3 days, reached its highest values on the third day and then began to decrease rapidly and reached its minimum values on the eighth day when NaClO2 reacted with NaHSO4 without Mnt microspheres. After 20 g of Mnt microspheres mixed with 20 g of NaClO2 and NaHSO4 (at a ratio of 3:2, NaClO2 to NaHSO4) were added, the concentration of ClO2 reached its highest value on the fifth day and began to decrease slowly and reached its minimum value on the 18th day. These results show that the release rate of ClO2 slowed significantly and its release time was prolonged in the presence of Mnt microspheres. These findings indicate that the Mnt microspheres offer controlled and long-term release of ClO2.
Concentration of ClO2 released from different samples at different times: (a) blank control group; (b) reagent control group; (c) Mnt microsphere group.

Figure 9. Long description
The X-axis represents Storage time (day) from 0 to 20. The Y-axis represents Concentration of C l O sub 2 (p p m) from 0 to 1200.
* Group a (black squares) shows a flat, near-zero baseline trend across the entire 18-day period.
* Group b (red circles) shows a rapid increase from day 1, reaching a sharp peak of approximately 1050 p p m on day 3, followed by a steep decline to near-zero levels by day 8, where it remains stable.
* Group c (green triangles) shows a more gradual increase, reaching a peak of approximately 950 p p m on day 5. It then exhibits a slower decay compared to group b, maintaining a concentration of roughly 150 p p m from day 10 through day 18.
The results (Fig. 10) showed that at the beginning of the experiment, all the waxberries were shiny and looked well, as the images of day 0 show. As the experimental time extended, the waxberries stored in air did not exhibit obvious change, and the waxberries stored in the atmosphere of ClO2 began to fade because of significant oxidation of ClO2. On the second day, some of the waxberry juice seeped out of the waxberries; this did not happen for the waxberries stored in the ClO2 atmosphere, and the color of the air in the beaker containing waxberries turned brown. These imply that ClO2 was released continuously from the mixture of solid NaClO2 and NaHSO4. On the fourth day, the waxberries stored in the air began to mold and deteriorate; this was not observed for the waxberries stored in the atmosphere of ClO2. With increased passing of time, fungal contamination of the waxberries stored in the air got worse gradually; no mold or deterioration was observed on the surfaces of the waxberries stored in the atmosphere of ClO2. These findings demonstrate that ClO2 has a good bacteriostatic effect and plays a key role in protecting the waxberries from bacterial contamination while trying to maintain its freshness. On the eighth day, the waxberries stored in an atmosphere of ClO2 were bleached to bright yellow, and a certain amount of water was released. On the 14th day, the waxberries stored in the ClO2 atmosphere maintained a good appearance, without bacterial contamination, but faded and lost a significant amount of water due to the oxidation ability of ClO2.
Retaining the freshness of waxberries in a range of atmospheres: (a) blank control group; (b) reagent control group; (c) Mnt microsphere group.

Figure 10. Long description
The grid is organized into three horizontal rows labeled a, b, and c, each containing four time-lapse photos labeled Day 0, Day 4, Day 8, and Day 14 from left to right.
Row a, the blank control group, shows dark red waxberries on Day 0. By Day 4, the container is heavily obscured by condensation. On Day 8 and Day 14, the berries appear shriveled and dark through the foggy plastic wrap.
Row b, the reagent control group, begins with dark red berries on Day 0. By Day 4, the berries have turned a bright, pale yellow color, indicating significant chemical change or bleaching. This yellow state persists through Day 8 and Day 14, with the berries maintaining a rounded but discolored shape.
Row c, the M n t microsphere group, shows dark red berries on Day 0. On Day 4, the berries appear light brown or tan with a fuzzy texture. By Day 8 and Day 14, they have transitioned to a pale yellow-white color, similar to row b, but the atmosphere inside the container appears cloudier or filled with a fine vapor compared to the other groups.
The decay and bacterial condition on the surface of the waxberries were observed on the 14th day of experiment (Fig. 11). A lot of white bacterial communities on the surface of the waxberries stored in air on the 14th day could be seen, and many oval patches of mold could be observed in the extract from the waxberries (Fig. 11a). The waxberries stored in an atmosphere of ClO2 were bleached, but no bacterial community could be observed on their surfaces, and no bacteria could be observed in their juice extract (Fig. 11b,c). Thus, the antibacterial effect of ClO2 was verified, but its concentration was too high, resulting in excessive oxidizing and bleaching effects.
Decay and bacterial condition of waxberries on the 14th day of storage under a range of atmospheres: (a) blank control group; (b) reagent control group; (c) Mnt microsphere group.

Figure 11. Long description
The figure consists of three panels, each with a scale bar of 200 micrometers in the bottom right.
* Panel a: The background microscopic view shows a high density of oval-shaped bacterial or fungal cells scattered across the field. The inset photo in the top right shows dark purple waxberries covered in significant white fuzzy mold growth.
* Panel b: The background microscopic view is clear with no visible microbial cells. The inset photo shows pale, off-white waxberries that appear clean and free of visible mold.
* Panel c: Similar to panel b, the background microscopic view is clear and devoid of microbial cells. The inset photo shows pale, off-white waxberries that appear preserved and clean, similar to the reagent control group.
In summary, due to the high concentrations of ClO2, the waxberries were bleached (Figs 10 and 11). To overcome this problem and to find a suitable concentration of ClO2, which would allow us to retain the freshness of the seasonal fruits for longer, the molar ratio of Mnt microspheres to ClO2 precursors was investigated, and the results are presented below.
Concentration of ClO2 released
The concentrations of ClO2 released from various mass ratios of Mnt to NaClO2 and NaHSO4 (5:1, 2:1, and 1:2) for a range of times (Fig. 12) showed a tendency to increase rapidly and then to decrease rapidly, and subsequent concentrations showed wave-like changes within concentration ranges of 100.0–200.0 ppm. When the mass ratio of Mnt to ClO2 precursor was 1:2, the initial concentration of ClO2 released from Mnt was 95.0 ppm, the concentration of ClO2 then increased to the highest level, 500.0 ppm, on the fifth day, then decreased slowly and reached 150.0 ppm on the 21st day (Fig. 12). When the mass ratio was 2:1, the initial concentration of ClO2 released from Mnt was 98.0 ppm; it then increased to its largest value, 470.0 ppm, on the fifth day, and then decreased slowly until reaching 110.0 ppm on the 21st day. When the mass ratio was 5:1, the initial concentration of ClO2 released from Mnt was 90.0 ppm, the concentration of ClO2 increased to its greatest value, 190.0 ppm, on the fifth day, and then varied from 110.0 ppm to 150.0 ppm, reaching 140.0 ppm on the 21st day.
Concentrations of ClO2 released from various mass ratios of Mnt to NaClO2 and NaHSO4 for a range of times.

Figure 12. Long description
A line graph with Storage time day on the X axis ranging from 2 to 22 and Concentration of C l O sub 2 p p m on the Y axis ranging from 0 to 600.
Three data series are plotted:
* 1 to 2 ratio (green line with triangles): Starts near 100 p p m, rises sharply to a major peak of approximately 520 p p m at day 5, then fluctuates downward, maintaining the highest values of the three groups until day 22.
* 2 to 1 ratio (red line with circles): Follows a similar trend to the green line but with a lower peak of approximately 370 p p m at day 5, eventually stabilizing between 100 and 200 p p m.
* 5 to 1 ratio (black line with squares): Shows the lowest release profile, peaking at approximately 200 p p m on day 5 and remaining the most stable and lowest concentration series throughout the 22 day period.
All three ratios show an initial lag for the first 4 days, a synchronized spike on day 5, and a gradual decline with minor oscillations toward the end of the storage period.
The concentrations of ClO2 released from various mass ratios of Mnt microspheres to NaClO2 and NaHSO4 for a range of times (Fig. 13) demonstrated a smooth decreasing trend. When the ratio was 5:1, the ClO2 concentration became stable throughout the experiment. Overall, the ClO2 concentrations were much lower (<100.0 ppm) compared with the other ratios. When the ratio was 1:2, the initial concentration of ClO2 release from Mnt microspheres was 76.0 ppm, the concentration of ClO2 increased to 85.0 ppm on the third day, decreased slowly, reaching 51.0 ppm on the 21st day. When the mass ratio was 2:1, the initial concentration of ClO2 release from Mnt microspheres was 39.0 ppm, the concentration of ClO2 increased to 49.0 ppm on the third day, then decreased slowly, reaching 26.0 ppm on the 21st day. When the mass ratio was 5:1, the concentration of ClO2 release from Mnt microspheres did not change much, ranging from 16 to 18.0 ppm. These results show that the higher the mass ratio of Mnt microspheres to NaClO2 and NaHSO4, the lower the concentration of ClO2 released.
Concentrations of ClO2 released from various mass ratios of Mnt microspheres to NaClO2 and NaHSO4 for a range of times.

Figure 13. Long description
The line graph plots Concentration of C l O sub 2 in p p m on the vertical Y axis from 0 to 100, against Storage time in days on the horizontal X axis from 0 to 21.
* The 1 to 2 ratio, represented by green triangles, starts at approximately 75 p p m, peaks at nearly 90 p p m on day 3, and then shows a steady downward trend to approximately 50 p p m by day 20.
* The 2 to 1 ratio, represented by red circles, starts at approximately 40 p p m, peaks at 50 p p m on day 3, and gradually declines to approximately 25 p p m by day 21.
* The 5 to 1 ratio, represented by black squares, remains nearly constant and stable throughout the 2 1 day period, maintaining a low concentration of approximately 20 p p m.
The lower ClO2 concentration (<100.0 ppm) suggests that Mnt microspheres have a much greater storage capacity for ClO2 than Mnt alone does, and the Mnt microspheres have excellent adsorption capacity and ability to control the release of ClO2 for a long period.
When the mass ratio of Mnt microspheres to the precursors of ClO2 was 1:2, on the seventh day of the experiment, at a concentration of ClO2 of 80.0 ppm (Fig. 13), the color of the grapes changed significantly, from deep-purplish red to yellowish brown (Fig. 14). On the fourteenth day, the color of the grapes faded gradually to a bright yellowish-brown at a ClO2 concentration of 69.0 ppm (Fig. 13), and the grapes began to release juice (Fig. 14). On the 21st day, the grapes faded to white with much of their juice released; the fruit became much softer at a ClO2 concentration of 51.0 ppm (Fig. 13). For the mass ratio of 2:1, on the seventh day at a concentration of ClO2 of 36.0 ppm, the color of the grapes changed from deep-purplish red to reddish brown (Fig. 14). On the 14th day of experiment, with ClO2 concentrations of >35 ppm (Fig. 13), the color of the grapes faded to brown (Fig. 14), and eventually to light brown on the 21st day at ClO2 concentrations of >26.0 ppm (Fig. 13). During this period, the grapes did not lose juice, and the weight and hardness did not change compared with the status before the experiment. When the mass ratio was 5:1, the concentration of ClO2 released from the Mnt microspheres was stable at 16.0–18.0 ppm (Fig. 13) and the appearance and color of the grapes were retained very well, and the weight and hardness did not change obviously either (Fig. 14). These findings demonstrate that the concentration of ClO2 plays a vital role in retaining the freshness of grapes, and that the optimal concentration for retaining the freshness of the fruit is 16.0–18.0 ppm.
Retaining the freshness of grapes for a range of mass ratios of Mnt microspheres to the precursors of ClO2.

Figure 14. Long description
The grid is organized by mass ratios on the vertical axis and time on the horizontal axis.
Top row (1 to 2 ratio):
- Day 1: Grapes are dark purple and plump.
- Day 7: Grapes have turned a light orange-brown color.
- Day 14: Grapes are pale yellow and appear translucent.
- Day 21: Grapes are almost white and show significant discoloration.
Middle row (2 to 1 ratio):
- Day 1: Grapes are dark purple.
- Day 7: Grapes show a slight brownish tint but remain mostly purple.
- Day 14: Grapes are a medium brown color.
- Day 21: Grapes are dark brown and appear slightly shriveled.
Bottom row (5 to 1 ratio):
- Day 1: Grapes are dark purple.
- Day 7: Grapes remain dark purple with no visible change.
- Day 14: Grapes maintain their dark purple color and plumpness.
- Day 21: Grapes remain dark purple, showing the highest level of freshness retention compared to the other ratios.
Discussion
Water evaporating from waxberries and grapes is a natural phenomenon. After the Mnt microspheres were mixed with solid NaClO2 and NaHSO4, and set in a closed beaker containing waxberries and grapes, some of the water evaporated will be adsorbed by Mnt microspheres. In this case, a certain amount of water from the waxberries and grapes (Liang et al., Reference Liang, Yao, Liu, Li, Xu, Fu and Lin2022; Xanthopoulos et al., Reference Xanthopoulos, Templalexis, Aleiferis and Lentzou2017), and from the Mnt microspheres (Gates et al., Reference Gates, Aldridge, Carnero-Guzman, Mole, Yu, Iles, Klapproth and Bordallo2017; Knudsen et al., Reference Knudsen, Fossum, Helgesen and Bergaplass2003) evaporated into the beaker and reacted with NaClO2 and NaHSO4 to produce ClO2. In this way, the ClO2 was released into the beaker, and adsorbed by the Mnt microspheres (Fig. 15). When the concentration of ClO2 in the beaker was greater, ClO2 was adsorbed by the Mnt microspheres and then released slowly. This is why Mnt microspheres mixed with NaClO2 and NaHSO4 allow for long-term release of ClO2; the other reason is the adsorption property of Mnt microspheres.
Mechanism for the controlled and long-term release of ClO2 from Mnt microspheres.

Figure 15. Long description
The flowchart begins on the left with a porous microsphere and a plus sign. To its right are two chemical structures. The first is N a C l O sub 2, shown as a purple N a super plus ion and a bent C l O sub 2 super minus molecule with a central green atom and two red atoms. The second is N a H S O sub 4, shown as a purple N a super plus ion and a tetrahedral H S O sub 4 super minus molecule with a central yellow atom, four red atoms, and one white atom. A horizontal arrow labeled well-mixed adsorption points to a microsphere now coated in small green and yellow particles. To the right of this coated sphere, a curved arrow points downward toward four C l O sub 2 molecules, each with one green and two red atoms. Above this, another curved arrow points from a cluster of four H sub 2 O molecules, labeled H sub 2 O, toward the coated sphere. At the far top-right, photos of grapes and bayberries have arrows pointing toward the H sub 2 O molecules, indicating they are the source of moisture that triggers the release of the C l O sub 2 gas.
ClO2 released from the Mnt microspheres can effectively diffuse onto the surfaces of waxberries and grapes, thereby inhibiting respiration and ethylene synthesis in the fruits (Guo et al., Reference Guo, Lv, Xu, Zhang, Wang, Lin and Wu2013). As ClO2 is a small molecule with strong oxidation ability, it can penetrate the membrane of bacterial cells easily and change the permeability of the membrane by reacting with its oxygenated compounds and proteins, resulting in the disruption of cell metabolism (Malka and Park, Reference Malka and Park2022). In addition, ClO2 can oxidize the sulfhydryl groups of enzymes into –S–S– groups, resulting in the loss of enzyme activity, inhibiting the synthesis of amino acids, blocking the replication and transcription of DNA and RNA, and ultimately leading to bacterial inactivation (Sun et al., Reference Sun, Baldwin and Bai2019); thus the bacteria will be killed when ClO2 is present.
Comparing the concentration and release time of ClO2 from Mnt microspheres (Fig. 13) with those of Mnt (Fig. 12), the initial concentration of ClO2 release from Mnt is greater than that from Mnt microspheres; the time to reach the highest concentration of ClO2 is different, the fifth day for Mnt and the third day for Mnt microspheres, respectively. The highest concentration of ClO2 is also different, 500.0 ppm for Mnt and 95.0 ppm for Mnt microspheres, respectively. Note that when the mass ratio of Mnt to NaClO2 and NaHSO4 is 5:1, the concentration of ClO2 released from Mnt microspheres is very stable (16.0–18.0 ppm), while that from Mnt varies much more widely, from 90.0 to 190.0 ppm. These findings demonstrate that Mnt microspheres offer better and more controllable and long-term release of ClO2 than Mnt particles.
The slow release of ClO2 from Mnt microspheres and the mechanism for the release are not well understood. More attention is needed to investigate the surface properties of the Mnt microsphere, and to grasp the transportation behavior of ClO2 from the interior space to outer space of the Mnt microsphere.
Conclusions
In summary, montmorillonite microspheres with a novel, hollow, mesoporous structure were prepared using a spray-drying method. Their diameters are uniform with good dispersity. The sphere walls are composed of montmorillonite nanoparticles and mesopores, and the mesopores connect the interior cavity with exterior space.
The specific surface area of the microspheres is >41 m2 g–1, and the pore apertures range from 2 to 150 nm. The montmorillonite microspheres have good adsorption, and offered controllable, long-term release of ClO2; they can thus be used as an antibacterial substance and be deployed to help retain the freshness of seasonal fruits. Specifically, when the mass ratio of montmorillonite microspheres to NaClO2 and NaHSO4 is 5:1, the concentration of ClO2 gas releases from the microspheres is stable at between 16.0 and 18.0 ppm, which is suitable for retaining freshness of seasonal fruits. These findings demonstrate another application area for montmorillonite-based inorganic materials.
Data availability statement
All the data are listed in the manuscript and in its supplemntal materials.
Acknowledgments
The authors acknowledge the financial support of this research by the National Key Research and Development Program of China (202122YFC2904804), and Zhejiang University of Technology Transverse Research Project (KYY-HX-20190025). And thanks Zhejiang University of Technology Analysis and Testing Center for its help in the analysis of the charaterization results.
Author contribution
Experimental operation, designing and writing – review, J.Y.; Experimental operation and manuscript writing, X.Y. and X.L.; Data proofreading and analysis, Y.L.; Designing, writing – review, editing and supervision, G.H.
Financial support
The authors acknowledge the financial support of this research from the National Key Research and Development Program of China (202122YFC2904804), and Zhejiang University of Technology Transverse Research Project (KYY-HX-20190025).
Competing interests
The authors declare that they have no competing interests.