I. INTRODUCTION
The ability to control the spatial positioning and size distribution of arrays of quantum dots (QDs) would provide an enabling technology for new device paradigms based on interactions between dots that localize charge, spin, or magnetic moment. As an example, relevant to this work, antiferromagnetic coupling with linear chains consisting of an odd number of QDs that each contain a single spin would act as a S = ½ cluster qubit, whose behavior closely resembles that of a standard single spin s = ½ qubit.Reference Meier, Levy and Loss1, Reference Meier, Levy and Loss2 The advantages of a spin cluster qubit are reduced sensitivity to the individual coupling components within the cluster and larger spatial extent of the qubit wave function. This allows one to control the strength of spin coupling within an entire cluster via localized applied magnetic fields on the scale of the entire group, i.e., about an order of magnitude increase in length scale for a 9 spin linear cluster. Well-defined qubits can also be formed from two- or three-dimensional spin clusters with an uncompensated spin.Reference Meier, Levy and Loss1, Reference Meier, Levy and Loss2
A key requirement for such arrays or devices is to position spins sufficiently closely to realize exchange coupling energies comparable to k BT. Pryor et al.Reference Pryor, Flatté and Levy3 predicted observable exchange coupling behavior between electrons localized by adjacent heteroepitaxial Ge QDs embedded in Si. Strain-induced bending at the band edges of Ge and Si led to formation of shallow minima in the Si conduction band at the heterointerfaces that could confine electrons. The wave function decay lengths are of order 10 nm, allowing an exchange interaction energies as large as 1.3 meV for QDs with interdot separations of 24 nm.
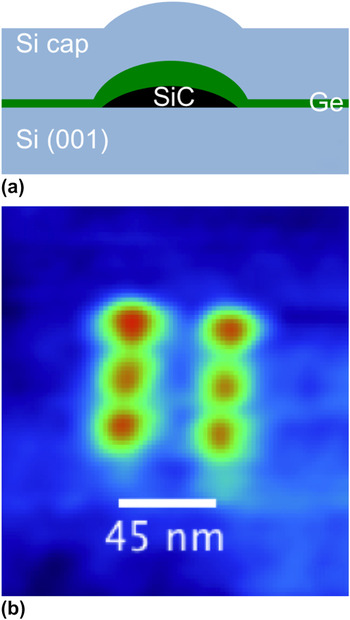
In ongoing work, we have investigated the use of SiC QD arrays, written using electron beam-induced deposition (EBID) to localize subsequent Ge QD self-assembly during molecular beam epitaxy (MBE).Reference Guise, Marbach, Levy, Ahner and Yates4–Reference Guise6 In this paper, we report on the SiC nanodot array itself, focusing on how the thermal budget during and after carbide formation controls coarsening, thereby leading to loss of control over the dot size distribution. Figure 1(a) shows an atomic force microscopy (AFM) micrograph of a QD molecule structure grown under optimized conditions, where the interdot spacing is only 22.5 nm. Figure 1(b) shows a schematic cross section of the idealized structure, consisting of an epitaxial SiC nanodot on Si, with 1.5 monolayers of epitaxial Ge overgrowth. A recent paper demonstrated that the process we use produces 3C-SiC/Si(001) epitaxial nanodots, in the cube-on-cube orientation, and that these dots can be epitaxially encapsulated with Ge or Si.Reference Petz, Yang, Levy and Floro7 Here, we investigate the uniformity and thermal stability of the as-written carbonaceous deposits during carbidization and during postannealing. The knowledge gained here is important for two reasons: (i) understanding the mechanisms of SiC based templating of Ge QDs (ii) elucidating the potential of electronic and optical properties of SiC arrays themselves.
(a) Schematic representation of idealized self-assembled Ge QD on a SiC template. (b) “Six” qubit of embedded SiC/Si(001) nanodots. Minimum pitch is 22.5 nm.

II. EXPERIMENT
The films examined here consist of Si(001) wafers with a template of SiC nanodots, upon which were grown 1.3 ML of Ge. Si wafers with a miscut of 0.1° were cleaned via a modified Interuniversity Microelectronics Centre/Shiraki process and passivated in the final step by oxidation in an ultraviolet (UV)–ozone environment. The SiO2 layer was then stripped in a dilute HF solution immediately before loading into a Raith e_LiNE electron beam lithography system (P base ∼ 10−7 Torr) operating with an accelerating voltage of 20 keV and emission current of 21 pA. Focused electron beam irradiation of ambient hydrocarbon adsorbates on the Si(001) surface yielded nanoscale islands of carbonaceous material, presumably amorphous hydrogenated carbon, which we refer to as aC:H.Reference Guise, Marbach, Levy, Ahner and Yates4, Reference Guise6 Square arrays of N × N aC:H nanodots were written, with interdot spacings of 100, 50, and 35 nm and N as large as 300. Previous studies by Guise et al.Reference Guise, Ahner, Yates and Levy5 have characterized the size of these islands as a function of exposure time, and for this study, we used an optimized exposure time of 3–6 ms. Next, the templated nanodots were exposed to UV–ozone to eliminate excess hydrocarbon contamination between the patterned sites. Since this also simultaneously etched the patterned nanodots, UV–ozone exposure was critically controlled to prevent their complete removal.
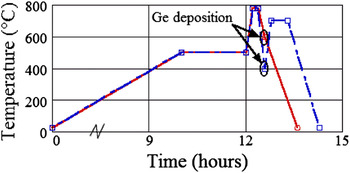
The patterned wafers were then inserted in to the ultrahigh vacuum (UHV) MBE chamber (P base = 1 × 10⁻¹⁰ Torr) and radiatively heated during 9-h temperature ramp to 500 °C. Following, all samples dwelt at 500 °C for at least an hour before oxide desorption at 780 °C to provide further outgassing. Throughout the deoxidation process, the surface structure was monitored with reflection high energy electron diffraction to ensure that a smooth 2 × 1 reconstructed surface developed, as indicated by the presence of a Laue ring of diffraction spots. During the oxide desorption at 780 °C, it was shown that the aC:H nanodots are converted to SiC.Reference Petz, Yang, Levy and Floro7 Upon cooling to the growth temperature, 1.3 ML of Ge was deposited via magnetron sputtering in 3 mTorr of getter-purified Ar at a rate of 0.1 Å/s. Ge deposition at 600 °C and Ge deposition at 400 °C with subsequent annealing at 700 °C were examined for their effects on thermal stability of the overall structure.
Another important requirement of this work is to obtain the distribution of feature volumes along the process flow, e.g., before and after each deposition and annealing step. To do this, we first thoroughly characterized the template morphology after Ge growth, using AFM. Next, we selectively etched the Ge using H2O and H2O2, known to etch Si–Ge alloys with C Ge > 0.6,Reference Katsaros8, Reference Merdzhanova, Rastelli, Stoffel, Kiravittaya and Schmidt9 and then measured the morphology again on the identical area of the template, giving a direct feature comparison. In some cases, a HF etch was performed instead, with only minor differences in the results.
Ex situ AFM was performed with a NT-MDT Solver Pro-M (Zelenograd, Moscow, Russia) in semicontact mode using NSG01 tips with radius <6 nm. Obtaining accurate topographic measurements of nanoscale islands is nontrivial when the feature radius is near that of the AFM tip. At this small size limit, the effect of tip convolution is predominantly a function of island aspect ratio.Reference Danzebrink, Koenders, Wilkening, Yacoot and Kunzmann10 Via AFM measurements, we typically observe Si/Ge/SiC nanostructures with diameters (Ø) between 5 and 25 nm and aspect ratios of 0.10–0.20. After simple geometrical comparison of AFM measurements with cross-sectional transmission electron microscopy (TEM), we find that the volume overestimation due to tip convolution is about +20%. We are primarily interested in the relative change in volume as a means of assessing our process conditions, thus the effects of tip convolution are neglected in all measurements, noting that our reported island volumes and linear dimensions represent an upper bound.
III. RESULTS
While control of template spacing is predominantly limited by the resolution of the EBID process, the composite island size depends on all subsequent process steps. Two aspects in this process are of key importance—the UV–ozone clean and the detailed thermal budget seen by the template. The two annealing and deposition temperature profiles explored in this study are plotted in Fig. 2. In the work reported here, we kept the UV–ozone exposure constant but varied the thermal budget. In particular, a relatively low temperature dwell at 500 °C, which was used to drive off adsorbates from the sample before desorption of the passive oxide at 780 °C, had a surprisingly strong effect on the final size, and the distribution of sizes, of the templated features.
Temperature profiles for the two annealing and deposition conditions studied in this publication.

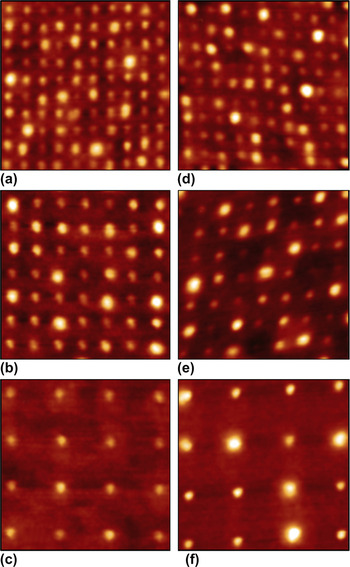
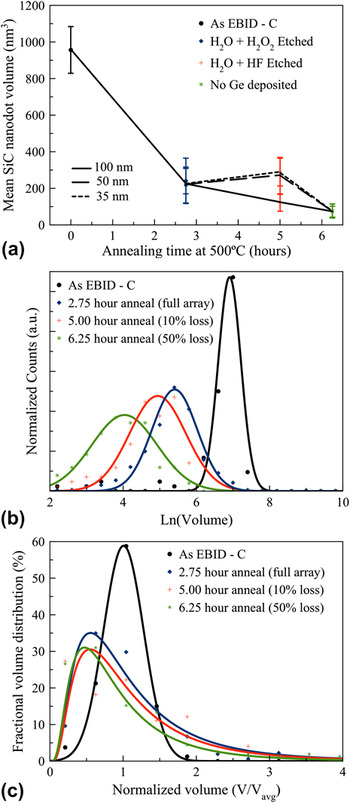
Figure 3 shows AFM images of a small portion of the Ge/SiC arrays after Ge growth at 600 °C and after Ge growth at 400 °C followed by a 700 °C anneal. From the AFM images, we obtain the distribution of feature volumes (where “feature” refers either bare SiC nanodots or Ge/SiC composite structures) through flooding analysis. Figure 4(a) shows the average volume of the SiC arrays with 35, 50, and 100 nm spacings. The sample with “zero” annealing time represents the aC:H nanodot mean volume before any heating in UHV. The other three samples had an identical in vacuo thermal budget and identical Ge depositions, differing only in the dwell times at 500 °C before oxide desorption. Hence, the observed changes can result only from the dwell. The arrays with dwell times of 2.75 and 5.00 h were overgrown with 1.3 ML of Ge at 600 °C, which was selectively etched off as indicated. The dwell time of 6.25 h had no Ge grown on the SiC template.
35, 50, and 100 nm feature arrays after (a–c) 600 °C and (d–f) 400 + 700 °C Ge depositions. Each tile is a 350 × 350 nm section from larger arrays. (Note: small deviations in orthogonality are due to drift during AFM scanning.)

(a) Average SiC nanodot volume versus dwell times at 500 °C. In all cases, Ge has either been deposited and then selectively removed or not deposited at all. 35, 50, and 100 nm template spacings are delineated by connecting lines. (b) Corresponding distributions of nanodot volumes for the 100-nm pattern spacing for each 500 °C dwell time, where ln(V) is used to more clearly show the evolution of the mean size. (c) The distributions are plotted on a linear volume scale normalized to the mean volume of each distribution.

Figure 4(a) clearly shows that the overall heating and conversion to SiC results in up to 86% reduction in feature volume from the original aC:H nanodots. While some of this reduction is likely associated with the high temperature conversion to SiC, there is a strong dependence on the 500 °C dwell time. For example, from Fig. 4(a), the mean SiC nanodot volume after 6.25 h dwell is reduced by 65% compared with the 2.75-h dwell. Hence, significant mass was lost during the dwell. Furthermore, as shown in Figs. 4(b) and 4(c), the shape and the width of the distribution of volumes increase with the dwell time at 500 °C, on both an absolute scale and when normalized by mean volume, reducing the array uniformity. Figure 4(c) shows that the size distribution evolves from a Gaussian distribution as-EBID, toward a lognormal distribution after the in situ dwell. The initial distribution full width at half maximum (FWHM) after EBID + UV–ozone is about ±25% of the mean size, but the distribution broadens during the dwell with the formation of a significant tail toward larger island size.
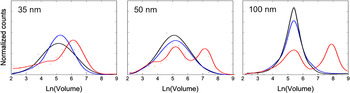
In depositions shown without postannealing, the presence of Ge had no effect on the size and distribution of the templated arrays. In fact, it was recently shown that Ge completely avoids SiC sites during elevated temperature growth (T ∼ 600 °C).Reference Petz, Yang, Levy and Floro7 Alternatively, the effects of postdeposition annealing on the size uniformity are shown in Fig. 5, where the 2.75-h dwell time is the same for each sample. Each volume distribution is obtained from more than 200 features per array. For comparison, the size distributions after selective removal of the Ge are also shown, where pre- and postetching distributions are measured from the exact same features. Growth of 1.3 ML of Ge at 600 °C results in a volume distribution, which is nearly identical to that of the underlying SiC template (obtained by selective etching). This observation holds for all three interdot spacings. On the other hand, growth of Ge at 400 °C, followed by a 700 °C 30-min anneal, clearly leads to coarsening. The total volume of the distribution is larger than the distribution for conformal Ge on the SiC template, implying that additional mass was accumulated. Furthermore, the degree of coarsening increases with the interdot spacing. At 100 nm, a clearly bimodal distribution is produced. The bimodality is less pronounced at 50 nm spacing, and only a shoulder is observed at 35 nm.
Volume distributions of Ge/SiC composite islands (2.75-h dwell at 500 °C) for two different growth strategies: (blue) Ge deposited at 600 °C and (red) Ge deposited at 400 °C then annealed at 700 °C. (a) 35 nm spacing, (b) 50 nm spacing, and (c) 100 nm spacing. For comparison, the bare SiC arrays after selective Ge etching are also shown (black). In the case of 100 nm spacing, the annealed specimen was also etched (dashed black).

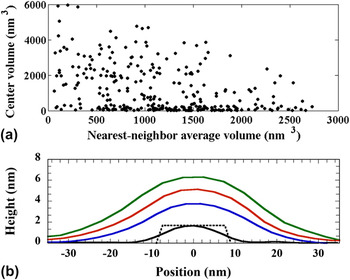
To further investigate the degree of coarsening, we also plot the volume of each island relative to the average volume of eight nearest neighbors in Fig. 6(a). In general, we observe an inverse trend such that larger islands tend to have smaller neighbors, on average, consistent with a coarsening mechanism.Reference Guise6 For comparison with typical SiC nanodots (black line), line profiles of select highly coarsened features from a 100-nm array are shown in Fig. 6(b). The enlarged island radius is triple that of the initial carbide. Tip convolution effects are certainly present when measuring the smallest islands, but the observed profile should be accurate for enlarged islands.
(a) A scatter plot showing the average nearest-neighbor volume surrounding each island and (b) line profiles of a typical SiC nanodot (black line) and coarsened Si1−xGex/SiC composite islands (blue, red, and green lines) from 100-nm spacing arrays, e.g., Fig. 3(f). The dotted line trace shows the actual SiC size/shape as observed in TEM.Reference Petz, Yang, Levy and Floro7

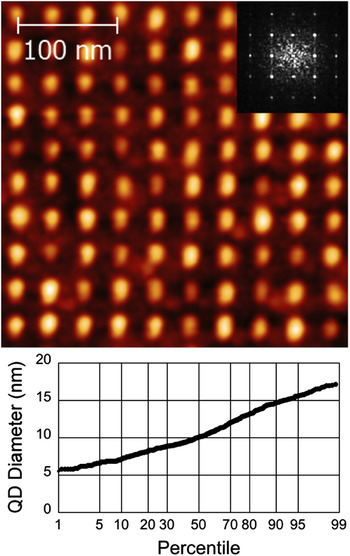
In Fig. 7(a), we show a 35-nm array after Ge deposition at 600 °C along with a fast Fourier transform (FFT) of the full array. By extracting the FWHM of the first-order <01> peak, we determine the average spatial variation to be ±1.6 nm. While positional accuracy of these QDs is adequate for device needs, it is more difficult to control the diameter of the SiC template. Figure 7(b) is a cumulative probability plot of QD diameters for the same 35-nm array. In the observed distribution, 51% of islands have FWHM ≤10 nm and 95% have FWHM ≤15 nm.
(a) AFM image of a 10 × 10 array section of composite Ge/SiC QDs with 35 nm spacing. The inset displays a FFT of the full array; the FWHM of the <10> peak determines a positional error of ±1.6 nm. (b) Cumulative probability plot of the QD diameters for the same 35-nm spacing array. 51% of islands have Ø ≤ 10 nm, while 95% have Ø ≤ 15 nm.

IV. DISCUSSION
We have further examined and refined the process of EBID patterning of SiC nanodot arrays originally developed by Guise et al.,Reference Guise, Ahner, Yates and Levy5, Reference Guise6 where focused electron beam-induced cracking of native adsorbed hydrocarbons on the Si surface is used to write patterns of nanoscale aC:H nanodots. Excellent positional accuracy is obtained in the composite Ge/SiC arrays, but the size homogeneity depends sensitively on the in situ subsequent thermal treatment before carbide formation as well as on post-Ge annealing. Our results show that the relatively narrow size distribution provided by the EBID write process and subsequent UV–ozone clean can only be maintained if the thermal budget is strictly controlled, especially before the formation of the carbide phase. Selective etching experiments demonstrate that Ge deposited at 600 °C is either conformal or rejected from patterned SiC nanodots, while postgrowth annealing to higher temperatures leads to extensive coarsening of the Ge/SiC system, possibly embedding in a dilute Si1−xGexalloy. In the following, we discuss the mechanisms and implications of these results.
A. Evolution before carbidization
During heating of the EBID-written aC:H patterned features in UHV, a 500 °C dwell is found to strongly affect the final feature size, with longer dwells leading to reduced feature size and a much broader size distribution. Possible mechanisms for these changes include evaporative loss, diffusive loss into the substrate, and interparticle coarsening. We eliminate carbon diffusion into Si as a loss mechanism since it is insignificant below 600 °C.Reference Chung and Wu11, Reference Chung and Wu12 Interdot coarsening by itself cannot lead to loss of mass. Hence, volatile hydrocarbons must evaporate during annealing at 500 °C; others have similarly reported dehydrogenation of aC:H between 450 and 550 °C.Reference Guise, Marbach, Levy, Ahner and Yates4 The concomitant evolution from a symmetric distribution as-EBID to a negatively skewed distribution suggests that something beyond simple evaporative loss is occurring. We used a simple model to examine how evaporation affects the shape of the particle size distribution. The rate of volume loss due to evaporation will be given by:
 [$$<![CDATA[$$\dot V = - {\rm{\alpha }}V^{2/3} P_0 (T)\left( {1 + {\raise0.7ex\hbox{${\rm{\rho }}$} \!\mathord{\left/ {\vphantom {{\rm{\rho }} {V^{1/3} }}}\right.\kern-\nulldelimiterspace}\!\lower0.7ex\hbox{${V^{1/3} }$}}} \right)\quad,$$
where V 2/3 is proportional to the surface area, P 0 is the bulk vapor pressure at temperature T, i.e., the number of atoms evaporating per area per time. This is multiplied by a term that captures the Gibbs–Thompson effect of increased vapor pressure at very small particle size. α and ρ are constants that include geometry and materials-dependent factors. The initial distribution of particle sizes can be evolved according to a standard continuity equation:
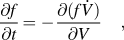 $${{\partial f} \over {\partial t}} = - {{\partial (f\dot V)} \over {\partial V}}\quad,$$
where f(V, t) is the distribution of particle volumes. Starting with a symmetric Gaussian distribution of particle volumes, f(V, 0), and evolving the distribution by solving Eq. (2) iteratively assuming pure evaporative loss governed by Eq. (1), we find that the f(V, t) monotonically develops positive skew, rather than the negative skew observed in Fig. 4(c). (Positive skew arises because large particles evaporate faster than small particles as the larger surface area overcomes the Gibbs–Thompson effects.) The inability of simple evaporation to create a negatively skewed size distribution suggests that coarsening is occurring simultaneously with evaporation, likely mediated by a nonvolatile surface diffusing species, e.g., carbon atoms on the surface of the native SiO2. The evolution of the size distribution from Gaussian as-EBID to lognormal after processing is consistent with the Ostwald ripening. Once stable SiC carbide forms and all free carbon are depleted, it seems likely that further coarsening of the carbide dots will only occur at much higher temperatures of order the formation temperature.
B. Ge overgrowth and annealing
The growths reported here mostly used only 1.3 ML of Ge, following Guise et al., and Fig. 5 shows that Ge growth at 600 °C results in a volume distribution that exactly replicates the underlying SiC nanodot distribution, implying that either Ge does not stick to the SiC or is conformal over both the SiC nanodots and the bare Si regions in between. The former is proven consistent with cross-sectional high-angle annular dark field scanning transmission electron microscopy.Reference Petz, Yang, Levy and Floro7 On the other hand, 400 °C growth of Ge followed by 700 °C annealing promotes extensive mass transport and clear indications of coverage over the carbides. Coarsening is further indicated by the observation that the largest islands have smaller neighbors on average. Integrating the distributions before and after Ge growth and annealing steps demonstrates that a net volume increase occurs. We suggest that upon annealing, the accumulation of additional mass is most likely Si which has been scavenged from the surrounding substrate. Ge overgrowth at 400 °C (compared to 600 °C) may kinetically limit Ge diffusion off of the SiC and hence promote lateral overgrowth during the high temperature anneal. Since negligible volume change is observed after selective Ge etching and Ge has no known propensity for alloying with C,Reference Krishnamurthy, Drucker and Challa13 we infer that the resulting island volume consists of a dilute Si1−xGex (x < 0.6) alloy covering of the SiC nanodot. The formation of a bimodal distribution (see Fig. 5) suggests that some of the dots possess some discrete advantage that aids more rapid growth. However, the origins of this advantage in either chemical potential or in growth kinetics are unknown.
C. Device implications
As per the theoretical calculations of Pryor et al.,Reference Pryor, Flatté and Levy3 tensile-strained Si epitaxially encapsulating a Ge QD can trap electrons in localized energy states in the Si just above the apex of the dot, due to strain-induced reduction of the conduction band energy. Electrons inhabiting identical states in adjacent QDs can undergo coupling via exchange interactions, with energies of order 1 meV for interdot separations (center-to-center) of order 25 nm. Clearly, this also sets strict limitations on dot size. We are achieving the requisite length scales, down to 22.5 nm interdot spacing (Fig. 1) and <10 nm nanodot widths [Fig. 6(b)] in the SiC template, and it is certainly possible to write even finer spacings using EBID, which should be retained through careful control of the overall thermal budget.
Although morphological Ge QDs are not forming under optimized conditions for pattern retention, epitaxial electronic QDs may still form. The lattice mismatch between Si (Ge) and SiC is −20% (−23%), which cannot be supported elastically even in a single monolayer. At such large mismatch, we have found that arrays of misfit dislocations nucleate in the first layer of overgrowth on the carbide establishing semicoherent interfaces that exhibit small residual strain fields.Reference Petz, Yang, Levy and Floro7, Reference Palmstrom14–Reference Floro, Michael, Brewer and Hsu16 Si overgrowth on the substrate between SiC sites will be completely unstrained resulting in periodic strain modulation with the pitch of the predefined SiC. Preliminary magnetotransport measurements of single- and multidot structures on the nanodice pattern of Fig. 1, versus regions with no nanodots, do yield clear differences in behavior characteristic of electron confinement in discrete Zeeman-split energy levels when dots are present.Reference Yang, Petz, Floro and Levy17
V. CONCLUSION
We have shown that arbitrary placement control of sub-10-nm SiC nanodots, with interdot spacing down to 22.5 nm, a narrow size distribution, and subnanometer control over position, is achievable with EBID of ambient hydrocarbons to form amorphous hydrogenated carbon nanodots. With careful control of cleaning and thermal budget, the relatively narrow size distribution imposed by EBID can be retained upon high temperature transformation to stable epitaxial 3C-SiC nanodots. This process can create ordered arrays of SiC QDs, for use as growth templates, e.g., in spintronic applications mentioned here, or to take advantage of the inherent electronic and optical properties of SiC.
ACKNOWLEDGMENTS
Support from the U.S. Department of Energy Office of Basic Energy Sciences is gratefully acknowledged under Grant No. DE-FG02-07ER46421.