Introduction
Aquaculture in coastal waters has emerged globally as a promising food production system for cultivating many aquatic species with minimal inputs (NOAA, 2013). In coastal aquaculture, selecting suitable coastal environment settings and appropriate species is crucial to the sustainability of production practices (Haque and Mahmud, Reference Haque and Mahmud2025). Coastal ecosystems, however, are very dynamic and variable due to natural stressors like climate change, intrusion of seawater or freshwater, and anthropogenic pressures from human population growth and coastal development (Paul Reference McElhany and Browman2017). The main challenging feature within the coastal/estuarine waters is the variable salinity regime, which can be either gradual or sudden (Salehin et al., Reference Salehin, Chowdhury, Clarke, Mondal, Nowreen, Jahiruddin, Haque, Nicholls, Hutton, Adger, Hanson, Rahman and Salehin2018). Extreme salinity fluctuations in coastal waters are increasingly reported from various parts of the world (Sumithra et al., Reference Sumithra, Arun Kumar, Swaminathan, Anusree, Amala, Reshma, Kishore, Ratheesh Kumar, Sharma, Kripa and Prema2020). As the survival and growth of the farmed fish or invertebrates in coastal production practices are directly influenced by the environmental conditions, the determination of salinity tolerance is one of the prerequisites for testing culture potentialities (Yadav et al., Reference Yadav, Patel, Singh, Mehta, Anand, Lal and Devi2024). Considering the existing changes and future trajectories of climate change, understanding the salinity tolerance and behavioural modifications of aquatic animals under altered salinity regimes is vital. This is especially relevant for species targeted for coastal aquaculture (Woodin et al., Reference Woodin, Wethey, Olabarria, Vázquez, Domínguez, Macho and Peteiro2020). Behavioural attributes in response to different salinity shifts can be measured for early detection of stress and are a good approximation of species fitness and survival under natural and captive culture conditions (Zhang et al., Reference Zhang, Ye, Qi, Cai, Saraiva, Wen and Zhao2025). Information on lethal and sublethal responses also forms a fundamental criterion in the conservation management of natural populations. Accordingly, knowledge of changes in the behavioural attributes in response to salinity shifts and lethal salinity ranges will aid in the domestication and effective development of coastal aquaculture practices (Barange et al., Reference Barange, Bahri, Beveridge, Chochrane, Funge-Smith and Poulain2018).
Panulirus homarus (Linnaeus 1758), a tropical spiny lobster, represents one of the high-value fisheries of coastal waters throughout the Indo-West Pacific region (FAO, 2020). Increasing market demand with high pricing, decreasing capture availability due to overexploitation, development of hatchery technology, suitability for captive grow-out, availability of naturally settling seed for on-growing practices, and adaptability to a variety of production systems have led to an emerging interest in the aquaculture practices of this species (Ma et al., Reference Ma, Huang, Chang, Pan, Azra, Chen and Hsu2021). Presently aquaculture practices of this high-valued crustacean are concentrated on fattening practices of wild-caught lobsters in either coastal or marine cages (Albalat et al., Reference Albalat, Johnson, Coates, Dykes, Hitte and Morro2019). In this, water quality parameters, including salinity, are recognized as the most critical influential factors in the intensification of their aquaculture practices (Jones, Reference Jones2009; Priyambodo et al., Reference Priyambodo, Jones and Sammut2020). Even though significant advances have been made in P. homarus research (Soffa et al., Reference Soffa, Handayani, Azra, Firdaus, Pratama, Dharmawati and Sinaga2025; Sun et al., Reference Sun, Lv, Gao, Jia, Liu, Li and Li2025), the effect of salinity shifts on its behaviour and survival is still unexplored. In particular, there is a lack of experimental evidence describing the mortality thresholds, behaviours, and recovery potential of P. homarus under abrupt and gradual hypo and hypersaline conditions commonly encountered in coastal culture systems and estuarine-influenced habitats. Addressing this gap is essential for developing species-specific water quality guidelines and improving husbandry strategies in lobster aquaculture. Accordingly, the present study was done to comprehend the survival and behavioural amplitudes following abrupt and gradual shifts of water salinity in P. homarus. In brief, nonlethal ranges of salinity following both abrupt and gradual shifts were established. Additionally, three easily recordable behavioural attributes were evaluated as an approximation of animals’ potential to deal with the changes in their habitats to check their reliability for assessing the impact of the salinity alterations. We hypothesized that P. homarus would exhibit reduced survival and notable alterations in behavioural responses under abrupt and gradual salinity changes, with greater deviations occurring at salinities far from their normal seawater environment (35‰). Altogether, the study gives insights into the salinity tolerance of P. homarus, a high-value crustacean species, which can be applied to their coastal aquaculture practices.
Materials and methods
Ethical statements
All the experiments involving live animals were carried out following ARRIVE guidelines (Percie du Sert et al., Reference Percie du Sert, Hurst, Ahluwalia, Alam, Avey, Baker, Browne, Clark, Cuthill, Dirnagl and Emerson2020). The procedures involving live fish were performed per the guidelines of EU Directive 2010/63/EU for animal experiments (2019) and the U.K. Animals (Scientific Procedures) Act (1986). The ICAR-CMFRI, Kochi, India, approved the experiments.
Experimental animals
P. homarus animals having an average weight of 220 ± 55.9 g and carapace length (CL) of 45 ± 10 mm, were used in the present study. The animals were caught alive using bottom-set gill nets from the nearshore Arabian Sea region (10°29’23.1″ N, 76°05’07.3″ E), located along the southwest coast of India. Healthy lobsters were selected based on intact morphology and pigmentation and were transported to ICAR (Indian Council of Agricultural Research)-CMFRI (Central Marine Fisheries Research Institute), Kochi, India. The animals were then maintained in FRP (Fibre Reinforced Plastics) tanks of 1000 L capacity (25 animals/tank) with recirculation within the wet laboratory facility of the institute. The animals were maintained under regular photoperiod (12-h Light:12-h Dark) in filtered natural seawater (salinity- 35 ± 1‰, pH- 7.8 ± 0.3, temperature- 28.6 ± 0.43ºC) under continuous aeration. Animals were allowed to acclimatize for one month. During acclimatization, the lobsters were fed ad-libitum with cleaned anchovy fish (Stolephorus commersonnii) once daily during the morning hours. Leftover food, faecal matter, and moult-remains If any, were removed from the tanks regularly. Water quality parameters (ammonia, nitrite, and nitrate levels) were monitored daily to ensure optimal levels by siphoning out the waste materials throughout the experimental period. Hideouts were provided in the acclimatization tanks using cut polyvinyl chloride (PVC) pipes (length: 40 cm; diameter: 12 cm) (Ma et al., Reference Ma, Huang, Chang, Pan, Azra, Chen and Hsu2021).
Experimental design
After the acclimation period, all the animals were again visually inspected to ensure that they were in the intermoult stage, following the recommendations of Vijayakumaran et al. (Reference Vijayakumaran, Anbarasu and Kumar2010). Healthy animals of the intermoult stage were randomly selected for the experiments. Briefly, a total of 272 animals were used in the study. The animals were transferred to rectangular glass tanks of 500 L capacity, facilitated with a re-circulatory system during the experimental period. Dead animals, faecal matter, leftover feed, and moult remains, if any, were removed regularly. All tanks were supplied with continuous aeration throughout the experimental period. Water quality parameters comprising temperature, salinity, and pH of experimental tanks were recorded daily using a thermometer, refractometer (Model: RHS-100ATC, ERMA, Tokyo), and pH meter (Model: HI 5222, Hanna Instruments, Romania, USA), respectively (Table 1). Other water quality parameters comprising dissolved oxygen, ammonia-N, nitrate-N, and nitrite-N were monitored regularly and maintained to the optimal level throughout the experiment by siphoning out the detritus from the bottom of the tank twice daily using a suction-pump and replacing the equal amount of salinity-adjusted water (Table 1).
Water quality parameters recorded during the experimental procedures

* All parameters were expressed as Average values ± SE (standard error of means). Ammonia, nitrite, and nitrate were maintained within the mentioned narrow range across treatments.
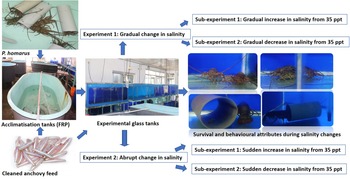
The animals were fed with cleaned anchovy fish once daily at 10% of body weight during morning hours for the entire experimental period. The feeding rate was adjusted daily based on the number of surviving lobsters in each tank. The investigation was conducted as two experiments, with two sub-experiments in each experiment. In experiment I, the animals were exposed to gradual salinity shifts, with sub-experiment I as gradual increments and sub-experiment II as gradual decrements in the salinity. In experiment II, the animals were exposed to abrupt changes in salinity with sub-experiment I as gradual increments and sub-experiment II as gradual decrements in the salinity. Salinity was monitored using a handheld refractometer (Model: RHS-100ATC, ERMA, Tokyo) every hour during the first 5 h of salinity shifts and twice a day thereafter (Nepal and Fabrizio, Reference Nepal and Fabrizio2019). Throughout the experiment, water temperature was 28.6 ± 0.3°C and temperature was monitored twice daily to ensure that it remained constant across all salinity treatments. Temperature was intentionally controlled as a fixed variable to isolate the specific effects of salinity and avoid confounding influences on behavioural and survival responses. All experiments were conducted in quadruplicates to maintain the consistency of results. Animals (N = 16) held in a water salinity of 35‰ served as the control for all the investigations. Thirty-two animals were used in experiment I for gradual exposures to salinity shifts (16 animals in each sub-experiment). The remaining 224 animals were subjected to the experiment II. Of these 112 animals were used in each sub-experiment of the second experiment. An overview of the experiment is represented in the Figure 1.
Overview of the experimental design followed in the study.

Experiment I
Four animals randomly assigned to quadruplicate tanks (Total number = 16) were used in each sub-experiment of the experiment I. In sub-experiment I, salinity was increased stepwise by 3‰ until complete mortality occurred (Nepal and Fabrizio, Reference Nepal and Fabrizio2019). Mortalities were recorded three times daily. Animals were held for seven days at each salinity before transferring to the next salinity. The experimental salinity range was from 8 to 56‰. In sub-experiment 2, a similar experimental design was followed, except animals were exposed to a gradual decrement of 3‰ salinity in each step rather than increments. In both experiments, a 3‰ salinity variation was used in each step to maintain experimental consistency and allow direct comparison of survival and behavioural responses between the two exposure regimes. The salinity variation was achieved by adding either freshwater or evaporated seawater to experimental tanks for decreasing and increasing salinities, respectively (Supriyono et al., Reference Supriyono, Prihardianto and Nirmala2017). Evaporated/high-salinity seawater was prepared by allowing filtered seawater to undergo solar evaporation in open containers under continuous aeration (Supriyono et al., Reference Supriyono, Prihardianto and Nirmala2017).
Experiment II
Each salinity treatment used a distinct set of 16 lobsters (4 per tank) and the treatments (abrupt exposure to salinity shifts) were run in parallel in separate tanks with four tanks per treatment. There were a total of 14 treatments in experiment II (7 higher and 7 lower salinities from the control). Accordingly, 224 randomly selected animals were used in the experiment II. Of these 112 animals were used in each sub-experiment. Each animal was removed from the control tanks (35‰) and transferred to the tanks holding the water with different salinities (14, 17, 20, 23, 26, 29, 32, 38, 41, 44, 47, 50, 53, and 56‰). The animal behaviour and mortality were monitored every 24 h for seven days in each treatment. The manipulation in salinity was done from the control (35‰) with a difference of 3‰ salinity between treatments. For salinity manipulations, natural seawater was diluted with either freshwater or evaporated seawater to make lower and higher salinities, respectively.
Behavioural attributes
Two behavioural attributes, namely, antennule flicking and response time to feeding were recorded along with the survival data. Further, as an indicator for overall feeding efficiency, feed residue was also quantified. All attributes were noted at 24 h intervals for seven consecutive days in each treatment. The readings were visually documented. In detail, strict blinded and standardized protocols were followed to record behavioural attributes, thus minimizing the observer bias in recording the behavioural data. In brief, four observers unknown to the experimental conditions of tanks/animals were used (blinded observation). The observers were randomly changed between tanks to ensure reliability. The observers were trained on recording the required parameters prior to data collection to ensure consistency. Each observer recorded only one behavioural attribute per observation session to prevent multi-tasking errors. Further, all measurements were instructed to be taken at the same period of the day to avoid the probable effects of circadian rhythm on behaviours (Rosas et al., Reference Rosas, Sanchez, Escobar, Soto and Bolongaro-Crevenna1992). Both behavioural observations were monitored quietly and at a fixed distance from the tanks, avoiding any sudden movements or shadows that could potentially disturb the lobsters. Observers were instructed to remain stationary during each recording session to prevent disturbance. It was important to note that the lobsters were acclimatized to routine human presence during the pre-experimental holding period, which helped to reduce disturbance-associated reactions during the trials. The special instructions for recording AFM were as follows; the AFM had to be measured only when the animal was resting to avoid responding to a stimulus other than salinity. The rate of antennule flicking was recorded by counting the movements of each antennule (right and left side) of each animal for 1 min. The average value was calculated to avoid intra-individual variations (Ross and Behringer, Reference Ross and Behringer2019). The AFM measurements were recorded during 14.30–15.30 h every day. For FRT, the animals were simultaneously observed by the four observers. Each observer recorded the behaviour of one of the four animals in the tank after the introduction of the feed. The feed was given once daily at 10% of body weight during morning hours (08.30 AM). The required amount of feed was deposited at one side of the tank away from the animals. The observers were instructed to record the feed response time (FRT) as the time taken (in seconds) to grasp the given feed and transfer to mouth by each animal (Derby and Atema, Reference Derby and Atema1982). For survival, moribund animals were removed from each tank every 24 h, and living ones were counted. Specifically, if an animal could not respond to the external stimuli and feed, exhibited reduced antennule flicking movements or tail fanning, and prolonged flexure posture, the animal was considered moribund. Moribund animals were immediately removed from the tank and euthanized by immersion in an ice slurry as recommended by Blessing et al. (Reference Blessing, Marshall and Balcombe2010). The percentage survival was calculated for each group every 24 h for seven days (Felten et al., Reference Felten, Charmantier, Mons, Geffard, Rousselle, Coquery, Garric and Geffard2008).
Statistical analysis
Descriptive statistics were calculated for all the quantitative variables in control conditions. Kaplan–Meier survival analysis was conducted to compare the survival % of lobsters, where the differences in survival among different experimental groups were enumerated using the log-rank test using IBM SPSS Statistics Version 16. To establish whether the survival distributions are statistically different, the χ2-statistic, which is calculated by the log-rank test, is compared to a χ2-distribution that has two degrees of freedom. The percentage of animals that died at each salinity was also modelled with a probit regression to estimate the lethal doses causing 30, 50, 75, and 90% mortality (LD30, LD50, LD75, and LD90) at 95% confidence limits. The coefficient of variation (CV) for AFM and FRT was calculated to check the relative dispersion of the data in the control conditions. The statistically significant differences induced by the individual animal and observation day on AFM and FRT in control conditions were assessed with two-way permutational multivariate analysis of variance (PERMANOVAs) (permutations = 9999) using PAST 3.26 software (Hammer et al. Reference Hammer, Harper and Ryan2001). The data on behavioural responses in each experiment were analysed to assess the effects of salinity and exposure duration on different behavioural attributes of the experimental animals. Briefly, two behavioural attributes viz., AFM and FRT, recorded under both experimental conditions, gradual and abrupt salinity shifts, were analysed using the Mixed Model procedure (PROC MIXED) in SAS (Version 9.4, SAS Institute Inc., Cary, NC, USA) to account for both fixed and random effects. Further, behavioural response analyses were limited to salinity treatments where animals survived and exhibited quantifiable activities. In the model, salinity and time were treated as fixed effects, while tank (nested within salinity) was included as a random effect to account for potential non-independence among observations within tanks. The Shapiro–Wilk and Levene tests, respectively, were used to determine the normality and homogeneity of variance. Repeated measures over time were modelled using a compound symmetry (CS) covariance structure to represent correlations among repeated observations from the same experimental unit. The Kenward–Roger approximation was applied to adjust the denominator degrees of freedom, ensuring robust estimation of fixed effects, particularly with relatively small or unbalanced sample sizes. To assess differences among treatment means, least square means (LSMEANS) were computed for the main and interaction effects. Prior to analysis, the data were square root transformed to stabilise variance and meet the assumptions of normality required for ANOVA. The Tukey–Kramer multiple comparison test was employed for pairwise comparison among the main effects and interaction effects to accommodate unequal sample sizes among treatments. Statistical significance was assessed at p < 0.05.
Results
Water quality parameters recorded during the experimental procedures are depicted in Table 1. All water quality parameters except salinity and pH did not vary significantly from control tanks during the entire experimental period, and there was no significant change (p > 0.05) in pH from control conditions between 29 and 41‰ salinity (Table 1).
Response in the control conditions
There were no mortalities in the control group throughout the experimental period. The average AFM in control groups was 41.04 ± 9.25 per min (Table 2). The average FRT of animals in control was observed to be 15.93 ± 4.6 sec. Two-way PERMANOVA showed no significant effects for the day of observation (p = 0.06) and individuals (p = 0.21) on AFM. Similarly, there was no significant effect for the day of observation (p = 0.08) and individuals (p = 0.56) on FRT. There was no feed residue in the control tanks after 3 h of feeding when the lobsters were fed @ 10% body weight during the entire experimental period. The CV% for AFM and FRT was calculated as 22.97 and 28.74%, respectively. As there was no variability in survival % and CV% was not calculated and was logically graded as consistent in control conditions.
Summary statistics of the quantitative behavioural attributes during control conditions

Abbreviations: AFM: Antennule flicking of each animal per minute; FRT: Feed response time FR%: Feed residue%; SD: Standard deviation; CV: Coefficient of variation.
Survival in gradual salinity shifts
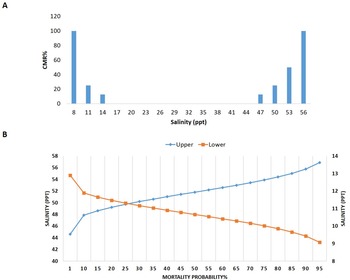
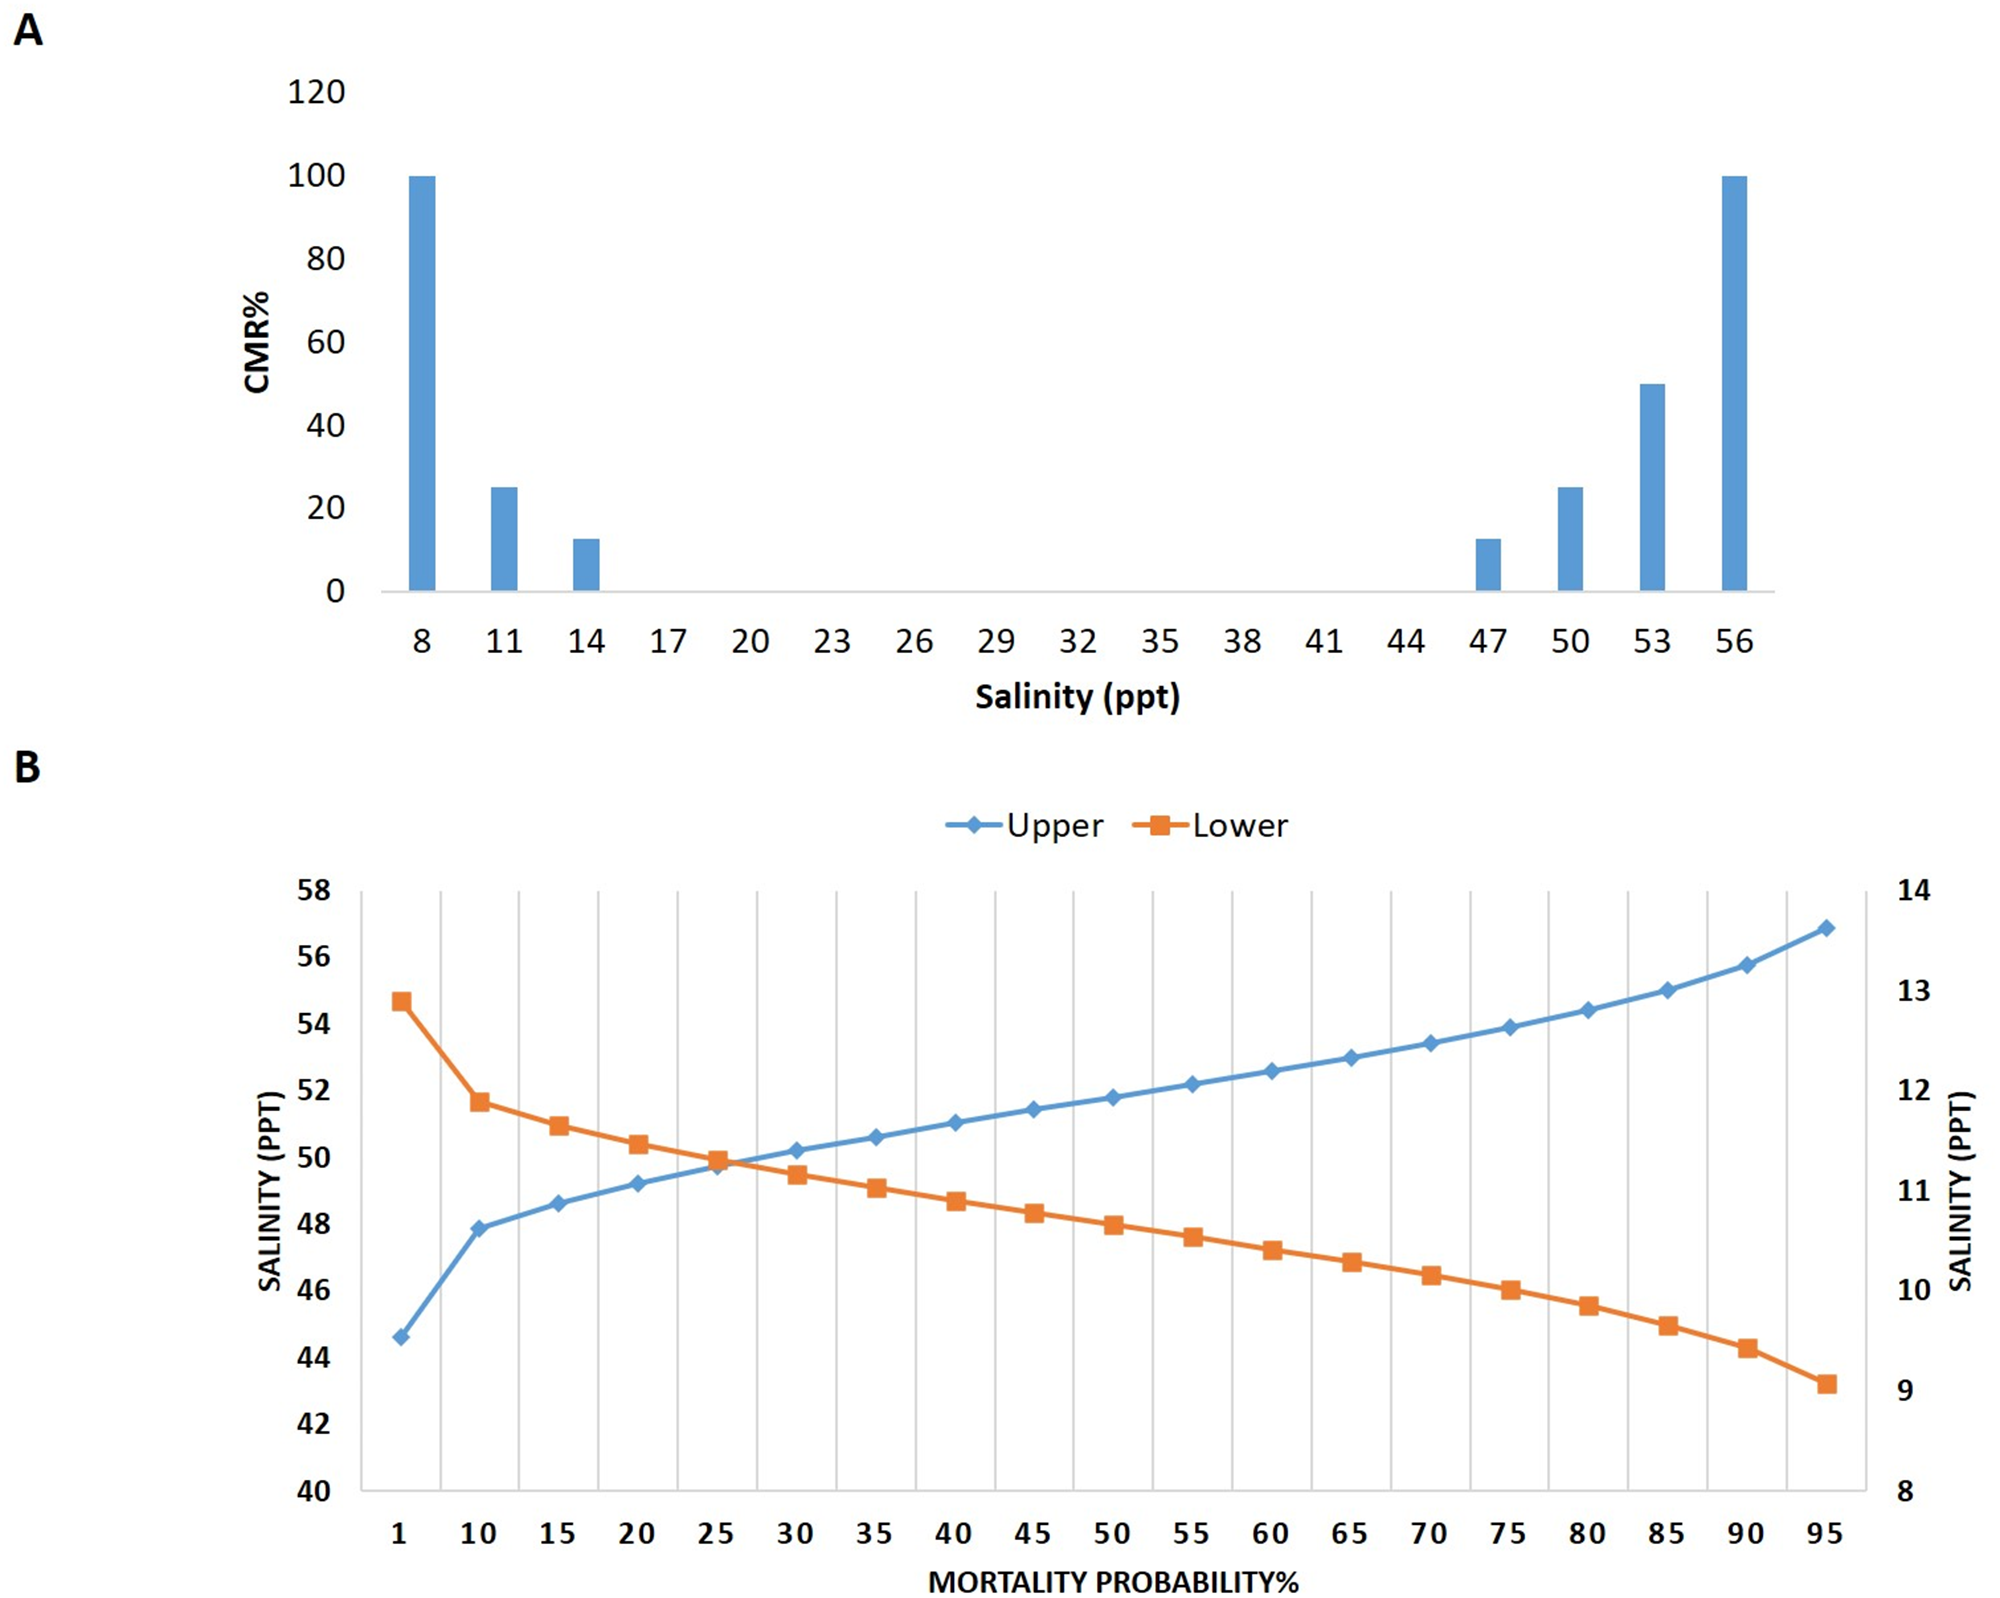
The cumulative survival % in varying salinity following gradual shifts is depicted in Figure 2a. Overall 32 animals died in the experiment-I. During sub-experiment I, there was a mortality of 2, 2, 4, and 8 animals in 47, 50, 53, and 56‰, respectively. In sub-experiment II, there was a mortality of 2, 4, and 10 animals in 14, 11, and 8‰, respectively. Overall, there was a significant difference in survival % between different salinities both after a gradual increase and decrease (log-rank; χ2 = 44.28 and 116.07, p < 0.0001) from the control conditions. There was a 100% survival between 17 and 44‰. The 100% lethal levels of salinity viz., 56 and 8‰ induced mortality within 4 ± 1.15 and 1.8 ± 0.84 days of exposure, respectively. The lethal doses (LD) causing 30, 50, 75, and 90% of mortality were estimated at 50.19, 51.81, 53.88, and 55.77‰, respectively, following a gradual increase in the water salinity based on the probit analysis. Similarly, the LD causing 30, 50, 75, and 90% of mortality were estimated at 11.16, 10.66, 10.01, and 9.43‰, respectively, following the gradual decrease in the water salinity (Figure 2b).
Determination of lethal doses of gradual salinity shifts in P. homarus. A: Cumulative mortality percentage; B: Probability of cumulative mortality. Salinity values during gradual increase are depicted on the right-side Y-axis, while values during gradual decrease are depicted on the left-side Y-axis. Each treatment consisted of four animals in quadruplicate tanks (Total number = 16). Animals were exposed to gradual change of 3‰ salinity from the control (35‰) at a time until 100% lethality was observed. Survival was recorded thrice daily for seven days after exposure to each salinity.
Survival in abrupt exposure to salinity changes
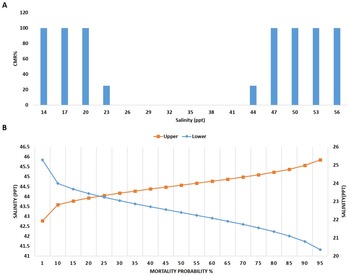
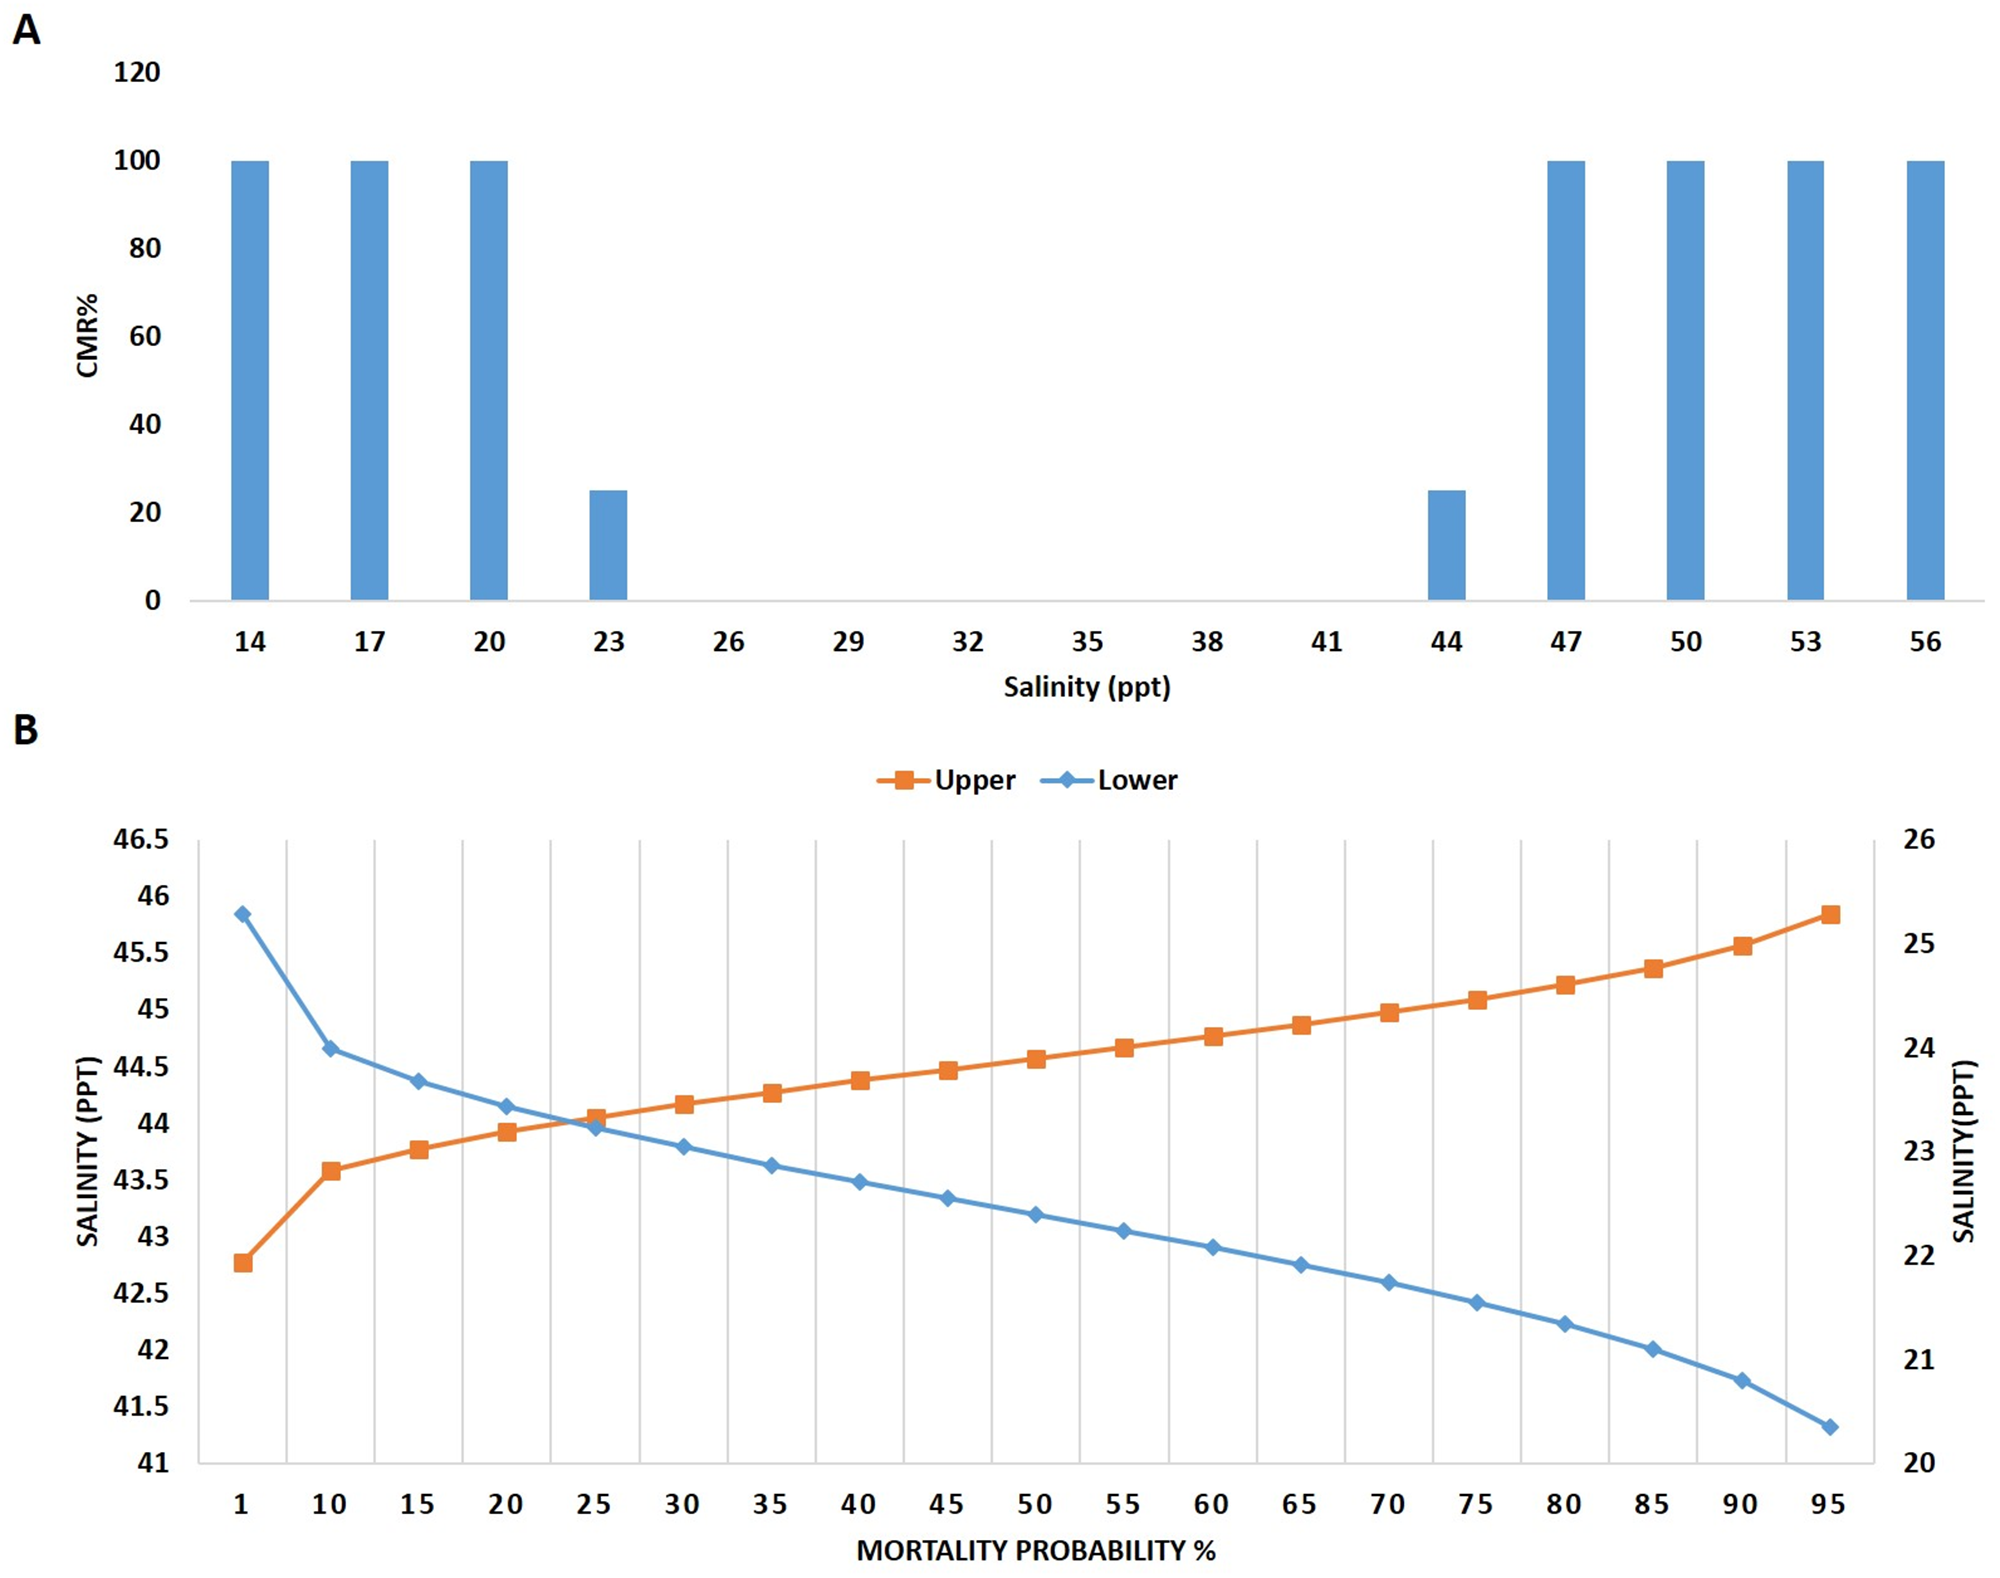
The cumulative survival % after abrupt exposure to salinity shifts is represented in Figure 3a. Out of 224 animals subjected to experiment II, 120 animals died. In detail, during sub-experiment I, there was a mortality of 68 animals (4, 16, 16, 16, and 16 animals in 44, 47, 50, 53, and 56‰, respectively). In sub-experiment II, there was a mortality of 52 animals (4, 16, 16, and 16 animals in 23, 20, 17, and 14‰, respectively). Overall, sudden exposure to lowered and increased salinity regimes had a significant effect on the survival of P. homarus with log ranks as χ2 = 82.97 and 81.64 (p < 0.0001) respectively. The mortality did not occur between 26 and 41‰ salinity, and beyond this range, there was rapid mortality. The probit analysis showed that LDs causing 30, 50, 75, and 90% of mortality as 44.16, 44.57, 44.98, and 45.56‰, respectively, following the abrupt increase (Figure 3b). Similarly, the LDs causing 30, 50, 75, and 90% of mortality were estimated at 23.04, 22.39, 21.51, and 20.79‰, respectively, following abrupt decrease in the water salinity (Figure 3b). In the abrupt salinity reduction trials, 100% mortality was first observed at 20‰. Likewise, in the abrupt salinity increase trials, 100% mortality was first recorded at 47‰. Remarkably, the progression of mortality differed significantly (p = 0.02) between 20 and 47‰ salinities, with faster mortality at 20 than 47‰ (Figure 6).
Determination of lethal doses of abrupt salinity shifts in P. homarus. A: Cumulative mortality percentage; B: Probability of cumulative mortality. Salinity values during abrupt increase are depicted on right-side Y-axis, while values during abrupt decrease are depicted on left-side Y-axis. Each salinity treatment used a distinct set of 16 lobsters (4 per tank). There was a total of 14 treatments (7 higher and 7 lower salinities from the control, 35‰). Survival was recorded every 24 h for seven days in each treatment.
Behavioural attributes during gradual exposure to salinity shifts
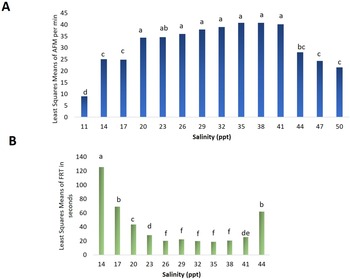
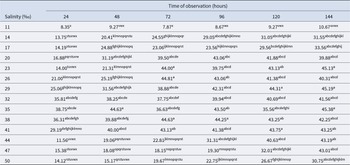
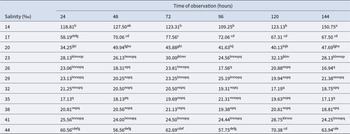
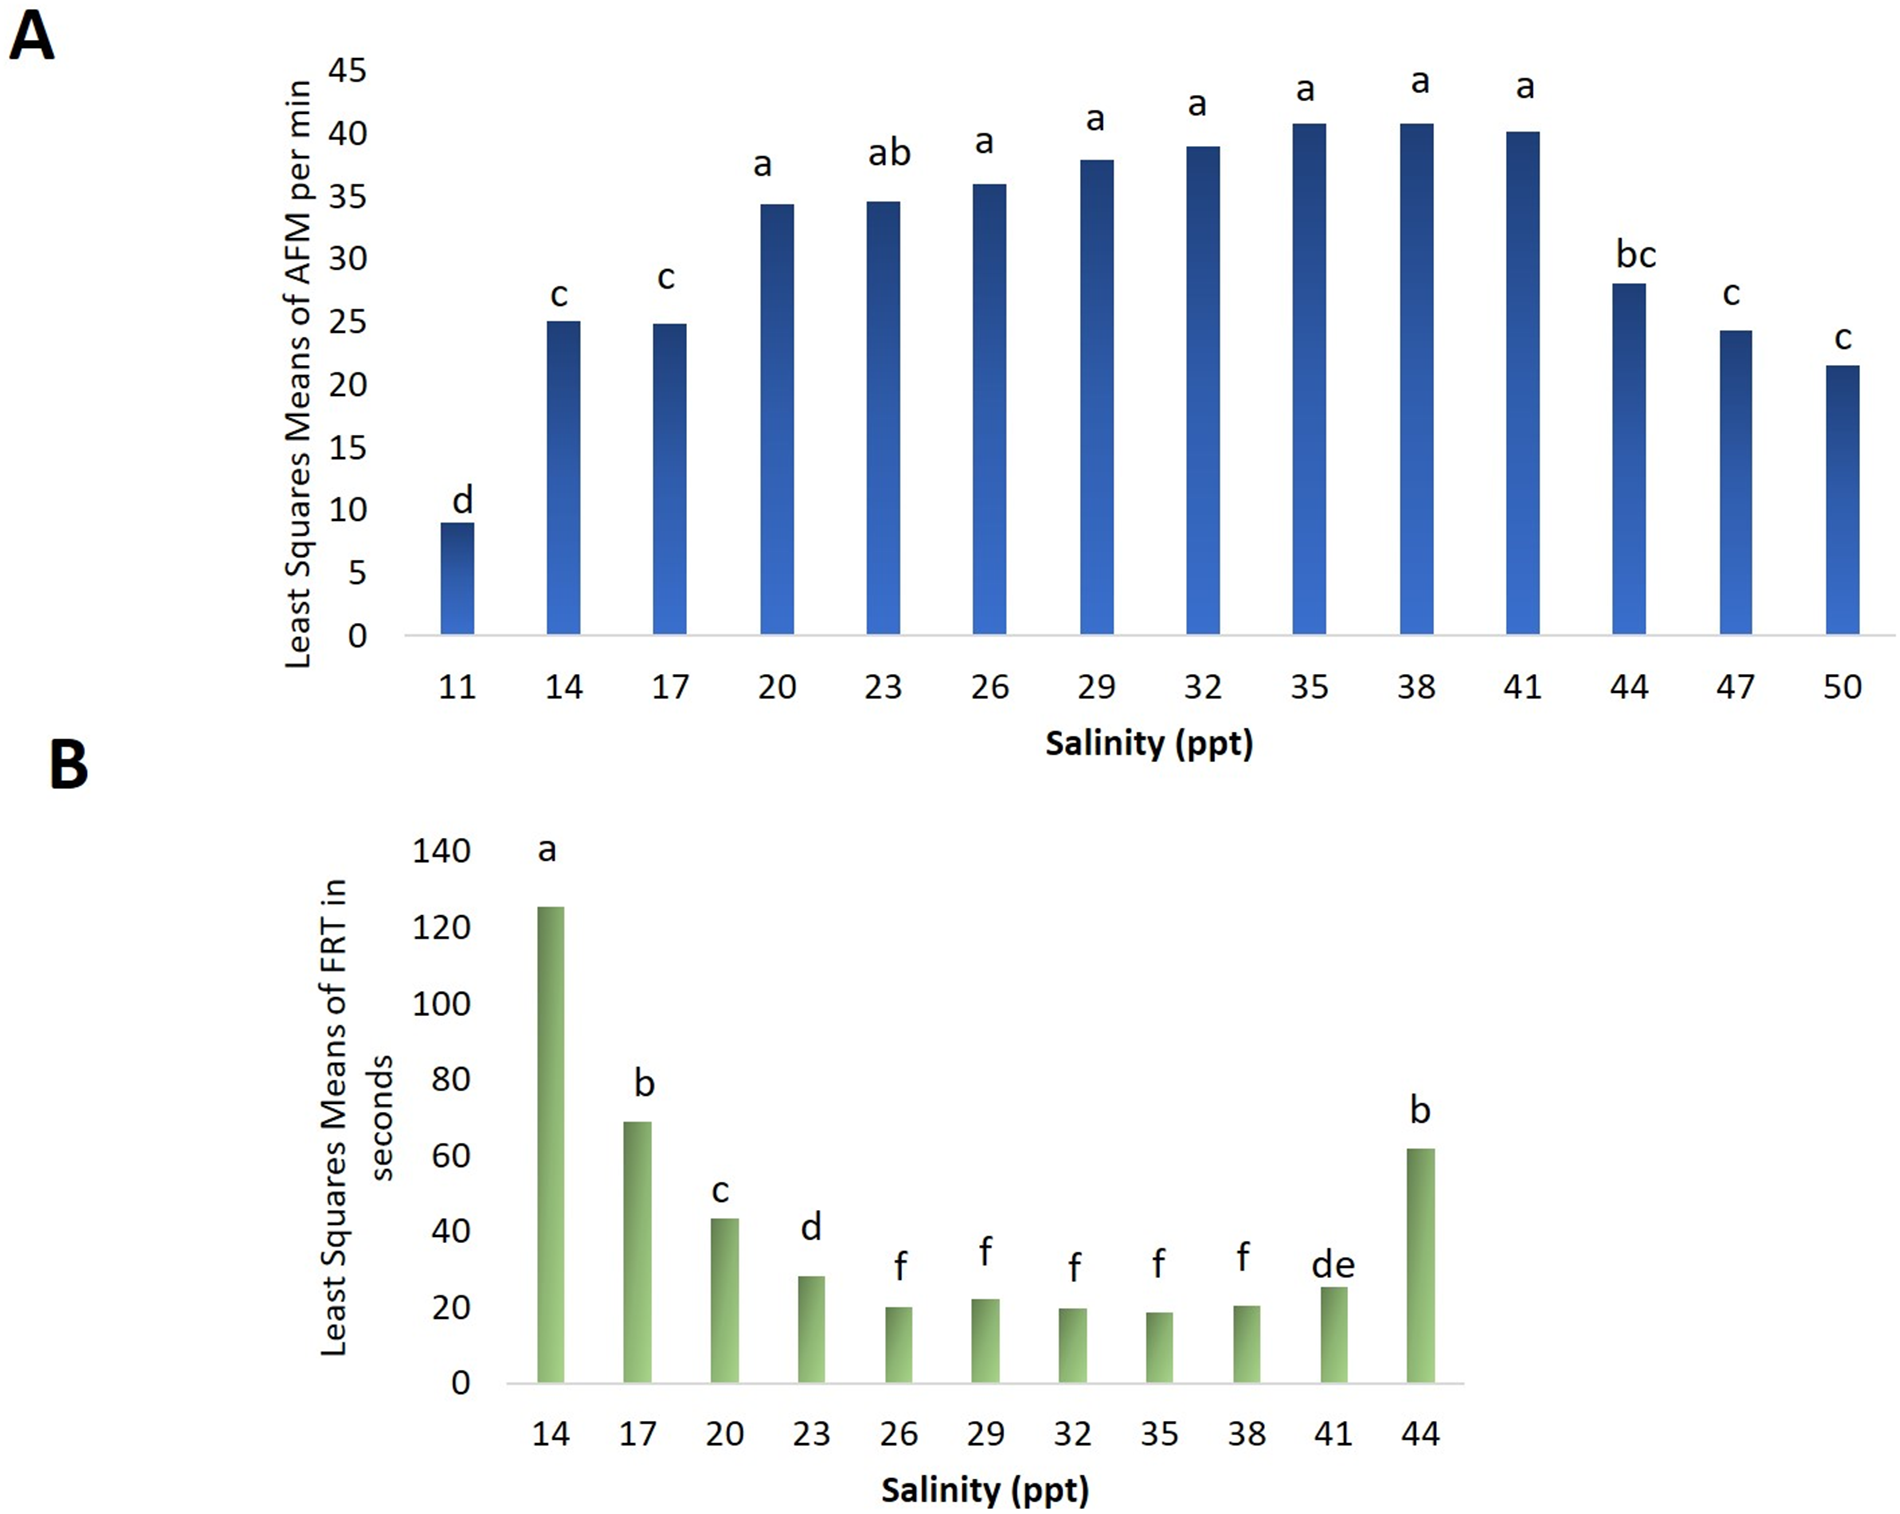
The sudden increase in AFM was the first visible reaction to gradual salinity shifts; however, it was settled after 1–2 h. Due to high mortality at salinities above 50‰ resulting in insufficient replication, AFM analysis was restricted to salinity treatments ≤ 50‰. Consequently, AFM data for 53 and 56‰ were not included. Two-way ANOVA, performed showed a significant influence of salinity (F13, 42.1 = 46.15, p < 0.0001) and time (F5, 1141 = 236.89, p < 0.0001), as well as the interaction effects between salinity and time of observation (F65, 1141 = 11.14, p < 0.0001). Variation attributable to differences between tanks was relatively small (Tank-salinity variance = 0.06) compared to the residual variance (0.35), indicating that responses were largely consistent across tanks. Post hoc analysis showed significant differences between extreme salinity groups (<20‰ and >41‰) and compared to mid-range levels (20–41‰), indicating sensitivity to both hypo- and hyper-saline conditions (Figure 4A). The AFM was significantly reduced beyond this range. The comparison of the least square mean values for the salinity-observation time interactions is given in Table 3. Concerning FRT, the two-way ANOVA showed a significant influence of salinity (F10, 33 = 586.37, p < 0.0001) and time (F5, 957 = 3.44, p = 0.004), as well as the interaction effects between salinity and time of observation (F50, 957 = 3.44, p < 0.0001). Variation attributable to differences between tanks was relatively small (Tank-salinity variance = 0.013) compared to the residual variance (0.48), indicating a low tank-to-tank variation. Post hoc analysis revealed a longer FRT from control conditions beyond 26 to 38‰ salinity levels showing decreased feed responsiveness in both hypo- and hyper-saline conditions (Figure 4C). There was a slight increase in responsiveness/ decreased FRT over the 7-day observation period within each salinity (Table 4). There was a complete loss of feed intake/anorexia at salinities >44‰ and <14‰. The comparison of the least square mean values for the salinity-time of observation interactions is given in Table 4.
Behavioral attributes during gradual salinity shifts in P. Homarush. A: Antennule flicking movements; B: Feed response time. Behavioural response analyses were limited to salinity treatments where animals survived and exhibited quantifiable activities. Two-way ANOVA under a mixed effects model set up was performed to assess the significant difference among various salinities and time of observation and their interactions in AFM and FRT, and Tukey-Kramer multiple comparison test was followed. Prior to analysis, the data were square root transformed to stabilise variance and meet the assumptions of normality required for ANOVA. All attributes were noted every 24 h intervals for seven consecutive days in each treatment. Each value represents least square mean values. Least square means with the same superscript letter are not significantly different at p ≤ 0.05.
Interaction effects of salinity and time of observation on the antennule flicking movements of P. homarus during gradual salinity shifts
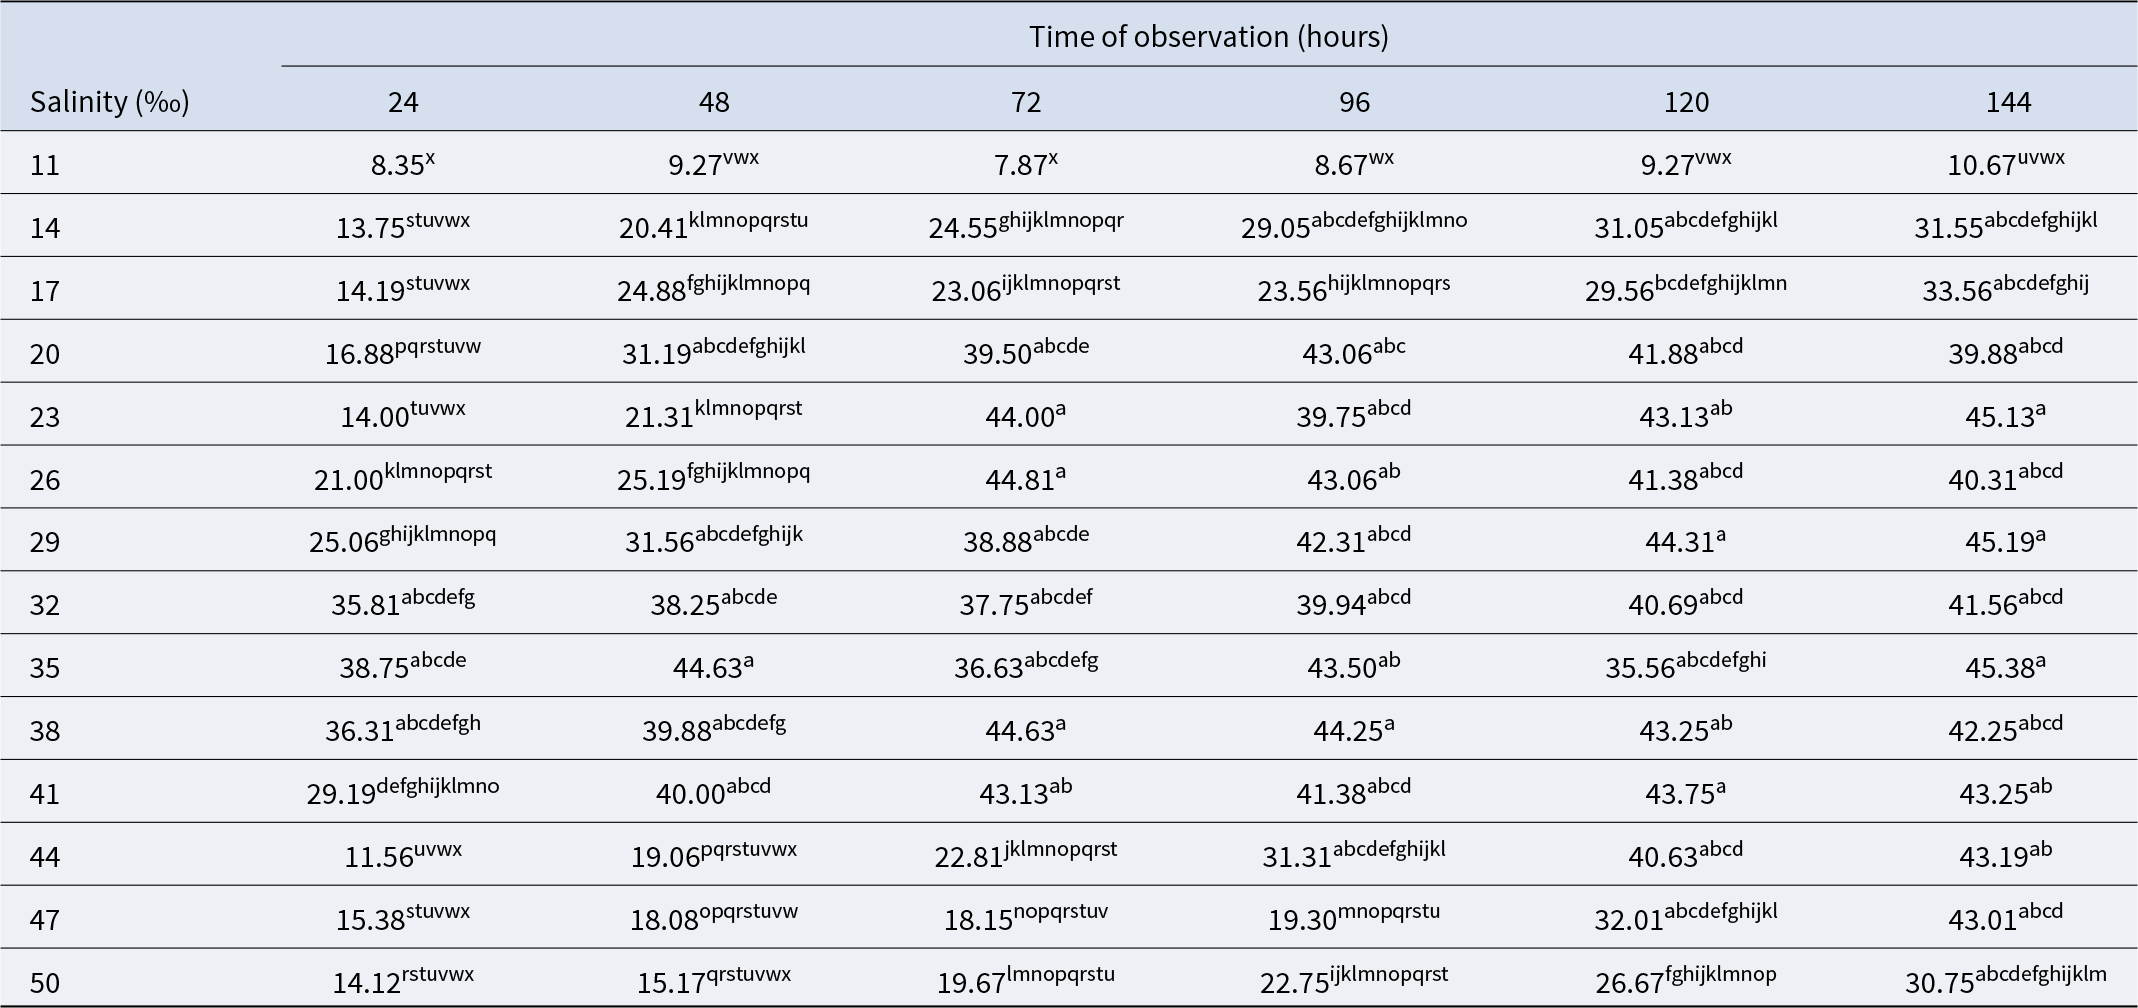
Two-way ANOVA under a mixed effects model set up was performed to assess the significant difference among various salinities and time of observation and their interactions, and Tukey–Kramer multiple comparison test was followed. Prior to analysis, the data were square root transformed to stabilise variance and meet the assumptions of normality required for ANOVA. Each value represents least square mean values. Least square means with the same superscript letter are not significantly different at p ≤ 0.05.
Interaction effects of salinity and time of observation on the feed response time of P. homarus during gradual salinity shifts
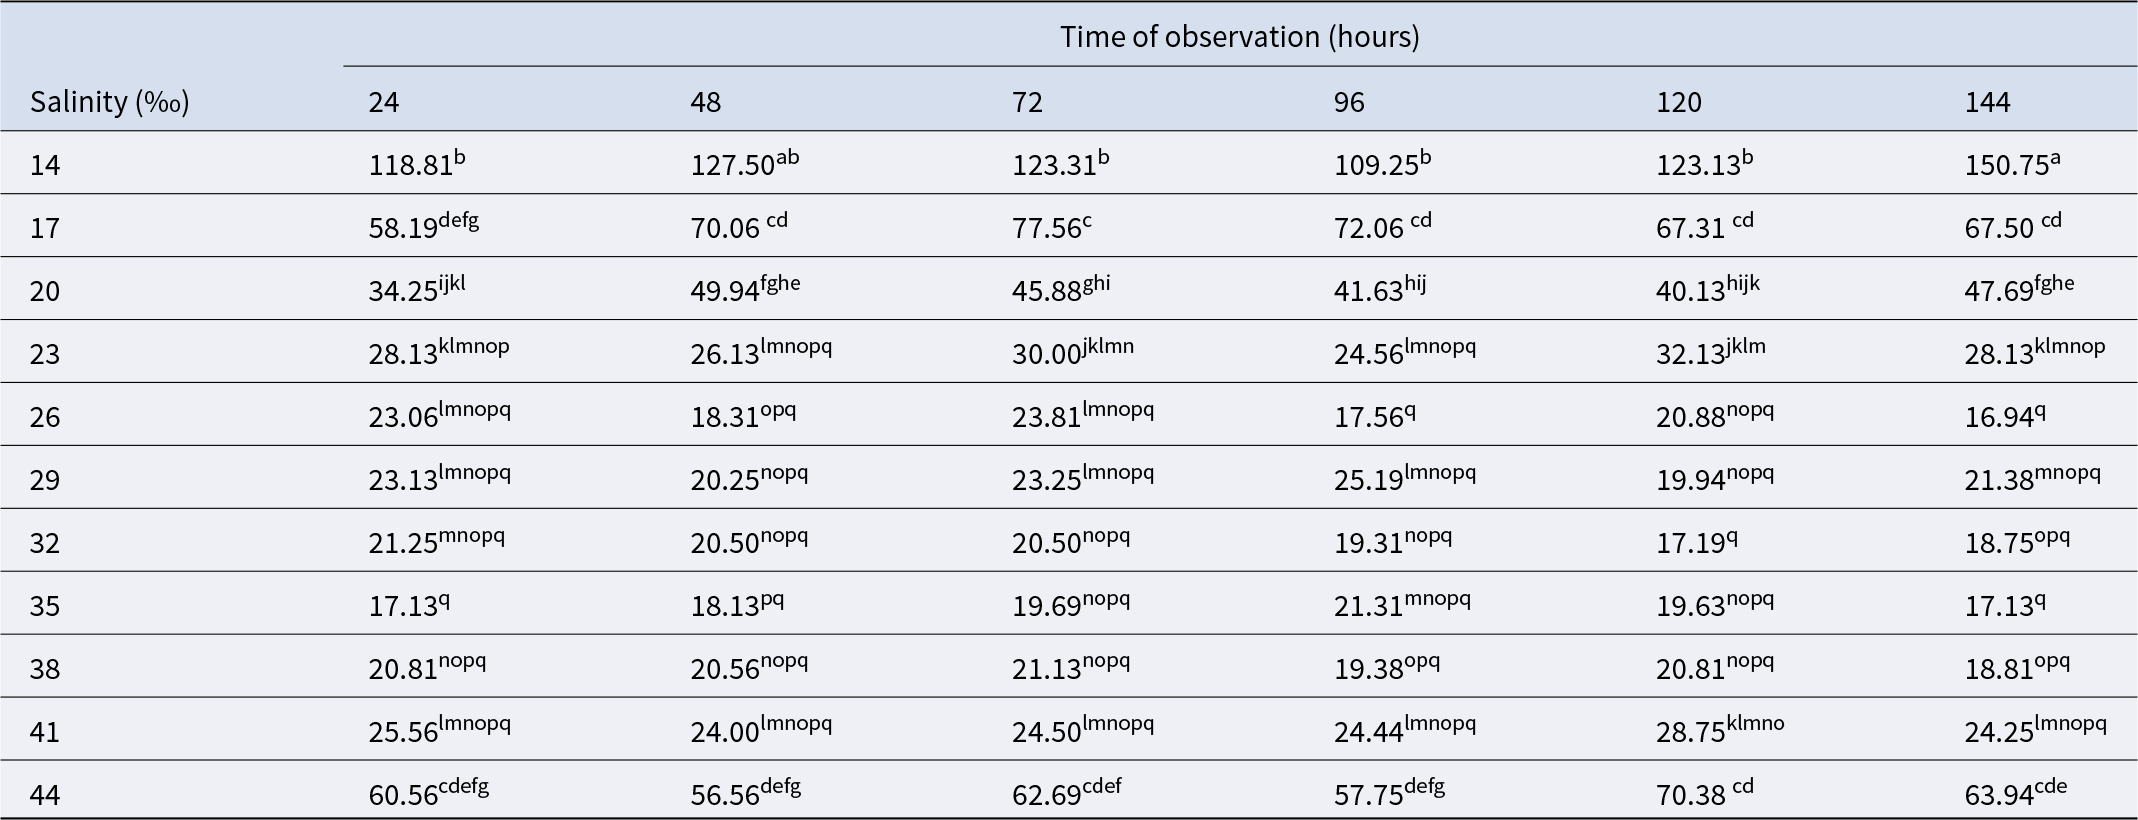
Two-way ANOVA under a mixed effects model set up was performed to assess the significant difference among various salinities and time of observation and their interactions, and Tukey–Kramer multiple comparison test was followed. Prior to analysis, the data were square root transformed to stabilise variance and meet the assumptions of normality required for ANOVA. Each value represents least square mean values. Least square means with the same superscript letter are not significantly different at p ≤ 0.05.
Behavioural attributes following abrupt exposure
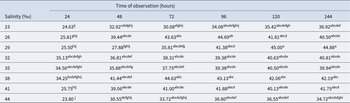
The first visible reaction of sudden exposure to salinity shift was the sudden increase in AF activity. Due to high mortality at salinities >44‰ and <23‰ resulting in insufficient replication, AFM analysis was restricted to salinity treatments within these values. Two-way ANOVA, performed showed a significant influence of salinity (F7, 23.1 = 6.31, p = 0.0003) and time (F5, 653 = 63.84, p < 0.0001), as well as the interaction effects between salinity and time of observation (F35, 653 = 3.23, p < 0.0001). Variation attributable to differences between tanks was relatively small (Tank (Salinity) variance = 0.02) compared to the residual variance (0.31), indicating that responses were largely consistent across tanks. Briefly, the AFM was comparable to that of the control within 26–41‰ (Figure 5A). AFM was significantly decreased beyond this range. Another important observation was the AFM returned to the control level at 29 and 44‰ within seven days of observation. Further details on the comparison of the least square mean values for the interactions are given in Table 5. Concerning FRT, two-way ANOVA, performed showed a significant influence of salinity (F7, 23.9= 3939.55, p < 0.0001), while time (p = 0.3) and the interaction effects (p = 0.9) had no significant influence. Variation attributable to differences between tanks was relatively small (Tank (Salinity) variance = 0.000022) compared to the residual variance (0.1430), indicating a low tank-to-tank variation. Post hoc analysis revealed a longer FRT from control conditions (35‰) in all salinities (Figure 5). The animals became completely anorectic at salinities >44‰ and <23‰. A summary of observations on salinity ranges of P. homarus under gradual and abrupt salinity shifts is depicted in Table 6.
Behavioural attributes during abrupt salinity shifts in P. homarus. A: Antennule flicking movements in different salinities; B: Feed response time. Behavioural response analyses were limited to salinity treatments where animals survived and exhibited quantifiable activities. Two-way ANOVA was performed to assess the significant difference among various salinities and time of observation and their interactions in AFM and FRT, and Tukey’s HSD was done for multiple comparisons. Prior to analysis, the data were square root transformed to stabilise variance and meet the assumptions of normality required for ANOVA. All attributes were noted every 24 h intervals for seven consecutive days in each treatment. Each value represents least square mean values. Least square means with the same superscript letter are not significantly different at p ≤ 0.05.

Days for the induction of mortality in P. homarus following abrupt salinity shift experiments. Each salinity treatment used a distinct set of 16 lobsters (4 per tank). There was a total of 14 treatments (7 higher and 7 lower salinities from the control, 35‰). Mortality was recorded every 24 h for seven days in each treatment. One-way ANOVA was performed to assess the significant difference among various salinities and Tukey’s HSD was done for multiple comparisons. Prior to analysis, the data were square root transformed. Each value represents the average values. Values with the same superscript letter are not significantly different at p ≤ 0.05.

Interaction effects of salinity and time of observation on the antennae flicking movements of P. Homarush during abrupt salinity shifts
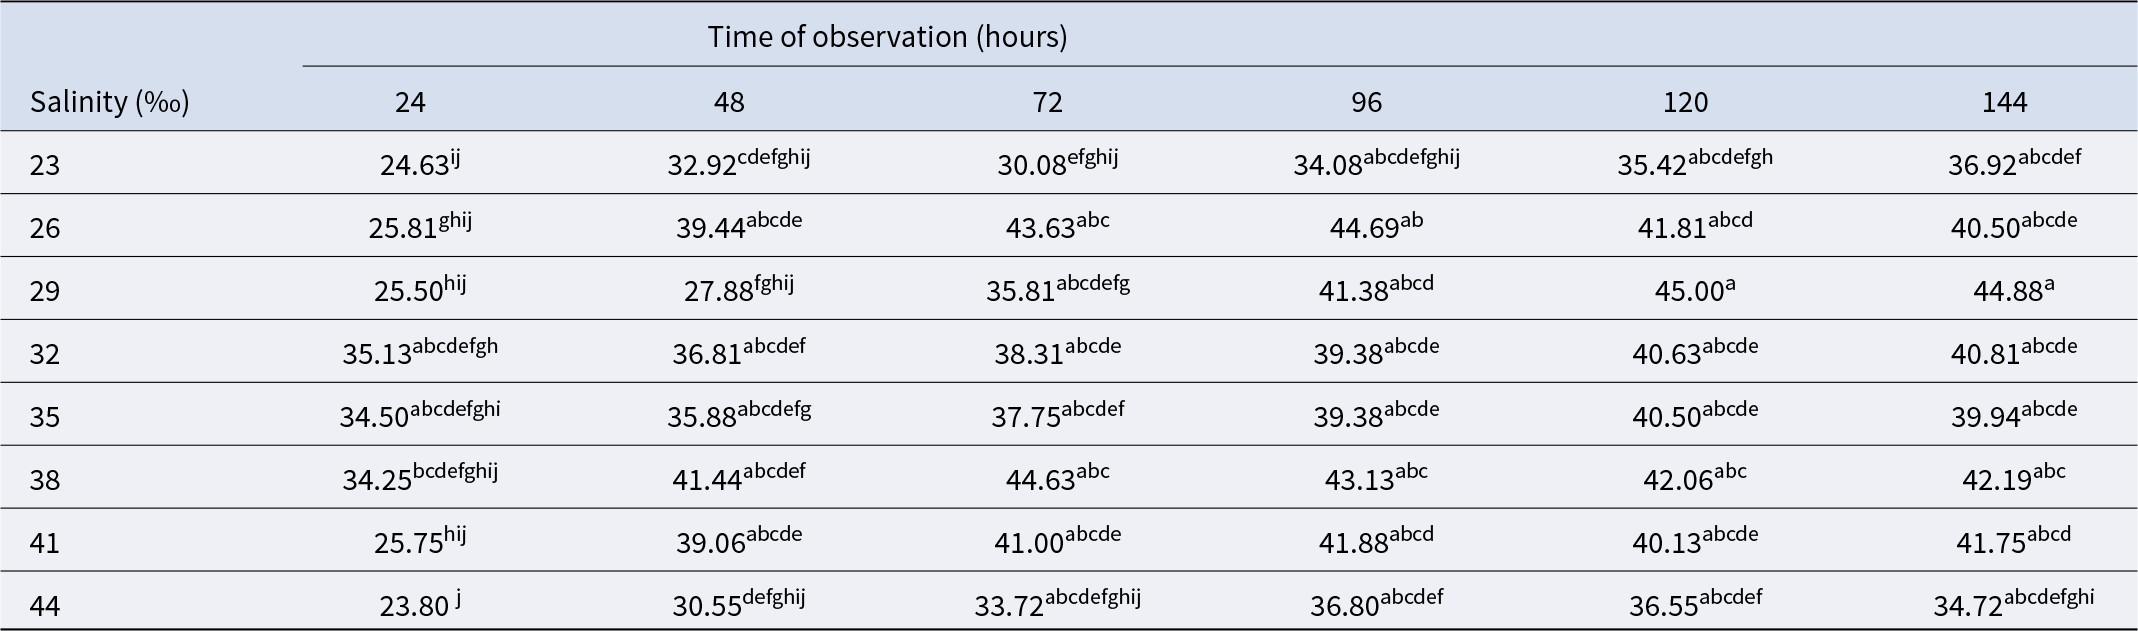
Two-way ANOVA under a mixed effects model set up was performed to assess the significant difference among various salinities and time of observation and their interactions, and Tukey–Kramer multiple comparison test was followed. Prior to analysis, the data were square root transformed to stabilise variance and meet the assumptions of normality required for ANOVA. Each value represents least square mean values. Least square means with the same superscript letter are not significantly different at p ≤ 0.05.
Summary of observations on P. homarus under gradual and abrupt salinity shifts

Discussion
The scientific data on the influences of salinity shifts on the survival and behavioural attributes of marine animals helps to identify the potential of each animal to deal with the changes in their niche (Ross and Behringer, Reference Ross and Behringer2019). In light of the current climate change scenario, the data can be used for selecting appropriate aquaculture candidate species and suitable commercial cultivation sites, and for devising conservation initiatives (Ross and Behringer, Reference Ross and Behringer2019). The data on the survival and threshold ranges of salinity and three visually monitorable behavioural attributes were established in the present study following abrupt and gradual salinity shifts in one of the potential coastal aquaculture candidate species, viz. P. homarus (FAO, 2020) as an approximation of animals’ potential to deal with the changes in their habitats. The study was conducted as indoor experiments in glass tanks to improve the visibility of behavioural responses (Woodin et al., Reference Woodin, Wethey, Olabarria, Vázquez, Domínguez, Macho and Peteiro2020). It is important to note that laboratory studies cannot reproduce the full range of physical and biological factors driving animals’ behaviour, as they exist in a natural ecosystem. Nevertheless, indoor experiments have demonstrated the ability to point out the significant, easily monitorable behavioural changes to a single factor because of the possibility of controlling external confounding factors (Woodin et al., Reference Woodin, Wethey, Olabarria, Vázquez, Domínguez, Macho and Peteiro2020). The optimal water salinity (35‰) reported for the performance of P. homarus (Vidya and Joseph, Reference Vidya and Joseph2012) was chosen as the control condition. The survival rate in the control salinity throughout the experimental period was 100%, similar to earlier observation (Rathinam et al., Reference Rathinam, Kandasamy, Kizhakudan, Leslie and Gandhi2009). The average AFM recorded in control groups was comparable to that reported in the spiny lobster, Panulirus argus (Ross and Behringer, Reference Ross and Behringer2019). There is no available data on normal feed response time (FRT) in spiny lobsters for comparison, even though the information is important in optimizing the formulated diet palatability and feed delivery strategies in lobsters (Simon Reference Simon and James2009). The coefficient of variation (CV), the preferred statistic for measuring reliability (Reed et al. Reference Reed, Lynn and Meade2002), was estimated for AFM and FRT as <30%, indicating that AFM and FRT could be reliable indicators in the control conditions (Brock et al., Reference Brock, Thomazeau, Watanabe, Li and Sjöström2020). Interestingly, two-way PERMANOVA showed no significant diurnal and individual effect in AFM and FRT, aligning with the observation of Ross and Behringer (Reference Ross and Behringer2019) on Caribbean spiny lobsters. Both attributes, AFM and FRT, were graded as reliable indicators (CV% within the acceptable range), and their levels in the control conditions were considered the basal levels for P. homarus in the subsequent analyses.
The lobsters inhabit estuarine and coastal habitats, where storms and land run-off can cause either abrupt or gradual shifts in water salinity (Charmantier et al., Reference Charmantier, Haond, Lignot and Charmantier-Daures2001). In this regard, there were two experiments for gradual (experiment I) and abrupt (experiment II) shifts of water salinity. In both experiments, intermoult stage animals were randomly selected to avoid the moulting stage, a naturally stressful period for the animals (Tavares et al., Reference Tavares, Silva, Pereira and Ostrensky2021). All water quality parameters except pH and salinity did not vary significantly throughout the experimental period. There were significant variations in pH at salinity above 41‰ and below 26‰; however, the observed pH ranges were within the normal ranges for lobster aquaculture practices (Wickins and Lee, Reference Wickins and Lee2002).
The survival data showed that higher and lower salinity regimes from the control salinity (35‰) had a significant effect on the survival of P. homarus in both gradual and abrupt shifts. Further, the analysis showed that lethal salinity concentrations differed for gradual and abrupt shifts, with a broader range of salinity tolerance in gradual exposure. In consonance with our results on LC50 values of salinity in P. homarus, Akther et al. (Reference Akther, Mollah and Kadir2009) showed that lethal doses of salinity differed between gradual and abrupt exposures within a species, and gradual exposures could broaden the salinity tolerance ranges of silver barb (Barbodes gonionotus). The lower lethal limit recorded for adult American lobster, Homarus americanus (McLeese, Reference McLeese1956) (between 8 and 14‰) after gradual exposures supported our findings. The present research showed that 100% of P. homarus in the present study could tolerate 10‰ for two days following the gradual shifts similar to the observation of Jury et al. (Reference Jury, Kinnison, Howell and Watson1994) on H. americanus. Strikingly, the occurrence of mortality was more rapid in the lower LC100 salinity (14‰) than in the upper LC100 salinity (47‰). Spencer et al. (Reference Spencer, Fitzgibbon, Day, Trotter and Smith2025) found that the optimal salinity for juvenile P. ornatus ranges between 25 and 34‰, whereas high salinity (40‰) caused significant physiological stress and 80% mortality on gradual exposures. In our study, even though there was physiological stress (indicated by AFM and feeding behaviour) for P. homarus at ≥38‰, mortality started only at 47‰. Similarly, Spencer et al. (Reference Spencer, Fitzgibbon, Day, Trotter and Smith2023) demonstrated that the lower and higher LC50 values of Panulirus ornatus intermoult stages when acutely exposed to different salinities for 48 h were 15 and 52.5‰. Whereas the corresponding values of P. homarus intermoult stages were 22.4 and 44.5‰ during acute exposure to different salinities. There was 90 to 100% survival for P. homarus between 12 and 47‰ salinity. The capacity of P. homarus to tolerate a comprehensive salinity range enables it to thrive in an environment where many other marine species might suffer harmful effects. From aquaculture and climate change perspectives, this provides the species with expanded opportunities, especially for coastal aquaculture practices, and the results have to be verified by future field trials. The lobsters were usually considered osmoconformers that adapt slowly to the changing ionic concentrations in surrounding waters (Dall, Reference Dall1970). This hypothesis was supported by the broader range of salinity in which the animals survived in gradual rather than abrupt shifts. Mortality did not occur between 17 and 44‰ and between 26 and 41‰ following gradual and abrupt salinity shifts. Further, the results showed that the animals showed comparable survival rates at higher salinities in both abrupt and gradual exposures. At the same time, there was a broader difference in lower threshold salinity levels. In other words, after gradual shifts, the animals showed significantly better survival at lower salinity.
Behavioural responses of organisms and their alterations can be easily applied to predict the changes in their ecosystem (Woodin et al., Reference Woodin, Volkenborn, Pilditch, Lohrer, Wethey, Hewitt and Thrush2016). The behavioural responses of lobsters to a gradual and abrupt salinity change are scarcely studied. In the present study, two behavioural attributes, viz. AFM and FRT under gradual and abrupt salinity shifts were monitored. As the antennule is one of the demonstrated sites for osmoreception, the AFM rate has been used by researchers to conclude chemosensory ability of many decapod crustaceans (Goldman and Koehl, Reference Goldman and Koehl2001; Ross and Behringer, Reference Ross and Behringer2019). Further, the AFM response under salinity changes for crustaceans was attributed as one of the chemosensory-driven feedback mechanisms in coordination with other receptor sites (Goldman and Koehl, Reference Goldman and Koehl2001; Reidenbach et al., Reference Reidenbach, George and Koehl2008; Kim et al., Reference Kim, Taylor, Lovera and Barry2016). In the present research, the sudden increase in AFM was the first visible reaction of gradual/ abrupt salinity shifts. The triggered response aroused in lobsters even during relatively small shifts in water salinity (Dufort et al., Reference Dufort, Jury, Newcomb, O’Grady and Watson2001) might be the reason for the immediate increase in AFM.
During the acute salinity shift, even though AFM was significantly reduced during the initial days of observation, it slowly returned at 29 and 44‰. In parallel to our observations, Atema et al. (Reference Atema, Leavitt, Barshaw and Cuomo1982) reported the regaining of chemoreception in the lobster (Homarus americanus) following the salinity shift. Further, beyond the 26–41‰ salinity range, reduction or increment of salinity caused a permanent decrease in AFM. The comparison with the previous reports is limited due to the scarcity of data on similar or related species. However, the reduction in AFM beyond the tolerating ranges of salinity exposures was reported in other crustaceans (Behringer and Butler, Reference Behringer and Butler2010; Ross and Behringer, Reference Ross and Behringer2019). Further, inactivation of the chemoreceptor responses was reported in different marine crustaceans on exposure to altered salinity in consonance with our results (Kraus-Epley et al., Reference Kraus-Epley, Lahman and Moore2015). The authors hypothesized that the changes in AFM may be attributed to the higher cost of energy expended towards osmoregulation beyond tolerating ranges of salinity exposures. In such a scenario, the metabolic demands of behavioural and physiological adaptations are likely to be too high; this may be compensated through the energy reduction spent on AFM (Jury et al., Reference Jury, Kinnison, Howell and Watson1994). The gradual salinity shifts also noted the decrease in AFM; however, the salinity range differed. AFM was comparable to the control conditions, only within a broader range of 20–41‰ in gradual salinity shifts, whereas the range was narrower (26–41‰) in abrupt shifts. Such a difference in range was expected, as previous research in crustaceans has noted that responses to extreme cues may differ depending on the nature of exposure to a determined stressor (Nel et al., Reference Nel, Perissinotto and Taylor2014). The coping range was reported to be narrower in abrupt shifts than in gradual shifts (Nel et al., Reference Nel, Perissinotto and Taylor2014). The observations on AFM in the present study suggest that seasonal salinity shifts in coastal regions may trigger short/long-term consequences in the chemoreceptor function of P. homarus. Considering the strong links between chemoreceptor functions and metabolic and growth attributes of aquatic animals, the observation is valid for coastal aquaculture practices. Further, the results of the present study warrant future research on the kinematics of AFM and electrophysiological response from neurons to determine how chemoreceptors and chemosensory abilities of P. homarus are specifically affected through AFM in salinity shifts.
Feeding responses can help in assessing the environmental quality for aquatic organisms, linking physiological organism-level responses to community-level effects (Maltby et al., Reference Maltby, Clayton, Wood and McLoughlin2002). Reports from crustaceans indicated that behavioural changes resulting from direct stimulation of receptor sites might disrupt feeding response (Hara et al., Reference Hara, Brown, Evans and Nriagu1983). The alteration of feeding responses might be due to the readjustment in the energetic allocation for the maintenance of osmoregulation (Felten et al., Reference Felten, Charmantier, Mons, Geffard, Rousselle, Coquery, Garric and Geffard2008). Such reports are further confirmed by a significantly decreased FRT from control animals beyond tolerable ranges of salinity exposures in both gradual and abrupt salinity shifts. Although this reduction in feeding responses (FRT) was expected, the ranges established through the study can form primary reference data for the species studied. Further, the change in behavioural attributes indicates physiological stress of animals having harmful long-term effects on growth or reproduction (Jury et al., Reference Jury, Kinnison, Howell and Watson1994; Houchens, Reference Houchens1996), thus becoming crucial in sustainable aquaculture strategies.
A better coping mechanism and a more comprehensive range of salinity tolerance were observed for gradual shifts in survival and behavioural responses, indicating better coping mechanisms during gradual than abrupt shifts. The availability of a ‘better avenue’ for management in terms of time to balance the trade-off between salinity stress and osmotic homeostasis (Nel et al., Reference Nel, Perissinotto and Taylor2014) might be the reason. However, a subtle influence of observer presence on behavioural responses cannot be entirely excluded, especially for AFM. Although video-based recording is used in behavioural studies, which is a limitation of the present study, we minimized potential observer bias through a strict, blinded and standardized observation protocol. Hence, future studies incorporating video-based recording will allow a more precise quantification and are recommended to validate the results. Gayathri et al. (Reference Gayathri, Gopakumar, Krupesha Sharma, Gop, Govind, Nair, Jagannivasan, Chakkalakkal, Santhoshkumar and Achamveetil2025) demonstrated that hsp70 gene serves as a biomarker of low-salinity stress in the marine finfish Trachinotus blochii. Such studies are needed to elucidate the biochemical and molecular basis of osmoregulation, alongside behavioural responses, to identify stress biomarkers and optimize osmotic coping strategies for the growth and survival of P. homarus.
Future studies are also required in an open natural environment to go into depth on the effects of salinity on behavioural and physiological responses. Further, this study focused on the effects of only salinity shifts under constant temperature to avoid confusing interactions. While this controlled approach allows a clearer attribution of observed responses to salinity, temperature and salinity fluctuations usually co-occur in coastal ecosystems, and may have interactive effects. Hence, future studies incorporating temperature-salinity interaction experiments are warranted to have a holistic understanding of the studied responses of P. homarus under dynamic coastal conditions.
Conclusion
The study establishes the survival and threshold ranges following gradual and abrupt salinity shifts in a high-value coastal aquaculture candidate, P. homarus. Further, easily monitorable behavioural attributes graded as reliable indicators in control conditions were evaluated as an approximation of animals’ potential to deal with the salinity shifts. The results on survival and behavioural attributes of P. homarus demonstrated a better tolerance of the animals to a broader salinity range, enabling them to thrive in an environment where many other marine species might suffer harmful effects, making P. homarus suitable for coastal aquaculture practices. Sustaining salinity within the recognized ranges and employing gradual acclimation procedures during water exchange are strongly recommended in aquaculture practices. However, in open coastal aquaculture farming where stringent salinity control is not practicable, minimizing abrupt salinity fluxes and implementing gradual acclimation protocols during inevitable environmental fluctuations can be the principal management practice. Behavioural indicators such as antennule flicking frequency and feed response time may assist farmers in early identification of stress and changing management strategies accordingly. Together, the present findings provide a practical platform for improving animal welfare, survival, and production stability in coastal aquaculture practices of P. homarus.
Acknowledgements
The authors are grateful to the Director, ICAR-Central Marine Fisheries Research Institute, Kochi for providing necessary facilities to carry out the present investigation. RR acknowledges “National Innovations in Climate Resilient Agriculture” for the research fellowship.
Author contributions
RKR conceptualized the presented idea, conducted the experiments, and supervised the findings. TGS and RKJ provided technical support to the experiments, combined the observations and drafted the manuscript. RR provided technical help in final drafting of the manuscript. EV and SKR did the statistical analysis of the results. ZPU & AG supervised the project and acquired financial support for the project leading to this publication.
Funding
This work was supported by the Indian Council of Agriculture Research, Department of Agricultural Research and Education, Government of India-funded project ‘National Innovations in Climate Resilient Agriculture’.
Competing interests
All authors have no conflicts of interest associated with this publication.
Data availability
All datasets generated during and/or analysed during the current study are available within the manuscript.
Statements and declarations
Provided after Acknowledgements.
Ethics approval
All the experiments involving live animals were carried out following ARRIVE guidelines (Percie du Sert et al., Reference Percie du Sert, Hurst, Ahluwalia, Alam, Avey, Baker, Browne, Clark, Cuthill, Dirnagl and Emerson2020). The procedures involving live fish were performed per the guidelines of EU Directive 2010/63/EU for animal experiments (2019) and the U.K. Animals (Scientific Procedures) Act (1986). The ICAR-CMFRI, Kochi, India, approved the experiments.
Declaration of AI-assisted technologies
During the preparation of manuscript, the authors used ChatGPT to improve language in certain selected portions. After using this tool, the authors reviewed the content and take full responsibility for the content of the publication.