Economic and social inequalities between ethnic groups – also known as horizontal inequalities (Stewart Reference Stewart2008) – have received increased attention in academia and policy circles in recent years. This growing interest is clear from the dramatic increase in the number of related academic publications.Footnote 1 A considerable body of political science research suggests that within-country inequalities between ethnic groups have major negative implications for peace, economic and political development, public goods provision, and individual well-being (see, for example, Alesina, Michalopoulos and Papaioannou Reference Alesina, Michalopoulos and Papaioannou2016; Baldwin and Huber Reference Baldwin and Huber2010; Canelas and Gisselquist Reference Canelas and Gisselquist2019; Cederman, Weidmann and Bormann Reference Cederman, Weidmann and Bormann2015; Houle Reference Houle2015; Houle and Bodea Reference Houle and Bodea2017; Stewart Reference Stewart2008; Wang and Kolev Reference Wang and Kolev2019; Ye and Han Reference Ye and Han2019). Furthermore, the reduction of group-level inequalities is included in United Nations Sustainable Development Goal 10 (UN 2020), and the issue was emphasized in a recent Organisation for Economic Co-operation and Development (OECD) report (Deere, Kanbur and Stewart Reference Deere, Kanbur, Stewart, Stiglitz, Fitoussi and Durand2018).
Much of the comparative research that has flourished in the past decade is premised on a series of relatively new datasets. These are valuable tools that can help monitor variation across space and time, as well as analyse causes and consequences. A few methodological studies have addressed measurement challenges related to survey and census data (Canelas and Gisselquist Reference Canelas and Gisselquist2019), suggested good measurement practices (Stewart, Brown and Mancini Reference Stewart, Brown and Mancini2010), and discussed data sources (Baghat et al. Reference Baghat2017; Tetteh-Baah Reference Tetteh-Baah2019). However, problems of causal inference have largely overshadowed important problems of conceptualization and measurement, and there are currently no systematic comparative evaluations of how extant cross-national measures relate to each other conceptually and empirically. This also means that we have limited knowledge of the strengths and weaknesses of the various measures, including whether they can be considered interchangeable.
Against this background, this article contributes to the emerging literature on ethnic inequalities by discussing and comparing six different cross-national measures offered by Alesina, Michalopoulos and Papaioannou (Reference Alesina, Michalopoulos and Papaioannou2016), Cederman, Gleditsch and Buhaug (Reference Cederman, Gleditsch and Buhaug2013), Houle (Reference Houle2015), Baldwin and Huber (Reference Baldwin and Huber2010), Omoeva, Moussa and Hatch (Reference Omoeva, Moussa and Hatch2018) and Varieties of Democracy (V-Dem) (Coppedge et al. Reference Coppedge2021a).Footnote 2 Scholars have used the evaluated measures in empirical studies to operationalize social or economic ethnic inequality cross-nationally, and they cover the majority of contemporary countries – or at least include countries from several world regions. Even though not all of these measures were created for broad purposes, they are increasingly being used for different empirical research (see, for example, Fleming et al. Reference Fleming2020; Ye and Han Reference Ye and Han2019), which underlines the need for systematic comparison.
The examination of the six indices is inspired by the steps in the integrated assessment framework suggested by Munck and Verkuilen (Reference Munck and Verkuilen2002), which provides a comprehensive checklist to evaluate data. However, my examination also goes beyond their framework by providing a series of new data visualizations, as well as four replication studies. In the assessment, I find clear differences in conceptualization, measurement, aggregation and empirical scope. Dramatic differences in coverage influence their relevance for research questions about the causes or consequences of ethnic inequality, which rely on cross-national and, especially, cross-temporal variation. The majority of measures are also afflicted by important biases, such as mainly covering developing countries or focusing exclusively on democracies. Moreover, a comparison of the data sources – including mass surveys, expert surveys, administrative data and satellite data on night lights – reveals likely sources of measurement error. A number of correlation analyses show that the empirical convergence between the measures is surprisingly low, even when taking into account the differences in conceptualization and aggregation procedures. Notably, two measures based on similar definitions exhibit no significant correlation at all. Moreover, the replication studies suggest that the results of a number of prominent studies are sensitive to measurement choice. The article thus aims to raise awareness about extant measures of ethnic inequality so that their respective strengths and weaknesses can be taken into account in the assessment of previous studies and the design of new ones. Based on these findings, I discuss potential avenues forward, including more disaggregated analyses and combining various data sources.
Conceptualization
At the most general level, inequality is about ‘the ability of households to maintain economically a certain standard of living and lifestyle’ (Jensen and van Kersbergen Reference Jensen and van Kersbergen2016, 36). If individuals or families have very different options in terms of how to live their lives, we intuitively consider them as living in an unequal society. Conceptually, we may distinguish between inequality on the individual and group levels. Interpersonal (or ‘vertical’) inequality is about differences between individuals or households, typically referring to disparities in post-tax-transfer disposable household income in a given year (Jensen and van Kersbergen Reference Jensen and van Kersbergen2016, 36). The empirics are typically summarized into comparable measures using Gini coefficients, ratios between income percentiles or income shares going to the top percentiles (Jensen and van Kersbergen Reference Jensen and van Kersbergen2016, 36–47; Piketty Reference Piketty2014).
Intergroup (or ‘horizontal’) inequality concerns between-group differences, which are defined according to the type of group identification one is interested in studying, such as ethnicity (Stewart Reference Stewart2002, 13). Ethnic inequalities can be measured both at the aggregate, country level (providing a single figure that represents the entire distribution in a country) and at the group level (providing figures for each group relative to the country mean or another group). This article focuses exclusively on aggregate, cross-national measures, which have been employed by most comparative studies so far (Baghat et al. Reference Baghat2017, 67). They use the average differences in outcomes, such as income or education, between ethnic groups in a society, aggregating them for comparisons across countries and over time.Footnote 3 In the surveyed works, ethnicity is generally understood in an encompassing manner consistent with the recent literature on ethnic politics (Canelas and Gisselquist Reference Canelas and Gisselquist2018, 306; Chandra Reference Chandra2006, 398; Horowitz Reference Horowitz2000). Following the tradition of Max Weber, ethnicity may be defined as a subjectively experienced sense of commonality based on a belief in common ancestry and shared culture (Weber Reference Weber1976 [1922], 389). Ethnic identity markers indicating a shared ancestry and culture include language (for example, in Belgium), religion (for example, in Bosnia and Herzegovina), tribe (for example, in Kenya), caste (for example, in India), phenotypical features (for example, in the United States) or some combination thereof. In other words, ethnic categories are social constructs linked to descent-based attributes.
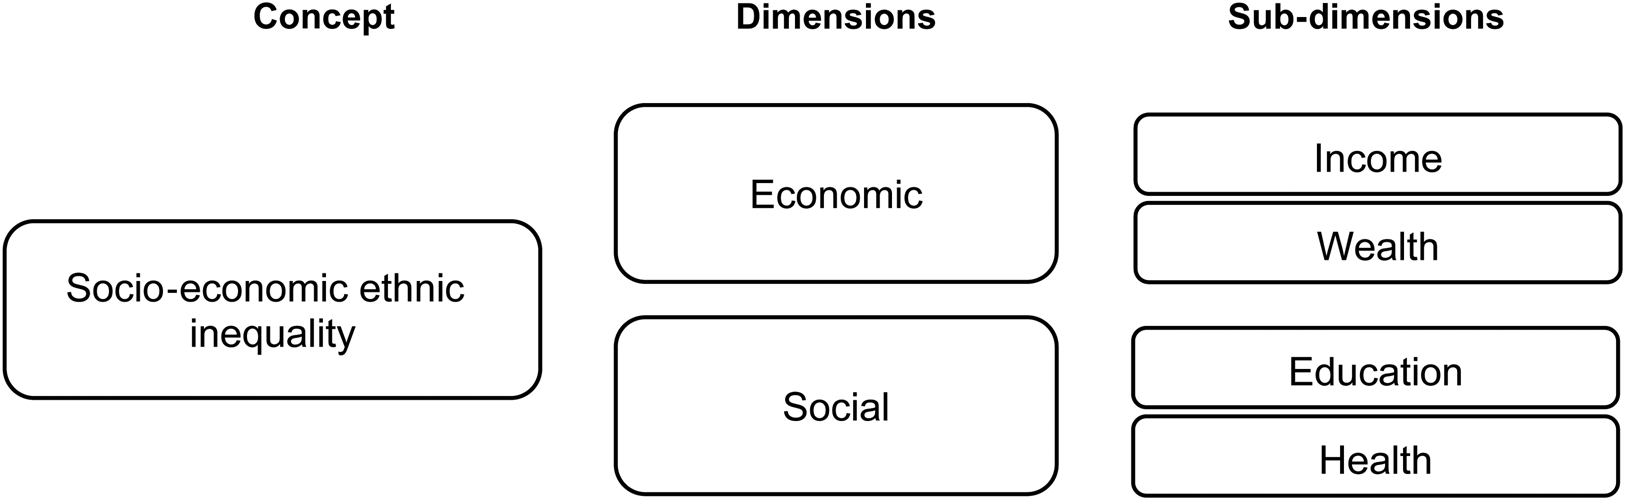
Are the surveyed measures of ethnic inequality based on similar conceptual foundations? The examined datasets variously refer to ‘economic horizontal inequality’ (Cederman, Gleditsch and Buhaug Reference Cederman, Gleditsch and Buhaug2013, 93), ‘differences in the economic well-being of groups’ (Baldwin and Huber Reference Baldwin and Huber2010, 645), ‘between-ethnic-group inequality (BGI)’ (Houle Reference Houle2015, 470), ‘within country differences in well-being across ethnic groups’ (Alesina, Michalopoulos and Papaioannou Reference Alesina, Michalopoulos and Papaioannou2016, 429), ‘inequalities in education … between ethnic groups’ (Omoeva, Moussa and Hatch Reference Omoeva, Moussa and Hatch2018, 3) and ‘inequalities in access to public services … between particular social groups’ (Coppedge et al. Reference Coppedge2021a, 218). To invoke a useful distinction by Adcock and Collier (Reference Adcock and Collier2001), they are not ‘systematized concepts’, but seem to agree on the ‘background concept’. That is to say, despite different terminologies, all of the surveyed measures share a common conceptual core, as they all reflect asymmetries in socio-economic conditions between ethnic groups. Importantly, all datasets are explicit about which dimension of ethnic inequality they are capturing (see Stewart Reference Stewart2002): the economic dimension concerns the distribution of income and wealth between ethnic groups (as used by Alesina, Michalopoulos and Papaioannou, by Baldwin and Huber, by Cederman, Gleditsch and Buhaug, and by Houle); while the social dimension concerns the uneven access of groups to public services, such as healthcare and education (as used by Coppedge et al. and by Omoeva, Moussa and Hatch). These dimensions not only reflect a common core – socio-economic ethnic inequality – but are also likely to be highly correlated due to common determinants and reciprocal relationships: inequality in access to public services may translate into, and be highly associated with, economic ethnic inequality and vice versa (see Stewart, Brown and Mancini Reference Stewart, Brown and Mancini2010). The conceptual structure is illustrated in Figure 1.
Illustration of conceptual structure.

Measurement
The various dimensions and sub-dimensions of socio-economic ethnic inequality can be operationalized in various ways, using a range of indicators. Since the data providers implicitly agree on a background concept (that is, ethnic inequality concerns differences in standards of living between ethnic groups), a comparison of these measures seems meaningful.
Overview of Extant Measures
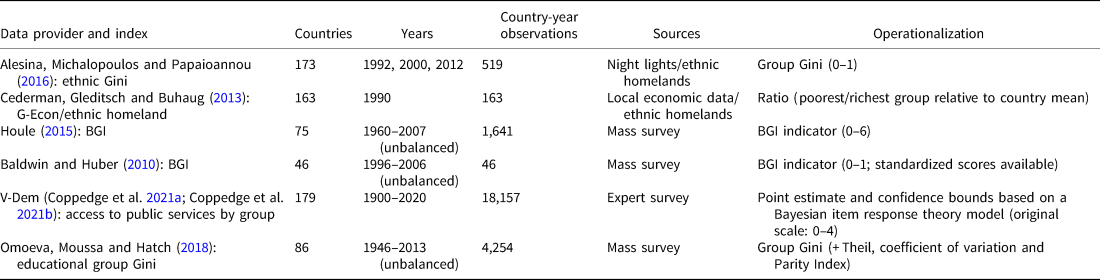
Alesina, Michalopoulos and Papaioannou's (Reference Alesina, Michalopoulos and Papaioannou2016) ethnic Gini indices are based on satellite images of night-time luminosity, combined with the homelands of ethnolinguistic groups. This measure reflects differences in ‘mean income’ – as reflected by luminosity per capita across ethnic homelands – between groups within 173 countries (in 1992, 2000 and 2012). Ethnic groups are located using two datasets/maps: first, the Geo-Referencing of Ethnic Groups (GREG), which is the digitized version of the Soviet Atlas Narodov Mira from the 1960s (Weidmann, Rød and Cederman Reference Weidmann, Rød and Cederman2010); and, second, the fifteenth edition of the Ethnologue (Gordon Reference Gordon2005), which mapped 7,581 language-country groups worldwide in the mid- to late 1990s. The GREG attempts to map major immigrant groups, whereas Ethnologue generally does not. Hence, the two ethnolinguistic mappings capture different ethnic groups, which is particularly important for countries in the Americas (Alesina, Michalopoulos and Papaioannou Reference Alesina, Michalopoulos and Papaioannou2016, 433).
Cederman, Gleditsch and Buhaug (Reference Cederman, Gleditsch and Buhaug2013) geographically match subnational economic data (the G-Econ data by Nordhaus et al. [Reference Nordhaus2006]) with data on the geographical boundaries of ethnic settlements from the geocoded extension (GeoEPR) of the Ethnic Power Relations (EPR) dataset (Wucherpfennig et al. Reference Wucherpfennig2011). While their analytical focus is on investigating group-level data and civil war onset, they also conduct cross-national analyses (see also Buhaug, Cederman and Gleditsch Reference Buhaug, Cederman and Gleditsch2014). Strictly speaking, the temporal scope is limited to a single year because the G-Econ data only reflect 1990 values and only the GeoEPR is dynamic, taking into account major changes in ethnic settlement patterns over time (Cederman, Gleditsch and Buhaug Reference Cederman, Gleditsch and Buhaug2013, 101, 106).
Houle (Reference Houle2015) uses information from a range of surveys, including the Demographic and Health Survey (DHS), World Values Survey (WVS) and various regional barometers, to construct an asset-based wealth indicator for within-group, between-group and cross-national ethnic inequality. Since the data were originally gathered to study democratic breakdowns, the measure covers 89 countries from 1960 to 2007 that have been democratic for at least one year and are ethnically heterogeneous. The panel is unbalanced and exhibits limited variation over time (Houle Reference Houle2015, 500).
Baldwin and Huber (Reference Baldwin and Huber2010) construct a between-group inequality measure (BGI), similar to a group Gini coefficient, for 46 democracies based on income variables from a series of surveys. The sample includes democracies from all regions of the world, though Asia and especially Latin America are under-represented in so far as these regions have a higher proportion of democracies than the dataset suggests (Baldwin and Huber Reference Baldwin and Huber2010, 648). Each country is measured in one year between 1996 and 2006, effectively making the data cross-sectional. The data only include democracies because they were originally collected for the purpose of studying public goods provision in heterogeneous democracies. As pioneers in the field, Baldwin and Huber are careful to validate their measure empirically, including comparison of their measure to a handful of countries, where the nature of inequality between groups is widely acknowledged. Moreover, they turn to a number of more fine-grained household surveys that identify income by ethnic group (Baldwin and Huber Reference Baldwin and Huber2010, 649–50).Footnote 4
Finally, two measures capture unequal access to public services rather than economic outcomes. In the newest data release (v11.1), V-Dem provides an expert-coded indicator of inequality in access to basic public services (for example, primary education, clean water and healthcare) distributed by ‘social group’. The group definition corresponds to a broad conception of ethnicity, covering, among other things, language, race and religion (Coppedge et al. Reference Coppedge2021a, 209). The dataset covers all sovereign states in the world since 1900, with the exception of a number of micro-states.
As part of the Education Inequality and Conflict Project (EIC 2015), Omoeva, Moussa and Hatch (2018, 16) have created measures of inequality in educational attainment between ethnic/religious groups by constructing a group Gini coefficient (as well as Theil Index, coefficient of variation and parity ratio). They draw on educational attainment data from three public household survey datasets (Omoeva, Moussa and Hatch Reference Omoeva, Moussa and Hatch2018, 15) and fill in missing country-year observations using a logical backward projection technique. The unbalanced dataset covers a set of 86 predominantly developing countries between 1946 and 2013 (Omoeva, Moussa and Hatch Reference Omoeva, Moussa and Hatch2018, 50).
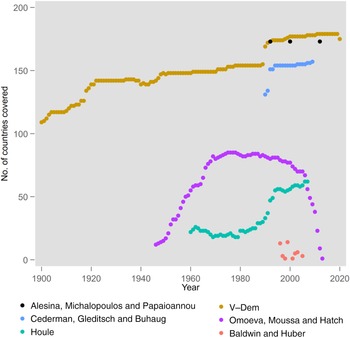
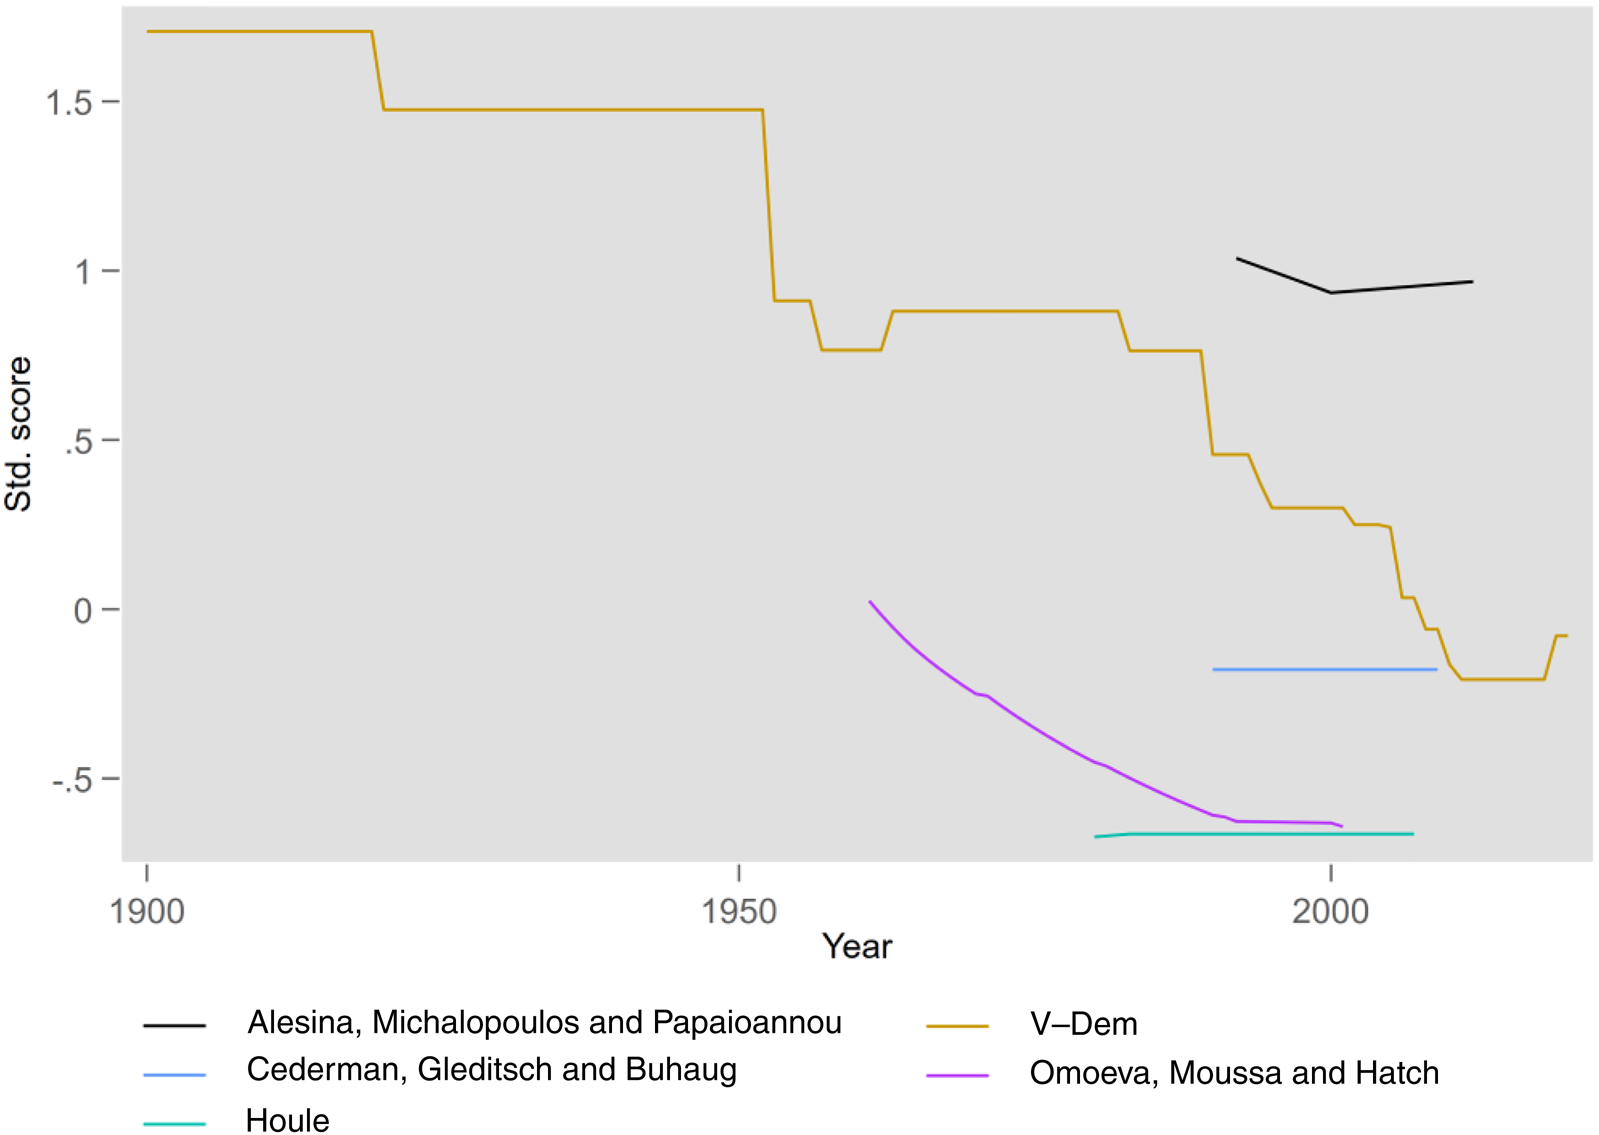
Despite the measures all sharing a common focus on ethnic inequality, they are marked by dramatic differences in scope, ranging from a cross-section of 46 countries to a measure covering most polities since 1900 (see Table 1 and Figure 2).Footnote 5 There are also large differences in terms of how time varying the data are. This is illustrated in Figure 3, which plots the values of the different measures over time for Bolivia, where a high level of ethnic inequality is widely acknowledged (Houle Reference Houle2015, 485). The V-Dem, the Omoeva, Moussa and Hatch, and the Alesina, Michalopoulos and Papaioannou measures exhibit significant variation over time. In contrast, save for a minor change in the Houle measure, the Cederman, Gleditsch and Buhaug and the Houle measures are time invariant.Footnote 6
Country coverage over time, by measure.
Notes: Each point indicates how many countries are covered in a given year by the dataset in question. V-Dem covers many colonies, which explains its high country-coverage prior to decolonization.

Temporal variation of measures – Bolivia as example.
Notes: The cross-sectional Baldwin and Huber measure is not included. To ensure comparability, the variables have been standardized (mean of 0; standard deviation of 1).

Scope, sources and operationalization of extant measures

Notes: It should be noted that night lights may also proxy for access to public services, meaning the distinction between economic and social dimensions is not clear-cut.
The creators of the first cross-national measures, such as Baldwin and Huber (Reference Baldwin and Huber2010), deserve much credit for paving the way with their work to conceptualize and create the first ethnic inequality measures. For the purpose of future empirical studies, however, the restricted empirical scope of most measures limits their value for particular research questions. In particular, the ability to track the developments over time with respect to ethnic inequality is severely restricted.
Finally, there are strong non-random patterns in the data. Most clearly, not all measures support direct comparisons between poor countries and the experiences of rich, long-enduring democracies. In particular, the Omoeva, Moussa and Hatch (Reference Omoeva, Moussa and Hatch2018) data only include a limited number of high-income countries, whereas the Baldwin and Huber (Reference Baldwin and Huber2010) and Houle (Reference Houle2015) datasets only include democracies. I further explore this issue in the Online Appendix (see Table A1) with a simple test of non-random missingness (see Rios-Figueroa and Staton Reference Rios-Figueroa and Staton2012, 125). These findings show that most measures provide samples that are not representative regarding gross domestic product per capita (GDP/cap), democracy and state capacity. Looking across the tests, the V-Dem and the Alesina, Michalopoulos and Papaioannou measures appear to be least afflicted by non-random missingness. These non-random patterns in the data reduce the ability to infer from the sample to the general population of all countries, and they mean we should avoid being overly confident about any robustness analysis using alternative measures.
Data Sources
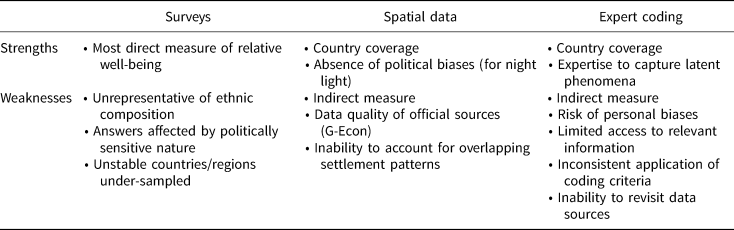
In addition to well-known measurement constraints for interpersonal (or vertical) inequality, the measurement of ethnic inequality depends on comparable group classifications. This represents a significant challenge, as ethnic identities are not static, people hold multiple identities and data are often unavailable or incomplete (Bochsler et al. Reference Bochsler2021; Canelas and Gisselquist Reference Canelas and Gisselquist2019, 161; Stewart, Brown and Mancini Reference Stewart, Brown and Mancini2010, 10). Dataset creators have creatively addressed these challenges and collected data in three general ways: (1) surveys, which include information on both socio-economic well-being and ethnic group affiliations; (2) spatial datasets, which geographically match economic data with data on the geographical boundaries of ethnic settlements; and (3) expert coding.
More specifically, the challenge of identifying comparable ethnic categories has been addressed in three main ways. One strand, which includes Baldwin and Huber (Reference Baldwin and Huber2010), Alesina, Michalopoulos and Papaioannou (Reference Alesina, Michalopoulos and Papaioannou2016), Cederman, Gleditsch and Buhaug (Reference Cederman, Gleditsch and Buhaug2013) and Houle (Reference Houle2015), adheres to the ethnic group classification as coded by either Fearon (Reference Fearon2003) or Ethnologue (Gordon Reference Gordon2005), or by the EPR dataset or its geocoded extension (GeoEPR) (Vogt et al. Reference Vogt2015; Weidmann, Rød and Cederman Reference Weidmann, Rød and Cederman2010). Another strand, represented by Omoeva, Moussa and Hatch (Reference Omoeva, Moussa and Hatch2018), uses the ethnic categories that have been predefined by the teams that develop surveys. Finally, V-Dem (Coppedge et al. Reference Coppedge2021a) uses experts' local knowledge to assess ethnic groups based on a prior group definition.Footnote 7
In terms of socio-economic data sources, Baldwin and Huber (Reference Baldwin and Huber2010), Houle (Reference Houle2015) and Omoeva, Moussa and Hatch (Reference Omoeva, Moussa and Hatch2018) all use national household surveys, which include information on both socio-economic well-being and ethnic group affiliations. On the one hand, biased information is unlikely when data are generated from surveys like the DHS, as the original intention was not to assess socio-economic inequalities between ethnic groups.Footnote 8 On the other hand, survey and census data on ethnic issues may entail (intentionally or not) incomplete and biased responses: minority groups may not be accurately represented in national surveys; answers could be significantly affected by the sometimes politically sensitive nature of ethnic identities (Canelas and Gisselquist Reference Canelas and Gisselquist2019, 165); and more politically stable countries are more often surveyed in the DHS programme. In the African context, for instance, Libya, Eritrea, Somalia, Sudan and the Central African Republic are not included (Tetteh-Baah Reference Tetteh-Baah2019, 31).Footnote 9
In light of the gaps and weaknesses in survey- and census-based data on ethnic inequality, Cederman, Gleditsch and Buhaug (Reference Cederman, Gleditsch and Buhaug2013) combine data on ethnic groups' settlement areas with the Nordhaus et al. (Reference Nordhaus2006) G-Econ dataset on local economic activity to measure economic ethnic inequalities. Similarly, Alesina, Michalopoulos and Papaioannou (Reference Alesina, Michalopoulos and Papaioannou2016) have worked with various proxy measures to combine geocoded night-light data with historical maps of ethnic territories or homelands. While these spatial measures provide higher coverage, they also suffer from numerous drawbacks. Measures of local economic activity hinge on the quality of the underlying sources, and data quality is particularly poor for countries with unreliable official statistics and substantial informal economies (Baghat et al. Reference Baghat2017, 82; Chen and Nordhaus Reference Chen and Nordhaus2011). Night-light emissions from satellite data are an alternative that is independent of governmental bias or the limited quality of official statistical sources. However, like the other measures, this data source is also afflicted by weaknesses, such as constituting a relatively indirect proxy for economic development (Chen and Nordhaus Reference Chen and Nordhaus2011), and official data sources are likely to be more accurate in developed countries (Mellander et al. Reference Mellander2015). Moreover, both spatial methods may lead to measurement error in cases where the ethnic group settlement areas largely overlap. Consequently, spatial approaches cannot accurately estimate the economic inequalities between, for example, the Tutsi and Hutu in Rwanda and Burundi (Alesina, Michalopoulos and Papaioannou Reference Alesina, Michalopoulos and Papaioannou2016, 449; Cederman, Weidmann and Bormann Reference Cederman, Weidmann and Bormann2015, 807). Returning to the issue of scope and temporal variation, it is worth noting that surveys may or may not be available in a regular time-series format, whereas satellite-based measures – as well as updated ethnic homelands data (for example, GeoEPR) – are available in time series from the 1990s onward. Consequently, satellite-based measures may help track trends across and within countries with improved temporal granularity in the future.
The V-Dem measure is based on coding by multiple country experts of the question as to whether ‘basic public services, such as order and security, primary education, clean water and healthcare, [are] distributed equally across social groups’ (Coppedge et al. Reference Coppedge2021a, 218). The advantage of this approach is the ability to capture latent phenomena based on experts' country-specific knowledge. Given the difficulty of obtaining comparable observable data for public service provision by ethnic group, the assessments made by country experts can become useful when measuring social ethnic inequalities (see Munck, Møller and Skaaning Reference Munck, Møller, Skaaning, Curini and Franzese2020, 341). As with any judgement-based data, however, this approach also has its challenges, including the risk of personal biases, limited or biased background information, and reliability issues stemming from inconsistently applied coding criteria (Skaaning Reference Skaaning2018, 111–13). As elaborated later, the V-Dem approach increases comparability and reduces the biases inherent in expert codings, which alleviates some of these concerns. However, compared to the other measures, it is much more difficult for us to revisit the data sources, which is relatively easy with the public surveys, G-Econ or night-lights data. As such, it is impossible to verify, for instance, which ethnic groups form the basis of the expert coding or how much relevant information the expert actually has about ethnic inequality regarding a particular year. Both regarding concept and empirics, we simply cannot know exactly what the coders had in mind when arriving at their assessments, as coders are not required to justify their decisions.
The discussed strengths and weaknesses of the data sources are reported in Table 2. As should be apparent, there are no fundamentally superior data sources with the current data availability. In this sense, data choices should be governed by the research question at hand: when studying a specific region, survey measures may prove superior to spatial or expert-coded data, whereas spatial or expert-coded data are more likely to be relevant for global patterns. In that sense, there is a certain trade-off between the geographical and temporal coverage of the data versus its quality (see also Baghat et al. Reference Baghat2017, 82). I discuss the option of combining various data sources at the end of the article.
Strengths and weaknesses of different data types

Aggregation
All of the measures are based on different items of information that must be combined to develop the overall measure. Stewart, Brown and Mancini (Reference Stewart, Brown and Mancini2010) consider principles of good measures and make the case for three ways to measure aggregate group inequality: the GGini, GTheil and GCOV, which correspond to the classical Gini coefficient, the Theil index and the coefficient of variation. Instead of calculating inequality based on each individual's income, it assigns each group's mean income to every member of that group (Baldwin and Huber Reference Baldwin and Huber2010, 646–8; Stewart, Brown and Mancini Reference Stewart, Brown and Mancini2010, 15). The most established measure – the group Gini index – captures the normalized mean difference between all group incomes in a country, weighted by the population size of each group. Like the Gini coefficient, it ranges from 0 to 1 and offers an interpretation related to the Lorenz curve, as described in detail by Baldwin and Huber (Reference Canelas and Gisselquist2010, 646). The measure takes on its minimum value when the average incomes of all groups in society are the same, and it takes on 1 when one infinitely small group controls all income (Baldwin and Huber Reference Baldwin and Huber2010, 646).
The group Gini index is adequate in terms of capturing the general level of inequality across countries over time. Alesina, Michalopoulos and Papaioannou (Reference Alesina, Michalopoulos and Papaioannou2016) follow this procedure and construct two ‘ethnic Ginis’. Similarly, Omoeva, Moussa and Hatch (Reference Omoeva, Moussa and Hatch2018) calculate a group Gini coefficient (as well as a group Theil and a coefficient of variation) for educational attainment across ethnic groups. Although differing in terminology, the Baldwin and Huber (Reference Baldwin and Huber2010) BGI measure is calculated in the same way as the group Gini (Baldwin and Huber Reference Baldwin and Huber2010, 646). Although similar, the aggregate measure by Houle (Reference Houle2015) departs slightly from the Baldwin and Huber GGini or ‘BGI’ formula.Footnote 10
Another group of measures is employed by scholars who empirically investigate theoretical arguments that only require one group to mobilize. Cederman, Gleditsch and Buhaug's (Reference Cederman, Gleditsch and Buhaug2013, 143–67) cross-national measure captures the difference between the national average per capita income level and the per capita income of the most (dis)advantaged ethnic group in the country. The authors are explicit that such a ‘weakest link logic’ is more theoretically relevant when studying civil war onset (Cederman, Gleditsch and Buhaug Reference Cederman, Gleditsch and Buhaug2013, 145) because measures based on averages or summed features would discount small, atypical groups, especially in large countries, but such groups might also be the most conflict-prone. While diverging from Stewart, Brown and Mancini's (Reference Stewart, Brown and Mancini2010) suggested approach, the data providers have based their aggregations on explicit theory. Overall, this aggregation procedure means that the measure should differ substantially from the others, as it is not intended to measure overall inequality.
Finally, the V-Dem measure is aggregated using the standard V-Dem methodology. Expert-assigned scores are aggregated through a Bayesian item response theory (IRT) measurement model, which also uses information about coder agreement, self-assigned uncertainty estimates, personal coder characteristics, links between countries based on experts assessing more than one country and responses to vignettes related to the survey questions in order to align the experts' thresholds and calculate uncertainty estimates (Coppedge et al. Reference Coppedge2021b, 16–25; Pemstein et al. Reference Pemstein2019). This procedure supposedly reduces potential biases, but it cannot eliminate them altogether. For the purpose of comparison, the measure has been recoded to go from 0 to 1, with higher values indicating greater inequality.
In sum, the datasets aggregate their data in three different ways: first, measures that reflect the entire distribution of resources or access to public services in a society through measures such as the GGini (Alesina, Michalopoulos and Papaioannou Reference Alesina, Michalopoulos and Papaioannou2016; Baldwin and Huber Reference Baldwin and Huber2010; Houle Reference Houle2015; Omoeva, Moussa and Hatch Reference Omoeva, Moussa and Hatch2018); second, ratio measures focusing explicitly on the poorest (or wealthiest) groups in society relative to the country mean (Cederman, Gleditsch and Buhaug Reference Cederman, Gleditsch and Buhaug2013); and, third, indices summarizing different experts' codings, providing an easy-to-interpret number (Coppedge et al. Reference Coppedge2021a). As discussed, most measures are aggregated based on existing best practice or explicit theory. In this sense, each measure is appropriate for different research questions. Most clearly, researchers interested in cross-national differences that take into account the entire group distribution should opt for the first or third categories, whereas the second category may be relevant when studying particular ethnic mobilization patterns.
Empirical Comparison
The many differences and similarities in the conceptualizations and measurements of ethnic inequality render it relevant to explore the statistical association between the indices. Comparisons of competitive measures linked to similar background concepts are often assessed by simple correlation tests to clarify whether they tend to tap into the same phenomenon. Following this tradition, Table 3 presents the bivariate correlations between the ethnic inequality indicators. For the purposes of this exercise, I only include the Alesina, Michalopoulos and Papaioannou (2016) Ethnologue-based measure, which draws on more recent spatial data (the two measures are correlated at 0.73). Moreover, from Cederman, Gleditsch and Buhaug (Reference Cederman, Gleditsch and Buhaug2013), I only include the ratio of the poorest group relative to the mean (for a full correlation analysis covering all measures, see Table A8 in the Online Appendix).
Correlations between measures

Notes: Results refer to bivariate Pearson's r correlations (n in parentheses), with values over 0.4 in bold. ‘n/a’ indicates no country-year overlap. The topmost three measures reflect the economic dimension, whereas the lower two reflect the social dimension. Principal component factor analysis (unrotated).
Since all of the measures were argued to reflect the same background concept, share causal determinants and affect each other, we would expect them all to be at least moderately correlated. Moreover, measures supposed to capture the same dimension (that is, public services or income/wealth) should show a high level of covariation. In Table 3, the topmost measures (Alesina, Michalopoulos and Papaioannou, Baldwin and Huber, Cederman, Gleditsch and Buhaug, and Houle) reflect the economic dimensions, whereas the lower two (Coppedge et al. and Omoeva, Moussa and Hatch) reflect the social dimension. In addition, since Cederman, Gleditsch and Buhaug use a distinct aggregation procedure, we expect this measure to exhibit lower correlations with the other measures.
The most striking observations from Table 3 are the many weak correlations. Only three out of fourteen are higher than 0.4. To provide a point of comparison, measures of democracy – which also vary substantially in terms of their exact conceptualization and measurement – tend to be highly correlated, typically at 0.8 or higher (Marquez Reference Marquez2016, 11–16). In the same vein, despite varying definitions and data sources, conventional measures of socio-economic inequality also tend to be highly correlated (in the range of 0.44–0.90).Footnote 11 The Alesina, Michalopoulos and Papaioannou measure shows a moderate correlation with the two measures of equal access to social services by V-Dem and Omoeva, Moussa and Hatch, yet it is virtually uncorrelated with the other measures.Footnote 12 Moreover, the V-Dem measure is relatively highly correlated with the Baldwin and Huber measure (0.62). Most surprisingly, the Houle measure shows virtually no correlation with the Alesina, Michalopoulos and Papaioannou measure. Moreover, it is only weakly correlated with the Cederman et al. measure, while showing a slightly stronger covariation with the two measures capturing equal access to public services (about 0.3). Perhaps equally surprising, the Cederman et al. G-Econ measure is negatively correlated with the Omoeva, Moussa and Hatch measure. Contrary to expectations, the two measures of social ethnic inequality (V-Dem and Omoeva, Moussa and Hatch) are only weakly correlated with each other (0.17).Footnote 13 To ensure that these results are not simply an artefact of differences in samples, I conduct a series of additional correlation analyses in the Online Appendix, including overlapping time periods and a core set of countries (see Tables A3–A6). This exercise corroborates the overall pattern of surprisingly low correlations between most measures.
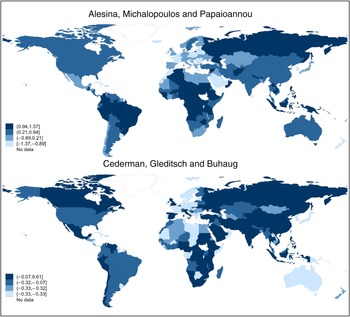
Figure 4 maps the standardized values (mean of 0; standard deviation of 1) for the Alesina, Michalopoulos and Papaioannou and the Cederman et al. data to provide a better sense of the empirical patterns in each dataset and show how individual countries are scored relative to each other. This also provides country or regional experts with an opportunity to assess the face validity of these scores (maps for the other measures are provided in the Online Appendix).
Standardized values for Alesina, Michalopoulos and Papaioannou and for Cederman, Gleditsch and Buhaug (2000).
Notes: The figure displays the standardized country scores for the data by Alesina, Michalopoulos and Papaioannou (top panel) and Cederman, Gleditsch and Buhaug (lower panel) in the year 2000. The values are grouped by quartiles.

While there is rough agreement on a number of cases, such as Peru, the Democratic Republic of Congo and Ethiopia, several important exceptions also stand out. For instance, there is large disagreement with regard to South Africa: the Alesina, Michalopoulos and Papaioannou measure scores it as surprisingly equal (close to the global mean), whereas it is considered as highly unequal in the Cederman, Gleditsch and Buhaug data. In this case, the Cederman, Gleditsch and Buhaug data are probably closer to the widespread perception that socio-economic group differences remain high in post-apartheid South Africa. To take another example, Saudi Arabia emerges as highly equal in the Alesina, Michalopoulos and Papaioannou data, whereas it scores as highly unequal in the Cederman, Gleditsch and Buhaug data. Finally, Sweden is scored as relatively unequal in the Alesina, Michalopoulos and Papaioannou data, whereas the Cederman, Gleditsch and Buhaug measure scores it as highly equal.Footnote 14 Overall, such large disagreements between country scores help to explain the low correlation between these measures (0.16).
In the Online Appendix, I graphically explore the non-correlated measures of Alesina, Michalopoulos and Papaioannou and Houle (see Figure A13). In addition, in Table A7 in the Online Appendix, I conduct a systematic comparison of the measures for a number of countries where the nature of ethnic inequality is well established (South Africa, Guatemala, Peru, Brazil, Nigeria and Switzerland). The takeaway from this exercise is that most measures agree only very roughly on the relative order of a country, with significant variation and hard-to-explain exceptions.
Returning to the question of possible clustering, a principal component factor analysisFootnote 15 reveals two principal factors with eigenvalues above 1 (see Table 3). The first factor shows moderate to high loadings by all measures, suggesting that they tap into a common, latent phenomenon. This corresponds to the previously discussed conceptual logic, in which all dimensions reflect socio-economic ethnic inequality. The second factor exhibits moderate loadings by the Cederman, Gleditsch and Buhaug and by the Houle measures, to which there is no straightforward interpretation.Footnote 16 In line with the bivariate correlation analysis, the factor analysis reveals no clustering around an economic and social dimension, respectively.
To further probe my interpretations, I follow Adcock and Collier's (Reference Adcock and Collier2001, 540) recommendation to assess correlations between the measures and those of neighbouring concepts (discriminant validation). This allows me to check whether the measures diverge from established measures of different yet related concepts. I have thus correlated the various measures with the interpersonal income Gini, interpersonal educational Gini and two measures of ethnic fractionalization. The full analysis is provided in the Online Appendix (see Table A3). Most measures behave largely as we would expect, being moderately correlated with the different neighbouring concepts.
Meanwhile, the Houle measure demonstrates relatively low correlations with the neighbouring concepts (mostly around 0.15‒0.20). Strikingly, the Cederman, Gleditsch and Buhaug measure has very low and even negative correlations with the neighbouring concepts. The low correlations of this measure with neighbouring concepts could partly be explained by the ratio aggregation approach, which reflects the poorest (or richest) group in society relative to the mean, whereas the selected neighbouring concepts capture aggregate distributions. As the status of the poorest (or richest) groups in society does not necessarily correspond to the level of ethnic inequality based on the entire distribution of groups, we may see low correlations. In short, these findings further underscore how the choice between ratio-based and aggregate measures (which represent the entire distribution) has important consequences.Footnote 17
Do the Differences Matter?
To see whether the reported dissimilarities in conceptualization and measurement affect the findings of empirical analyses, I conduct replication analyses of four prominent studies published in highly recognized journals or book series (Alesina, Michalopoulos and Papaioannou Reference Alesina, Michalopoulos and Papaioannou2016; Baldwin and Huber Reference Baldwin and Huber2010; Cederman, Gleditsch and Buhaug Reference Cederman, Gleditsch and Buhaug2013; Houle Reference Houle2015). In each replication analysis, I have used the original datasets and Stata code, only substituting the measures of ethnic inequality, which have been standardized to ensure comparability.Footnote 18 To save space, I only report the main coefficients in the following, whereas the full regression tables, including controls, are available in the Online Appendix.Footnote 19
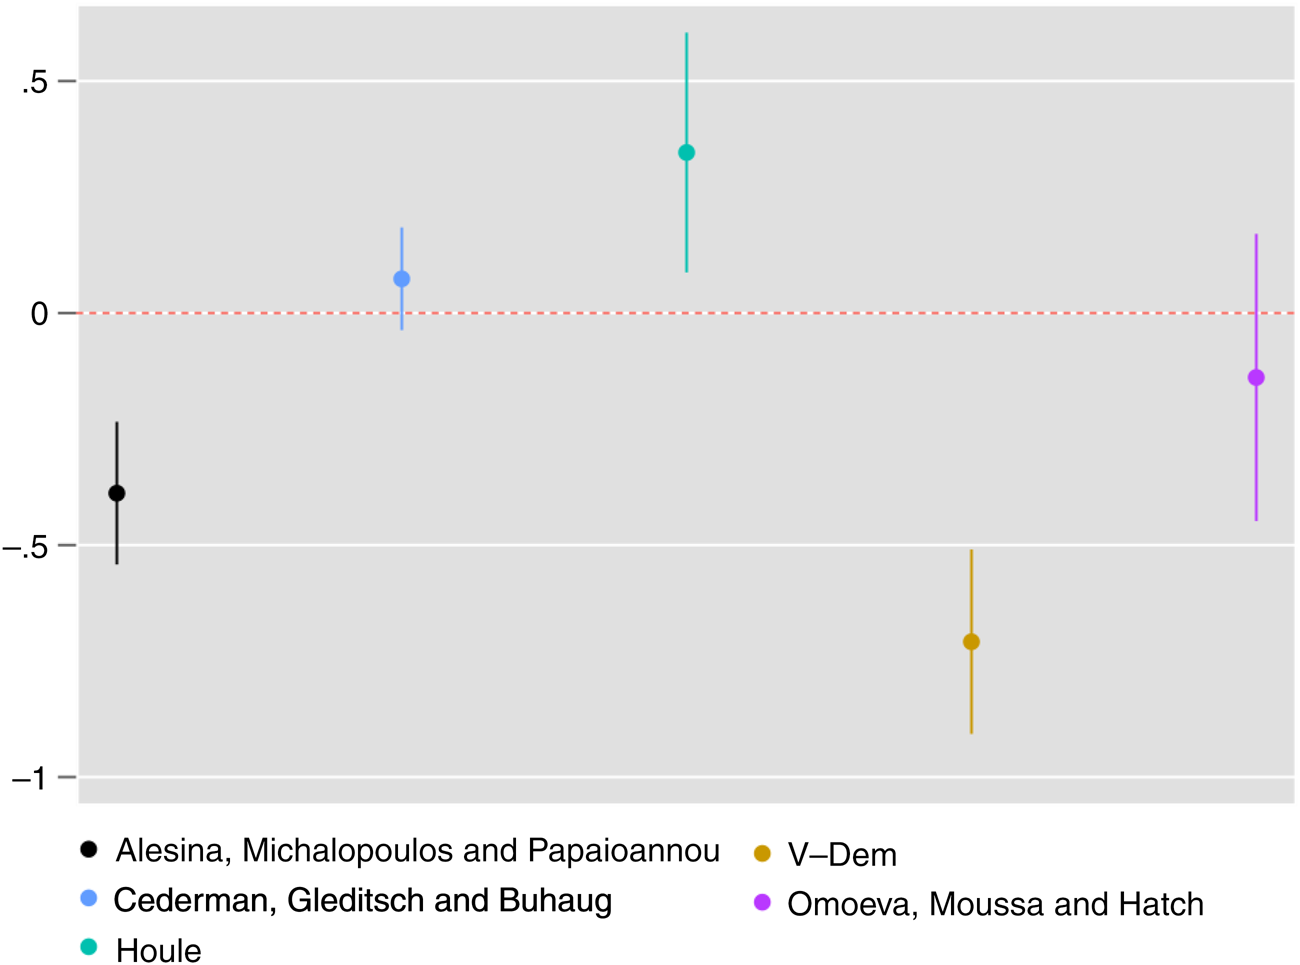
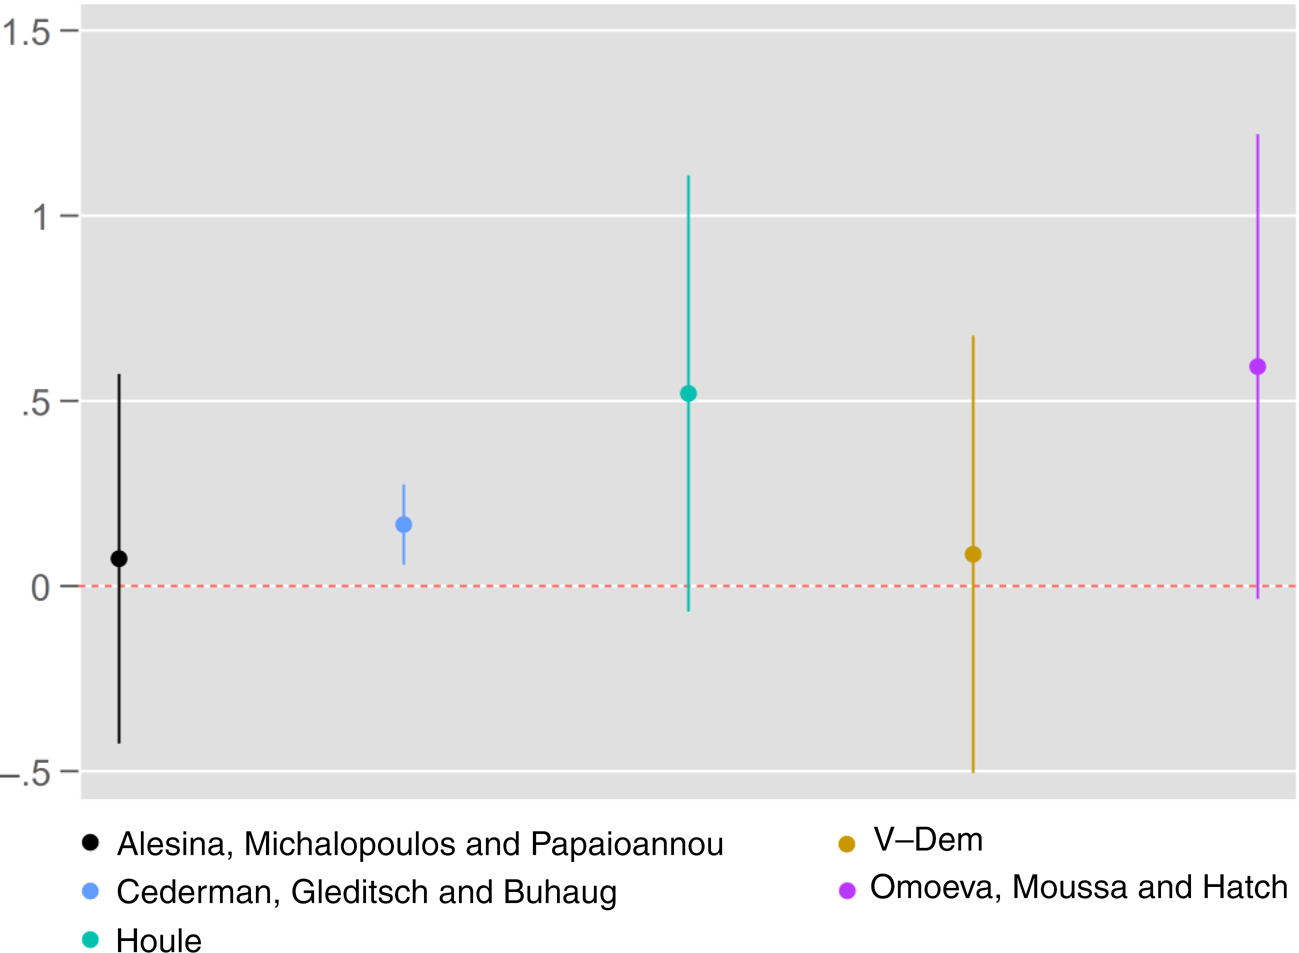
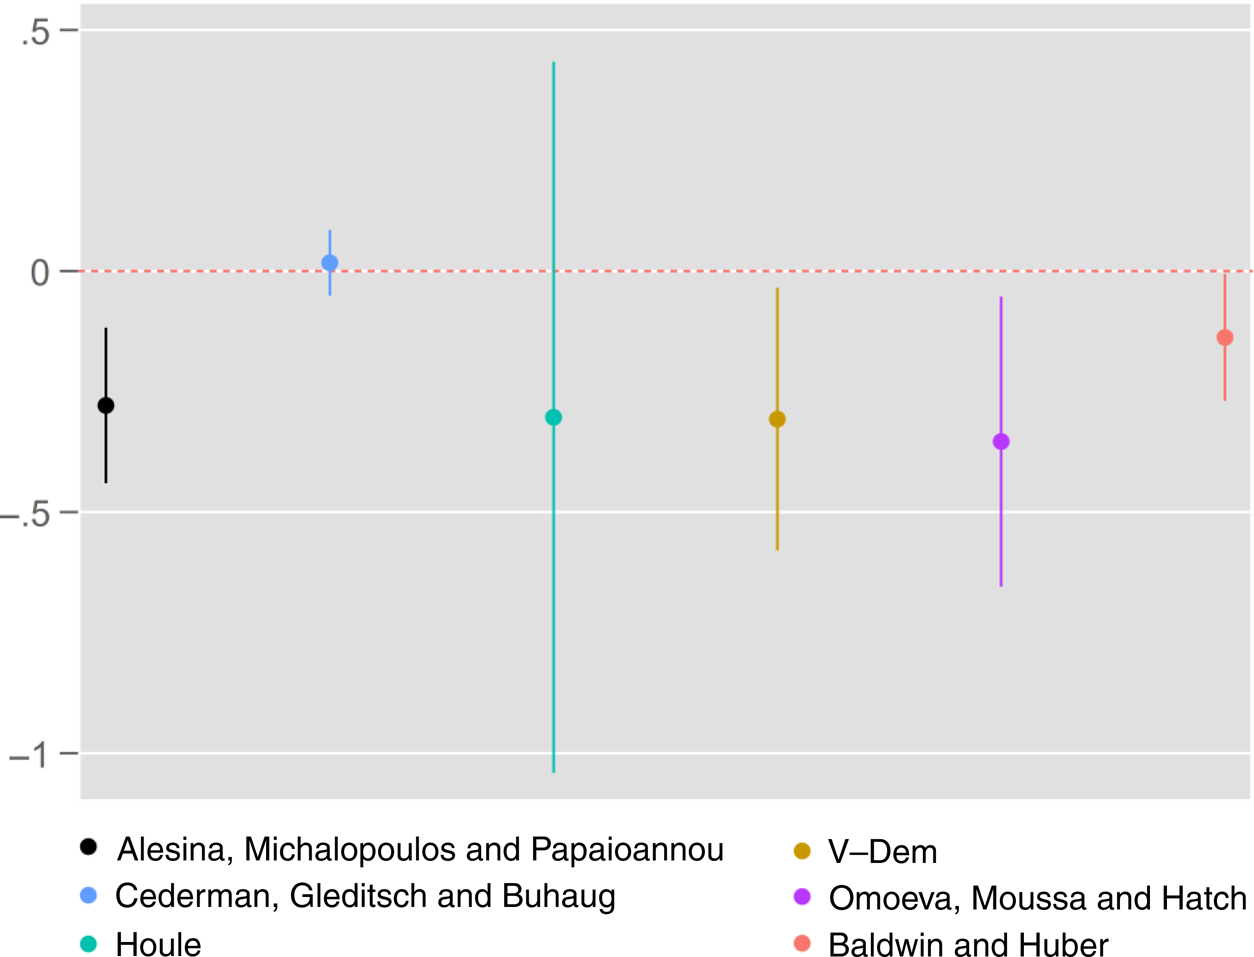
Alesina, Michalopoulos and Papaioannou (Reference Alesina, Michalopoulos and Papaioannou2016, 454) find a negative and statistically significant cross-country association between ethnic inequality and economic development – measured as the log of per capita GDP in 2000. In Figure 5, I report the ordinary least squares (OLS) regressions, relating logged GDP per capita and the different measures of ethnic inequality. In these analyses, only the coefficients for the Alesina, Michalopoulos and Papaioannou and V-Dem measures are negative and statistically significant, whereas Omoeva, Moussa and Hatch have the expected sign yet fail to reach statistical significance. Contrary to expectations, the coefficients for the Houle and the Cederman, Gleditsch and Buhaug measures are positive, and the coefficient for Houle's measure is statistically significant. However, the results could partly be a product of sample differences in country and temporal coverage. I have thus run regressions based on the exact same sample of countries and years (reported in Table A11 in the Online Appendix). Overall, these results show that the differences in Figure 5 are not only a product of the different samples; they also reflect measurement differences. While the number of observations drops dramatically, all coefficients remain signed in the same direction, with the exception of the coefficient for Omoeva, Moussa and Hatch, which turns positive.
Replication of Alesina, Michalopoulos and Papaioannou (Reference Alesina, Michalopoulos and Papaioannou2016): ethnic inequality and GDP per capita.
Notes: Coefficients for ethnic inequality measures from OLS regressions relating the different measures of ethnic inequality and logged GDP per capita in 2000 (for the underlying full regression table, including controls, see Table A10 in the Online Appendix). Bars indicate 95 per cent confidence intervals.
Source: Based on Alesina, Michalopoulos and Papaioannou (Table 2, Model 1).

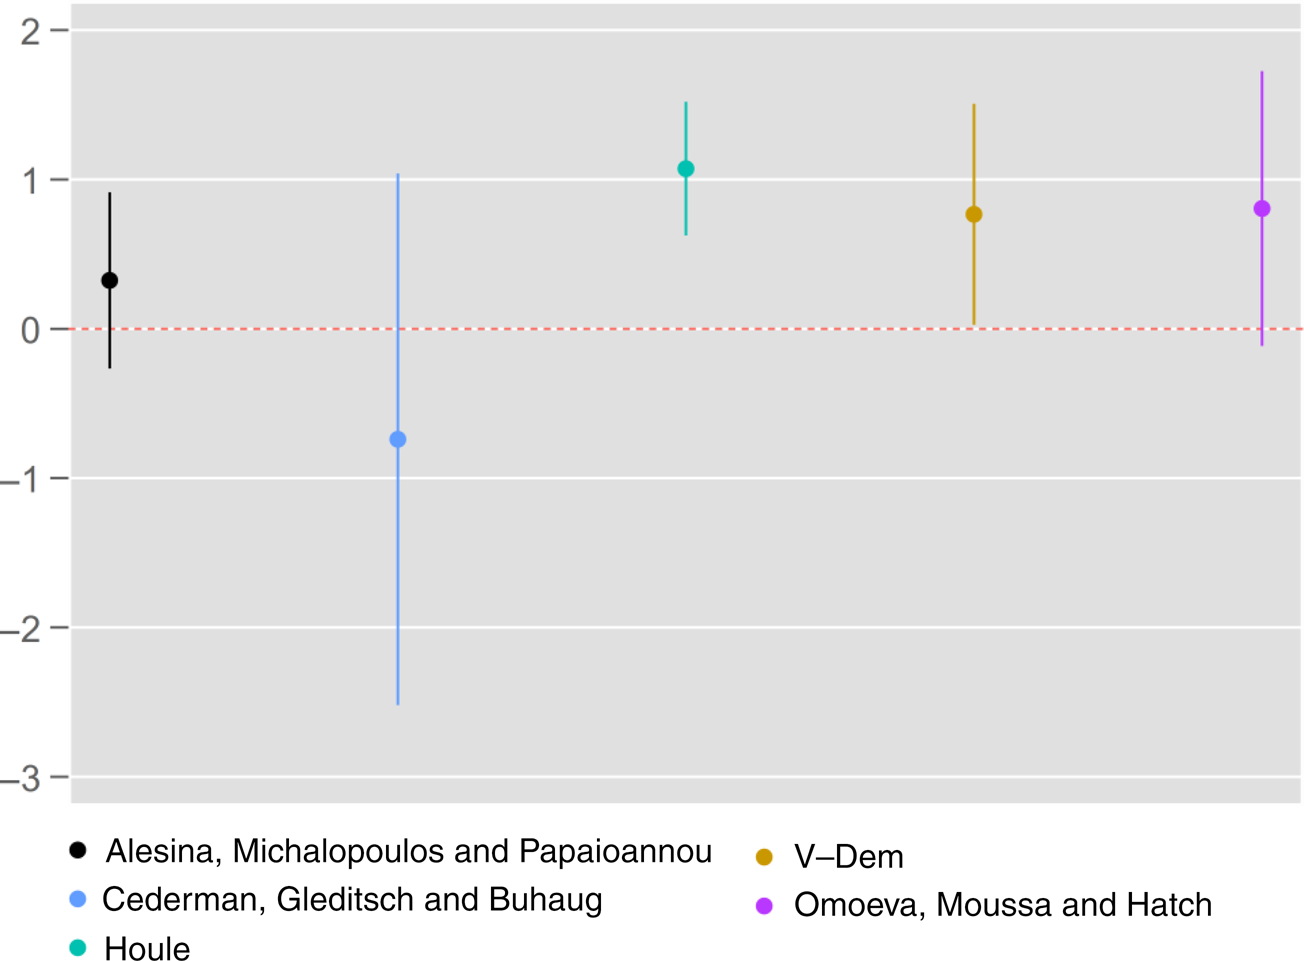
Houle (Reference Houle2015) finds that ethnic inequality (BGI) is associated at the country level with an increased risk of democratic breakdown, but only when levels of within-group inequality (WGI) are low. In Figure 6, I report the results from the probit estimations of ethnic inequality's association with democratic breakdown. Houle's hypothesis is supported if the coefficient of ethnic inequality is positive. This means that ethnic inequality increases the likelihood of democratic reversals when WGI is zero (Houle Reference Houle2015, 491). The results from Figure 6 suggest that – in addition to Houle's own measure – the measures by V-Dem, Omoeva, Moussa and Hatch, and Alesina, Michalopoulos and Papaioannou show positive associations as expected, though the latter two are not statistically significant. In contrast, the measure by Cederman, Gleditsch and Buhaug is signed negatively and is very imprecisely estimated. Again, the result may be influenced by differences in country and temporal coverage. Rerunning the analysis with a perfectly overlapping but smaller sample in Table A13 in the Online Appendix, yields similar results, with all variables being signed in the same direction as before.
Replication of Houle (Reference Houle2015): ethnic inequality and democratic breakdown.
Notes: Coefficients for ethnic inequality measures from probit regressions of relationship between various ethnic inequality measures and democratic breakdown (for the underlying full regression table, including controls, see Table A12 in the Online Appendix). Bars indicate 95 per cent confidence intervals.
Source: Based on Houle (Table 2, Model 1).

Cederman, Gleditsch and Buhaug (Reference Cederman, Gleditsch and Buhaug2013) present country-level evidence that ethnic economic inequality is associated with the risk of civil war onset. Figure 7 shows a replication of the association between the examined ethnic inequality measures and civil conflict. Although all measures are signed in the expected direction, there are important differences. The Cederman, Gleditsch and Buhaug measure is estimated precisely, whereas the others are either very close to zero (Alesina, Michalopoulos and Papaioannou; V-Dem) or have very large confidence intervals (Houle; Omoeva, Moussa and Hatch). Restricting the analysis to a smaller sample for which all measures have coverage yields somewhat similar results, with all coefficients keeping their original signs (see Table A15 in the Online Appendix).
Replication of Cederman, Gleditsch and Buhaug (Reference Cederman, Gleditsch and Buhaug2013): ethnic inequality and civil war.
Notes: Coefficients for ethnic inequality measures from logit regressions of relationship between various ethnic inequality measures and civil war onset (for the underlying full regression table, including controls, see Table A14 in the Online Appendix). Bars indicate 95 per cent confidence intervals.
Source: Based on Cederman, Gleditsch and Buhaug (Reference Cederman, Gleditsch and Buhaug2013, chapter 7, Model 7.1).

Finally, Baldwin and Huber (Reference Baldwin and Huber2010) find that economic differences between groups are negatively associated with public goods provision. In Figure 8, I show that, with the exception of Cederman, Gleditsch and Buhaug, all measures are negatively associated with public goods provision, though Houle's measure has very large confidence intervals. Since there are only 13 observations for which all measures overlap, checking this replication analysis for sample influence is more difficult.
Replication of Baldwin and Huber (Reference Baldwin and Huber2010): ethnic inequality and public goods provision.
Notes: Coefficients for ethnic inequality measures from logit regressions of relationship between various ethnic inequality measures and public goods provision (for the underlying full regression table, including controls, see Table A16). Bars indicate 95 per cent confidence intervals.
Source: Based on Baldwin and Huber (Reference Baldwin and Huber2010, Table 5, Model 4).

The findings suggest that the choice of measure has important implications for empirical analysis. The results were generally sensitive to the employed measure, indicating that the examined measures are not interchangeable.
Discussion
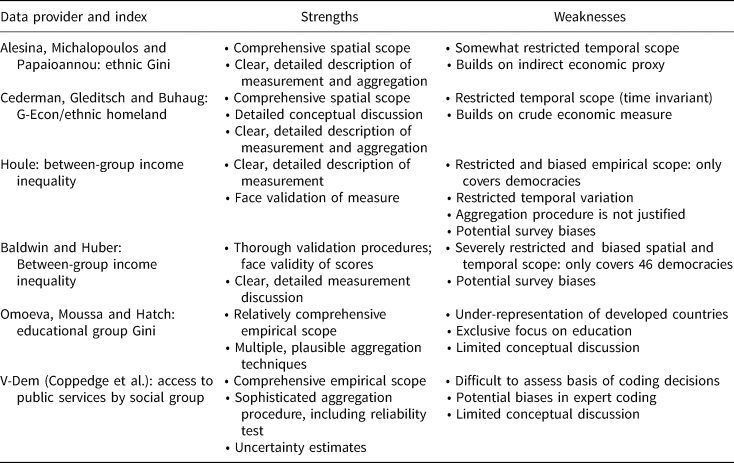
An overview of the most important strengths and weaknesses in the different datasets indicates that no measure offers a fully satisfactory response to all of the challenges of coverage, conceptualization, measurement and aggregation (see Table 4). The array of options confronts researchers with a dilemma: which measure is the most valid and reliable measure of ethnic inequality? First, the answer to this question should rest on theoretical foundations regarding a particular research question. If one is interested in mobilization patterns among severely deprived groups, the theoretical arguments would point towards measures like that of Cederman, Gleditsch and Buhaug (Reference Cederman, Gleditsch and Buhaug2013), which capture this type of socio-economic disparity. If one is interested in the causes and consequences of the entire distribution of resources between ethnic groups, the other examined measures are likely to be more appropriate. Secondly, considering the examined strengths and weaknesses in Table 4, the Alesina, Michalopoulos and Papaioannou (Reference Alesina, Michalopoulos and Papaioannou2016) and Coppedge et al. (Reference Coppedge2021a) measures appear superior in terms of capturing the overall distribution of resources while providing high empirical coverage. That said, researchers considering using one of the measures should still closely study the precise concept and measurement techniques in order to be conscious of biases and errors.
Summary of strengths and weaknesses of extant datasets

Although this article has focused on highly aggregated country-level measures, more disaggregated research designs are possible and have indeed been applied to some of the examined datasets. Cederman, Gleditsch and Buhaug (Reference Cederman, Gleditsch and Buhaug2013) and Houle (Reference Houle2015) present their country-level analyses together with group-level analyses, finding that groups with wealth levels far from the country mean are more likely to experience civil war or initiate democratic breakdown, respectively. In the same vein, group-level measures may also help track country-level developments, as illustrated by Bormann et al. (Reference Bormann2021), who use night-time luminosity data from 1992 to 2012 and a global sample of ethnic groups to show how the gap between politically marginalized groups and their included counterparts has narrowed over time.Footnote 20
To the extent that researchers are only interested in two groups – or clusters of groups (for example, politically included/excluded) – ratios of the average achievement of relevant groups constitute a straightforward and intuitive measure of inequality. That said, more aggregate measures are clearly needed if there are larger numbers of groups and we are interested in a single figure representing the entire distribution (Stewart, Brown and Mancini Reference Stewart, Brown and Mancini2010, 16). Beyond the benefits of including an additional level of analysis, more fine-grained group-level data also hold the promise of more transparency, as it becomes possible to validate the scores for individual groups (see, for example, Houle Reference Houle2015, 488–9). Even when presenting highly aggregate country-level measures, data providers should ideally also make public the underlying group-level values that were used to calculate the aggregate measures. This was found to be a clear limitation with the V-Dem data. Since questions involving ethnic inequality usually have clear group-level implications, it is often advisable to supplement country-level with group-level analyses. Not least given the discussed measurement and aggregation challenges, additional disaggregated analyses constitute one way to increase our confidence in any findings involving the examined ethnic inequality data.
Another encouraging development led by Cederman, Weidmann and Bormann (Reference Cederman, Weidmann and Bormann2015) is the introduction of a group-level composite indicator combining the strengths of three different sources of data on local wealth: the G-Econ data; survey data; and night-light emissions combined with geographical data on the settlement of ethnic groups. They weigh economic data more heavily in countries where official statistics are more trustworthy and weight night-light data more heavily where government statistics are poor or lacking. This triangulated measure has not been included in the main discussion and analysis, as it is not publicly available at the country level.Footnote 21 It nevertheless deserves mentioning because such efforts to overcome the respective weaknesses in the different data sources provide a promising avenue towards more valid and reliable measures of ethnic inequality. This avenue is particularly promising if such measures could be made available for longer time periods. Although this is likely to entail further data collection and to be resource intensive, it would allow researchers to investigate a range of new and important questions. Finally, providing triangulated measures with different aggregation procedures is crucial if such measures are to be used for broader research purposes.
An additional way forward is to combine various existing cross-national measures into a composite index. This approach relies on the reasonable assumption that socio-economic ethnic inequality is imperfectly but more or less accurately observed by the compilers of various existing datasets, and that each of them taps into a common dimension. This allows researchers to leverage the enormous effort that scholars have invested in creating an ethnic inequality measure, and it provides a way of dealing with considerable measurement error. Combining measures – based on explicit conceptual foundations – should thus help improve measurement accuracy and minimize the impact of idiosyncratic error associated with particular estimates (see Munck, Møller and Skaaning Reference Munck, Møller, Skaaning, Curini and Franzese2020, 345).
In the Online Appendix, I demonstrate this approach with an illustrative example. The resulting index provides plausible values for most countries, and when running the replication analyses with the index, it yields results in line with the original studies in three out of four cases. Since this index is only a relatively crude illustration, the approach should be further exploited using more sophisticated methods, such as latent variable models and IRT, which have been employed for other concepts that are impossible or difficult to observe directly (see, for example, Fariss Reference Fariss2014; Pemstein, Meserve and Melton Reference Pemstein, Meserve and Melton2010; Solis and Waggoner Reference Solis and Waggoner2021).
Conclusion
The literature on ethnic (or horizontal) inequalities has made a series of important contributions to political science. This research has relied on new datasets compiled by scholars creatively exploiting a range of different data sources. This article has compared extant measures, which have been used to operationalize economic and social inequality between ethnic groups at the country level. The assessment has found that measures differ in important ways. Differences in conceptualization and measurement are clearly reflected in the fact that several of the indicators do not correlate highly with each other. Indeed, many of the correlations were surprisingly weak (or even negative). Four replication analyses suggested that the choice of indicator seriously affects our empirical analyses and that the results may depend strongly on the employed indicator. As such, extant measures of ethnic inequality are generally not interchangeable.
Future research can benefit in three ways from the clarifications and critical points put forward in this assessment, which offers helpful information to data users. First, systematic information about the different strengths and weaknesses of various measures of ethnic inequality can help future data users to make conscious choices regarding what measures to use and how. Secondly, the results suggest that it might be worthwhile to re-examine many of the previous studies using the evaluated measures. Thirdly, the findings can inform the development of new measures that either rely on novel data collection or combine existing indicators in new ways.
Supplementary Material
Online appendices are available at: https://doi.org/10.1017/S000712342200014X
Data Availability Statement
Replication data for this article is available in Harvard Dataverse at: https://doi.org/10.7910/DVN/6LJEGI
Acknowledgements
I am grateful to Svend-Erik Skaaning, Kees van Kersbergen, Gerardo L. Munck, Kristian Skrede Gleditsch, Christian Houle, Kyle L. Marquardt, Jonathan Doucette, Nicholas Haas, Jacob Nyrup and Lars Johannsen, as well as the three anonymous reviewers and the editor, for highly constructive comments and suggestions.
Financial Support
None.
Competing Interests
None.