Introduction
Approximately 20% of the elderly suffers from depression, which leads to individual, family, and social impairments (Volkert et al., Reference Volkert, Schulz, Harter, Wlodarczyk and Andreas2013). Depression has been associated with the increase of disabilities, a reduction of quality of life, and higher suicide rates (Meeks et al., Reference Meeks, Vahia, Lavretsky, Kulkarni and Jeste2011). Between 2000 and 2012, it rose from the 11th to the 9th position in the Global Burden of Disease and is the leading cause of years of life lost due to disability (World Health Organization, 2014). Depression also has a profound impact on society, with medical treatments costing up to 2.6 times more when compared to individuals without this condition (Bock et al., Reference Bock2014).
Being overweight seems to be a risk factor for depressive symptoms in the elderly. A meta-analysis published in 2010 showed a dose–response relationship between overweight/obesity and the incidence of depression throughout different stages of life. Compared to individuals with normal weight, the risk of depression was 27% higher among those who were overweight and 55% higher among those with obesity (Luppino et al., Reference Luppino2010). However, this meta-analysis included studies exclusively from the United States and Europe, and most of them used exclusively the body mass index (BMI) as an indicator of body weight status. Body composition changed over the years, and the isolated use of BMI to assess the body weight status in the elderly is questionable (Villareal et al., Reference Villareal, Apovian, Kushner and Klein2005). Waist circumference (WC) has been proposed as a better indicator of body fatness because it is strongly associated with morbidity and mortality (de Hollander et al., Reference de Hollander2012). Nevertheless, two studies investigating WC and/or waist-to-hip ratio (WHR) as determinants of depression in the elderly (Australia and France) did not find any association of these indicators with the outcome (Almeida et al., Reference Almeida, Calver, Jamrozik, Hankey and Flicker2009; Akbaraly et al., Reference Akbaraly2011).
Different from developed countries, studies conducted with elderly people in Asia (China, Korea, Japan, and Taiwan) showed overweight and obesity class I having a protective effect against depressive symptoms (Li et al., Reference Li2004; Kuriyama et al., Reference Kuriyama2006; Kim et al., Reference Kim2010; Chang and Yen, Reference Chang and Yen2012; Noh et al., Reference Noh, Kwon, Park and Kim2015). These results were similar in cross-sectional and longitudinal studies (Chang and Yen, Reference Chang and Yen2012), showing a stronger effect in women (Kuriyama et al., Reference Kuriyama2006; Kim et al., Reference Kim2010). This non-linear relationship between the BMI and depression have also been observed in adults living in some high-income countries (Carpenter et al., Reference Carpenter, Hasin, Allison and Faith2000; McCrea et al., Reference McCrea, Berger and King2012; Wild et al., Reference Wild, Herzog, Lechner and Niehoff2012).
Thus, the available evidence is inconclusive about the relationship between body weight status and depression, showing remarkable differences according to age and country of origin. Furthermore, methodological limitations related to the use of self-reported data on BMI and WC are also a concern, increasing the probability of bias (Gorber et al., Reference Gorber, Tremblay, Moher and Gorber2007). Therefore, we investigated the relationship between BMI, WC, and depressive symptoms in a population-based sample of elderly people in Southern Brazil, and followed-up for four years. This study evaluates cross-sectional and longitudinal associations and investigates the possible influence of sociodemographic and behavioral confounding variables in this relationship.
Methods
Study sample
The data was derived from the Epifloripa Idoso study, a population-based cohort study of elderly people (≥ 60 years) in Florianópolis, a state capital in Southern Brazil. In 2009, the estimated elderly population in the city was 18,844 men and 25,616 women (10.9% of the 408,163 inhabitants; Brazilian Institute of Geography and Statistics, 2009). The baseline study was conducted in 2009/10, and the first follow-up occurred in 2013/14. Details of this cohort have been published elsewhere (Tessari et al., Reference Tessari, Giehl, Schneider and Gonzalez-Chica2016).
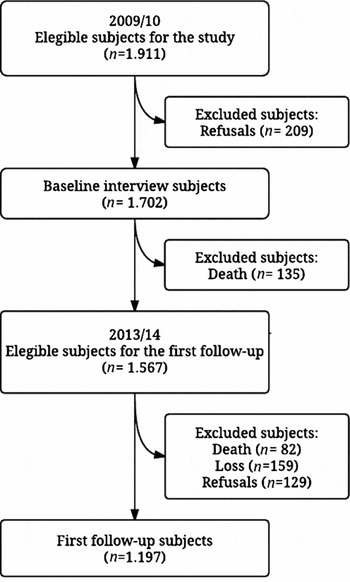
Figure 1 shows the flowchart of the sampling process and follow-up in this cohort. In the baseline, the sample size was calculated considering: an expected prevalence of 50% for the outcome, 95% confidence level, an acceptable error of 4 percentage points, a design effect of 2.0, and an additional 20% for expected losses. The sample size estimated based on these parameters was increased in 15% to improve the power of the study to test associations, resulting in a final sample of 1,599 individuals. A two-stage cluster sampling method was then used to select the participants. First, 80/420 census tracts in the city were systematically selected (stratified according to income deciles of householder). Second, 60 households were systematically selected in each sector. Considering a mean of one elderly person every 2.5 homes, it was expected to identify 1,911 individuals using this sampling process. All elderly residents in the selected households were considered eligible. A total of 1,720 individuals were interviewed in the baseline (refusal rate = 10.9%). The sampling process allowed us to obtain a self-weighted final sample with a similar age distribution compared to the target population (Table S1, available as supplementary material attached to the electronic version of this paper at https://doi.org/10.1017/S1041610216002246).
Flowchart of the sample selection from baseline (2009/10) and first follow-up (2013/14) of EpiFloripa Idoso study, Brazil.

All these members were traced in the follow-up (2013/14). Before data collection, participants' addresses were updated via phone calls, email, and/or postal letters. Deaths of cohort members up to 2014 were identified using the Mortality Information System of the Brazilian Ministry of Health. Individuals not interviewed after four attempts (in different days and times) and those hospitalised were considered losses to follow-up. The response rate in the second wave was 70.3% (n=1,197), and the mortality rate 12.7% (n=217).
The power of this study to test the association between body weight status and the incidence of depressive symptoms was estimated a posteriori, based on the available sample size in the follow-up. Considering a prevalence of obesity of 20% among elderly people (Brazilian Institute of Geography and Statistics, 2009), an expected incidence of depressive symptoms of 15% (primary outcome) (Wild et al., Reference Wild, Herzog, Lechner and Niehoff2012), a cumulative incidence ratio of 2.0, an alpha of 5%, a power of 80%, a design effect of 2.0, the available sample size was appropriate to test the proposed association.
The Epifloripa Idoso project was approved by the Ethic Committee of the University Federal of Santa Catarina (protocols no. 352/2008 and no. 526.126/2013). All participants signed the informed consent in each wave.
Data collection
All interviews were conducted at the participants' homes using pre-tested and standardised questionnaires, and the answers registered in a Personal Digital Assistant (2009/10) or a netbook (2013/14).
In both waves, the Portuguese version of the Geriatric Depression Scale (GDS) of 15 items (Almeida and Almeida, Reference Almeida and Almeida1999) was used to determine clinically significant depressive symptoms. The GDS is an instrument developed to screen depression in the elderly population, which includes yes/no questions to facilitate the use by individuals with cognitive difficulties. A score ≥6 points was considered as positive for the outcome (Almeida and Almeida, Reference Almeida and Almeida1999). Incident cases were defined as having a negative test in 2009/10 but positive in 2013/14.
Participants´ weight and height were measured by trained and standardised personnel (based on technical errors of measurement compared to a “gold standard”), using defined protocols (Lohman et al., Reference Lohman, Roche and Martorell1988). Weight was measured using a portable digital scale (Plenna, model bel-00600) with a capacity of 150 kg and a graduation of 100 g. Height was measured with a portable stadiometer with a capacity of 200 cm and a resolution of 1 mm. BMI was calculated by weight (kg) divided by the square of height (m), and then categorized into underweight (<18.5kg/m2), eutrophic (≥18.5–24.9kg/m2), overweight (≥25.0–29.9 kg/m2), obesity class I (≥30.0–34.9 kg/m2), and obesity class II–III (≥35.0 kg/m2; World Health Organization, 2015). Due to the low number underweight individuals (n=27), they were excluded from analysis.
WC was measured using a 160-cm flexible and inelastic measuring tape with a resolution of 1 mm. The measurement was undertaken at the narrowest part of the trunk. For those with non-apparent waist, the measurement was made at the midpoint between the iliac crest and the lowest rib. WC was categorised into quartiles for analysis in both waves. The recommended World Health Organization cut-off points for WC (≥80 or ≥88 cm in women, and ≥94 or ≥102 cm in men) were not used due to the lack of consensus about their use in different ethnic groups, overestimating in more than 30% the prevalence of abdominal obesity among Latin-American women (Vianna et al., Reference Vianna, da Silva and Bielemann2014).
Sociodemographic and behavioral variables were included as possible confounders (Luppino et al., Reference Luppino2010). The collected sociodemographic variables were gender (male and female); age (60–64, 65–69, 70–74, and ≥75 years); education (0–8 and ≥9 years); per capita household income (tertiles); marital status (married, separated/widowed/divorced, and single); and self-reported skin color, collected according to the classification of the Brazilian Institute of Geography and Statistics (white, brown, black, indigenous, and Asiatic), and categorized as dichotomous for analysis (white and other color). The lifestyle variables included smoking (never, former, and current smoker); alcohol consumption (none and moderate/excessive consumption), evaluated using the Alcohol Use Disorders Identification Test; physical activity (≥150 or <150 minutes per week of moderate to vigorous physical activity) evaluated through the International Physical Activity Questionnaire (Craig et al., Reference Craig2003); fat intake of red meats and chicken (not consumed and consumed 1–7 times a week); and regular consumption of vegetables and fruits (≤ 6 and 7 times a week), both evaluated using a semi-qualitative food frequency questionnaire. The variable fat intake of meats was created based on four different questions assessing the weekly frequency of red meat and chicken consumption, and whether the participant used to consume the visible fat in red meats or chicken skin.
Statistical analysis
Relative frequencies of depressive symptoms were estimated (prevalence in 2009/10 and cumulative incidence between 2009/10 and 2013/14) with their respective confidence intervals (95% CI).
Bivariate associations between the outcomes (prevalence or incidence of depressive symptoms) and the independent variables (categorical BMI and WC) and possible confounders (sociodemographic and behavioral variables) were evaluated using the χ 2 test with Rao–Scott correction. Tests for heterogeneity or trend were used accordingly.
Multiple logistic regression models were fitted to determine the cross-sectional association between BMI, WC, and the prevalence of depressive symptoms in 2009/10. For longitudinal analysis, multiple logistic regression was used to examine the effect of body weight status at baseline on the incidence of depressive symptoms, separately for BMI and WC. A hierarchical model was used to adjust the models for possible confounders. The first level included demographic variables, the second level socioeconomic variables, the third level lifestyle variables, and the fourth level the primary exposure (BMI and WC). BMI and WC were not mutually adjusted due to the high collinearity between them. A backward selection method by hierarchical level was used to identify the possible confounders. Variables remained in the model when they were associated with the outcome at a p-value ≤0.20. Normal weight (BMI ≥18.5–24.9kg/m2) and the first quartile of WC (F: ≤84.0; M: ≤88.1) were used as the reference groups in the logistic regression models.
The level of statistical significance for association was fixed at 5%. Based on the evidence from previous studies, (Luppino et al., Reference Luppino2010; McCrea et al., Reference McCrea, Berger and King2012) gender, age and education were tested as potential effect modifiers. Interaction terms between these covariates and the primary exposure variables were included in the regression models, and a p-value ≤0.10 was considered indicative of heterogeneity. Statistical analysis was performed using the statistical software Stata 13.0 (Stata Corporation, College Station, United States). All analyses were estimated using sampling weights and the sample design.
Results
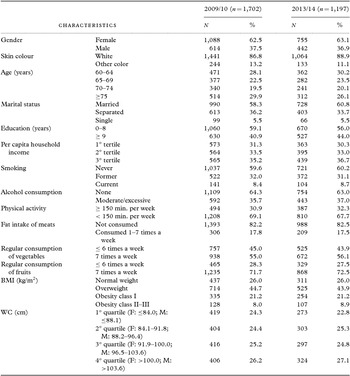
Sociodemographic characteristics, behavioral variables, BMI, and WC of the participants in the two waves are shown in Table 1. There were no differences among the individuals interviewed (70.3%) and not interviewed in 2013–14 regarding gender (p=0.36), household income (p=0.19), lifestyle variables (except physical activity level, p=0.04), BMI (p=0.38) or WC (p=0.23). For the other sociodemographic variables, none of them showed a difference higher than four percentage points between 2009/10 and 2013/14.
Sociodemographic characteristics, lifestyle habits, body mass index, and waist circumference in 2009/10 and 2013/14

BMI: body mass index; WC: waist circumference; F: female; M: male.
In 2009/10, the mean BMI for men was 26.9±4.2 kg/m2 and for women 28.5±5.3 kg/m2, whereas WC values were 97.0±11.9 cm and 92.7±13.2 cm, respectively. A similar pattern was observed in 2013/14. Men showed lower BMI (27.2±4.2 kg/m2 compared to 28.6±5.7kg/m2 in women) and higher WC (98.8±11.5 cm compared to 93.3±13.4 cm in women; p < 0.01 for all comparisons).
The baseline prevalence of depressive symptoms was 23.3% (95% CI 20.3–26.6) and cumulative incidence over the follow-up period was 10.9% (95% CI 8.7–13.6). Females showed higher prevalence (25.4%; 95% CI 21.8–29.3; p <0.01) and incidence (13.0%; 95% CI 10.1–16.6; p=0.03) than males (19.9%; 95% CI 16.6–23.7 and 7.7%; 95% CI 5.0–11.6, respectively). Among individuals positives for depressive symptoms at baseline, 44.5% (95% CI 35.3–54.0) (n=107) reverted to not depressed in 2014 (reverse incidence), but neither BMI (p=0.57) nor WC (p=0.22) were associated with this outcome.
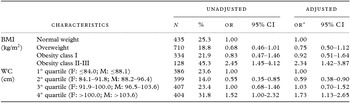
Findings from cross-sectional analyses are shown in Table 2. Prevalence of depressive symptoms was lower among elderly with overweight and those in the second quartile of WC. Nevertheless, it was higher among individuals with obesity class II–III and those in the upper quartile of WC. Eutrophic people and those in the lower quartile of WC had intermediate prevalence of depressive symptoms. Adjustment for sociodemographic and behavioral variables produced just a slightly change in the results when compared to crude analyses. Odds of prevalence of depressive symptoms was 134% higher in individuals with obesity class II-III than the eutrophics (p <0.01), and being overweight was not associated with depressive symptoms. Adjusted results for WC showed a similar pattern; the elderly in the upper quartile had a 73% increased risk of being depressed compared to those in the lower quartile, but intermediate WC values (second quartile) were associated with 41% lower odds of prevalence (p <0.01).
Crude and adjustedFootnote a odds ratio of the association between body mass index, waist circumference, and the prevalence of depressive symptoms in the elderly (cross-sectional analysis in 2009/10)

OR: odds ratio; BMI: body mass index; WC: Waist circumference; F: female; M: male.
a Adjusted for variables that presented p-value < 0.20 in the association with the outcome: age, skin color, marital status, education, per capita household income, alcohol consumption, physical activity, fat intake of meats, and regular consumption of vegetables. All confounding factors are from the baseline study (2009/10).
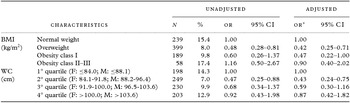
Table 3 shows the results of the longitudinal analysis. Similar to the prevalence findings, the incidence of depressive symptoms was lower among individuals with overweight and those in the second quartile of WC (7.0%). However, bottom and top categories of BMI and WC showed both a similar higher incidence of depressive symptoms. After adjustments for confounders, both overweight and obesity class I were associated with at least 50% lower odds of incidence of depressive symptoms compared to the eutrophics (p <0.01). However, the risk in the obesity class II–III group was similar to the reference category. The results for WC were similar, and the elderly in the second quartile had a 57% decreased odds of incidence of being depressed than those in the first quartile of WC (p=0.03).
Crude and adjustedFootnote a odds ratio of the association between body mass index, waist circumference and the incidence of depressive symptoms in the elderly (2010–14)

OR: odds ratio; BMI: body mass index; WC: Waist circumference; F: female; M: male.
a Adjusted for variables that presented p-value < 0.20 in the association with the outcome: gender, age, per capita household income, fat intake of meats and regular consumption of fruits. All confounding factors are from the baseline study (2009/10).
There was no evidence of heterogeneity in the associations according to gender, age, or educational level. Full models (including all possible confounding factors and interaction terms) for the cross-sectional analysis showed a determination coefficient (r 2) of 11% in the model including BMI and 12% with WC. The corresponding values of the Bayesian Information Criterion (BIC) were 53,230 and 54,943. The final models including only confounding variables and the primary exposures showed an r2 of 10% for both BMI and WC. For the longitudinal analysis, full models showed an r 2 of 13% for the model with BMI and 11% when WC was analyzed as the primary independent variable. The BIC were 17,481 and 18,059, respectively. The final models including only confounding factors and primary exposure variables showed a slight reduction in the explained variance (r 2 of 9% and 8%, respectively).
Tables S2 and S3 show odds ratios of all variables included in the final models for the prevalence and incidence of depressive symptoms.
Discussion
To our knowledge, this is the first study investigating cross-sectional and longitudinal associations between body weight status and depressive symptoms in a cohort of elderly people in Brazil, a middle-income country.
A non-linear relationship between body weight status and depressive symptoms was observed for both, prevalence and incidence, with intermediate levels of BMI and WC associated to lower frequencies of the outcome. These results are consistent with Asiatic studies (China, Korea, Japan, and Taiwan), in which elderly people with overweight and/or mild obesity had a frequency of depressive symptoms 22–40% lower than those with normal weight/WC (Li et al., Reference Li2004; Kuriyama et al., Reference Kuriyama2006; Kim et al., Reference Kim2010; Chang and Yen, Reference Chang and Yen2012). Although a meta-analysis including elderly people from developed high-income countries showed a positive relationship between BMI and the incidence of depression (Luppino et al., Reference Luppino2010), studies with adults from these countries have shown similar results to those found in Asia (Carpenter et al., Reference Carpenter, Hasin, Allison and Faith2000; McCrea et al., Reference McCrea, Berger and King2012; Wild et al., Reference Wild, Herzog, Lechner and Niehoff2012). The lower risk of depressive symptoms among individuals with overweight is supported by the “jolly fat” hypothesis (Crisp and McGuiness, Reference Crisp and McGuiness1976). What this hypothesis suggests is in some cultures overweight is considered an indicator of opulence, better self-esteem, and happiness (Li et al., Reference Li2004). Our results also support the obesity paradox hypothesis, which holds a lower mortality risk among those with elevated BMI compared to normal-weight individuals, mainly in the elderly. Different mechanisms have been proposed, and apparently some independent components of obesity would be responsible for this protective effect (Oreopoulos et al., Reference Oreopoulos, Kalantar-Zadeh, Sharma and Fonarow2009).
Although the incidence of depressive symptoms was similar in both normal and severely obese individuals, the prevalence of depression was higher among individuals with severe obesity (obesity class II–III and WC in the upper quartile). A possible explanation for these findings is a greater severity and lower recovery of depressive symptoms among individuals with a higher level of obesity. Individuals with severe obesity have a higher frequency of chronic diseases, impairment of their quality of life, and reduced mental health, which may compromise the recovery from depressive symptoms (Luppino et al., Reference Luppino2010; Meeks et al., Reference Meeks, Vahia, Lavretsky, Kulkarni and Jeste2011; Volkert et al., Reference Volkert, Schulz, Harter, Wlodarczyk and Andreas2013; Tessari et al., Reference Tessari, Giehl, Schneider and Gonzalez-Chica2016). Furthermore, the stigma and discrimination faced by individuals with severe obesity (Jackson et al., Reference Jackson, Beeken and Wardle2015) could aggravate this situation, generating greater psychological distress, low self-esteem, and body image dissatisfaction (de Souto Barreto et al., Reference de Souto Barreto, Ferrandez and Guihard-Costa2011). These factors are apparently more evident in high- than in middle-income countries due to the most prevalent anti-fat attitudes (Crandall et al., Reference Crandall2001). Therefore, differences in social pressure and stigma against obesity could explain the discrepancies in this study with those from high-income countries (Luppino et al., Reference Luppino2010).
These explanations are consistent with our data of higher prevalence but not the incidence of depressive symptoms among those with severe obesity when compared to the eutrophics. In our study, the proportion of persistent cases of depressive symptoms (GDS positives in 2009 and 2014) were 25% more frequent among those with severe obesity than in normal weight individuals (data not shown in tables). The persistence of depressive symptoms could make therapeutic interventions for obesity and other chronic conditions more difficult to get managed, resulting in increased morbidity and mortality (Meeks et al., Reference Meeks, Vahia, Lavretsky, Kulkarni and Jeste2011). Therefore, these results are particularly relevant and suggest secondary benefits for the implementation of strategies to prevent higher levels of obesity in the elderly.
Due to age-related changes in body composition, the use of BMI alone is limited (Villareal et al., Reference Villareal, Apovian, Kushner and Klein2005). Thus, a combined use with WC to evaluate body weight status is recommended because it is strongly correlated with visceral fat and chronic diseases morbidity and mortality (de Hollander et al., Reference de Hollander2012). In our results, BMI and WC showed a similar effect on the incidence of depressive symptoms. The only available longitudinal study that concomitantly analyzed the effects of more than one obesity indicator (BMI, WC, and WHR) on the incidence of depression was conducted in an Australian cohort of elderly men followed-up for ten years (Almeida et al., Reference Almeida, Calver, Jamrozik, Hankey and Flicker2009). All these variables suggested that obesity increases the risk of depression, but only the association with the BMI was statistically significant (hazard ratio 1.31, 95% CI 1.05; 1.64). However, all the exposure variables were analyzed as binary, affecting the capacity of that study of assessing the effects of different stages of obesity on the incidence of depression. Therefore, the comparison with our results should be carried out cautiously.
Finally, neither gender and education, nor age modified the effect of the associations, following the conclusions of the meta-analysis cited previously and other subsequent studies (Luppino et al., Reference Luppino2010; Akbaraly et al., Reference Akbaraly2011; McCrea et al., Reference McCrea, Berger and King2012). Nevertheless, some studies identified gender as a source of heterogeneity (Li et al., Reference Li2004; Kuriyama et al., Reference Kuriyama2006; Kim et al., Reference Kim2010; Chang and Yen, Reference Chang and Yen2012), probably as a consequence of a higher frequency of body image dissatisfaction and perceived weight discrimination among women with obesity (de Souto Barreto et al., Reference de Souto Barreto, Ferrandez and Guihard-Costa2011). The statistical power of our study was probably insufficient to identify this and other possible sources of heterogeneity. Nevertheless, neither of the statistical methods used in the analyses (p-value <0.10, r 2, BIC) suggested such a possibility.
Our study has some limitations. GDS was used to evaluate clinically significant depressive symptoms and is not comparable with a diagnosis of depression based on clinical assessment. Additionally, people with depression can achieve remission even without treatment and depressive symptoms can fluctuate over time (Burns et al., Reference Burns, Butterworth, Luszcz and Anstey2013). Therefore, the true incidence of depressive symptoms after four years of follow-up does not represent the real number of individuals who developed this condition. There is also the possibility of survival bias, as the prevalence of depressive symptoms among deaths (50.1%) was twice higher than among the survivors in this cohort. However, the body weight status was similar between them (p=0.73). Therefore, it is unlikely that these possible sources of bias could explain our results. Some possible confounders were not included in the analysis because they were not collected in this cohort, such as the quantity of fruits and vegetables consumed per day and the use of antidepressants. This analytic problem was partially overcome by using the daily frequency of fruit and vegetables consumption as a diet indicator, even though this variable has a lower specificity in the identification of individuals with a real healthy habit. However, some residual confounding is expected in the final models due to the lack of adjustment for the use of antidepressants, as this variable has been associated with body weight changes (Serretti and Mandelli, Reference Serretti and Mandelli2010). Finally, the variable skin color was analyzed as white or another color (including brown, black, indigenous, and Asiatic), which could be considered as another possible source of bias because of the variation in the suggested cut-off for different ethnic groups (Vianna et al., Reference Vianna, da Silva and Bielemann2014). Nevertheless, we do not expect this affected our results, as the prevalence of Asiatic and indigenous in the sample and in the target population (Brazilian Institute of Geography and Statistics, 2009) is very low (<2%).
Our study found the relationship between body weight status and depressive symptoms in elderly people was not linear. Overweight and intermediate values of WC were associated with lower incidence of depressive symptoms. Therefore, the health benefits of intentional weight loss among elderly people are questionable and uncertain. This reinforces the need for public health strategies to monitor unintentional and voluntary weight loss in the elderly. In contrast, the higher prevalence of depressive symptoms among individuals with severe obesity enhances the relevance of public health strategies to prevent this condition. This could contribute to the reduction of depressive symptoms in elderly people, improve adherence to chronic disease management, and enhance the quality of life.
Conflict of interest
None.
Description of authors’ roles
V.F. Goes designed the study, wrote the manuscript, carried out the statistical analysis, and revised the manuscript. E. Wazlawik assisted with writing, revised, and approved the article. E. D'Orsi supervised the data collection and reviewed the manuscript. D.A. González-Chica oversaw the study and revised both the statistical analysis and the manuscript.
Acknowledgments
We thank the participants, employees, and researchers of the EpiFloripa Idoso study. The study was sponsored by the Brazilian National Council for Scientific and Technological Development (CNPq), grant number 569834/2008. We also thank the Brazilian Institute of Geography and Statistics (IBGE) and the Health Authority staff of Florianópolis for their support with the practical aspects of the study. The main author received a doctoral scholarship from the Coordination for the Improvement of Higher Education Personnel (CAPES) during this work.
Supplementary material
To view supplementary material for this article, please visit https://doi.org/10.1017/S1041610216002246.