Implications
This report displays the muscular in vivo proteome dynamics after the acquisition of the total number of muscle fibres, and during fibre differentiation and maturation. Amongst the 496 spots detected, the profile of 169 identified proteins was reported. This constitutes a consistent dataset of proteins involved in muscle differentiation. In complement with an earlier study concerning the proteome dynamics of proliferating myoblasts (Chaze et al., Reference Chaze, Meunier, Chambon, Jurie and Picard2008), this work constitutes a new milestone to understand differences in muscle development of animals presenting particularities. Indeed, understanding the muscular development of animals presenting muscular hypertrophy or animals bred in particular conditions or cloned animals is of particular interest for the bovine industry.
Introduction
Managing meat quality goes through a good understanding of the ontogeny of muscle characteristics linked to metabolic and contractile properties. In cattle, as in other vertebrates, each skeletal muscle is composed of a variable number of contracting fibres. This heterogeneity is not restricted to the postnatal life but also occurs during foetal life. This is particularly true for cattle muscle, which is very mature at birth compared to other species (Picard et al., Reference Picard, Lefaucheur, Berri and Duclos2002). The total number of fibres (TNF) is fixed since the end of the two first thirds of gestation, around 180 days post conception (dpc) (60% of the foetal life). In pig, for example, the TNF is fixed by 80% of gestation (Wigmore and Stickland, Reference Wigmore and Stickland1983). In rodent, the TNF is definitively determined during the first month after birth (Nougués, Reference Nougués1972).
In cattle, the last trimester of gestation is characterized by intense contractile and metabolic differentiation. The works of Gagnière et al. (Reference Gagnière, Picard and Geay1999) and Picard et al. (Reference Picard, Jurie, Duris and Renand2006) have demonstrated that the proportion of the developmental Myosin heavy chain isoforms (MyHC: embryonic, foetal, alpha-cardiac, etc.) decreased during this period as they are progressively replaced by the adult fast MyHCs. The slow isoform of MyHC is expressed earlier, as it is observed in myotubes since 30 days of gestation but only in the first generation since 180 days. Later, this isoform is also present in fibres from the secondary and tertiary generations in fibres, which will be type I in the adult muscle. At 3 weeks after birth, fibres of cattle muscle contain only adult MyHC isoforms I, IIa and IIx (Picard et al., Reference Picard, Jurie, Duris and Renand2006). Hence, during the last trimester we observed changes in the expression of MyHC isoform with the gradual disappearance of development isoforms and an increase in the expression of adult isoforms. In most other species, particularly in rodents, the different generations of fibres contain only developmental MyHC isoforms at birth, which are gradually replaced by adult ones during the first months after birth (Cho et al., Reference Cho, Hughes, Karsch-Mizrachi, Travis, Leinwand and Blau1994). Consequently, the contractile differentiation of cattle is particularly advanced at birth as in sheep (Maier et al., Reference Maier, McEwan, Dodds, Fischman, Fitzsimons and Harris1992) and human (Shrager et al., Reference Shrager, Desjardins, Burkman, Konig, Stewart, Su, Shah, Bricklin, Tewari, Hoffman, Rickels, Jullian, Rubinstein and Stedman2000). During the last trimester in cattle, we also observed an important increase in the activities of enzymes from glycolytic and oxidative metabolisms (Gagnière et al., Reference Gagnière, Picard and Geay1999). Muscles can be differentiated on their metabolic properties from 180 to 210 days of foetal life in cattle but only during the month after birth in chickens, rats, rabbits and pigs (Picard et al., Reference Picard, Jurie, Cassar-Malek, Hocquette, Lefaucher, Berri, Duclos, Alami-Duarte and Rescan2003). In cattle, all future type I fibres exhibit an oxidative metabolism from 210 days of gestation. For IIA fibres, the oxidative metabolism increases during the last trimester and all IIA fibres have an oxidative metabolism at birth (Picard et al., Reference Picard, Jurie, Duris and Renand2006). Also, the activity of enzymes from glycolytic metabolism increases during this period and it is associated with changes in isoform expressions, e.g. lactate dehydrogenase (LDH) isoforms were converted from cardiac to skeletal (Picard et al., Reference Picard, Jurie, Duris and Renand2006).
As contractile and metabolic properties play an important role in sensorial and nutritional qualities of bovine meat (Geay et al., Reference Geay, Bauchart, Hocquette and Culioli2001), the precise knowledge of the development of these properties and the mechanisms of control involved is necessary to understand how we can manage muscle differentiation to produce muscles with a good potential for beef production. The aim of this study was to analyse the modifications of the proteome of the Semitendinosus (ST) muscle of Charolais foetuses aged at 180, 210 and 260 dpc. This will allow us to have a complete description of the modifications of protein profiles during the differentiation phase and to reveal some proteins involved in the control of differentiation. This will complete an earlier study concerning the early stages of bovine myogenesis from 60 to 180 dpc, corresponding to proliferation stages (Chaze et al., Reference Chaze, Meunier, Chambon, Jurie and Picard2008).
Muscle development strategies are generally conserved among mammals (Picard et al., Reference Picard, Lefaucheur, Berri and Duclos2002), so our results could provide original data for the studies of muscle differentiation in different species for agronomical or human medical applications.
Material and methods
Chemical agents and apparatus
Acrylamide, bis-acrylamide, immobilized pH gradient (IPG) buffers, N,N,N′,N′-Tetramethylethylenediamine, N,N,N′,N′-Di-(dimethylamino)ethane, N,N,N′,N′-Tetramethyl-1-,2-diaminomethane, ammonium persulfate, 4–7 pH range strips, scanner and image analysis software ImageMaster 2-DE Platinum were from Amersham (Uppsala, Sweden). Chemical reagents such as urea, thiourea, 1,4-Dithiothreitol (DTT), iodoacetamide, 3-[(3-Cholamidopropyl)dimethylammonio]-1-propanesulfonate and Coomassie Brilliant Blue were from Sigma (St Louis, MO, USA). The Protean IEF Cell and Protean Plus Dodeca Cell electrophoresis apparatus were from Bio-Rad (Hercules, CA, USA). Antibodies: anti-Desmin was from Dako (Dako Carpenteria, CA, USA), anti-HSP27, anti-Annexin, anti-Myosin foetal, anti-Creatine kinase B and anti-Calponin 3 were from Santacruz Biotechnology (Santa Cruz, CA, USA), Anti-Troponin-3, anti-CLIC1, anti-Enolase 3, anti-MyBP H were from AbNOVA Corp (Taipei, Taiwan), Anti-galectin was gifted by Raymonde Joubert-Caron (LBBP, Université Paris 13, France). Anti-ApoA1 was gifted by Dominique Gruffat (INRA, URH, Theix, France). Secondary antibodies were from GE Healthcare (Uppsala, Sweden).
Animals and muscle samples
Charolais (the first French beef breed) foetuses were generated by artificial insemination of Charolais cows with Charolais bull sperm. Foetuses were collected from cows slaughtered at the Institut National de la recherché Agronomique (INRA) experimental abattoir at 180 (n = 4), 210 (n = 4) and 260 (n = 4) dpc. Length and weight of foetuses were recorded and the entire ST muscle was removed, with ST weight, length and cross-sectional area recorded at all the three stages. Samples of ST for histology and immunohistochemistry were progressively frozen by immersion in isopentane cooled over liquid nitrogen and stored at −80°C (Gagnière et al., Reference Gagnière, Picard and Geay1999). Samples of ST for proteomic analysis were frozen directly in liquid nitrogen and stored at −80°C until protein extraction (Bouley et al., Reference Bouley, Chambon and Picard2004). Irrespective of the developmental stage, all ST samples were taken in the middle of the ST length and width.
Histology and immunohistochemistry
Transverse serial sections of ST muscle, 10 μm in thickness, were obtained using a cryostat microtome at −25°C. The sections were stained with Azorubine dye, which stains the myofibrillar proteins red, as described earlier in Picard et al. (Picard et al., Reference Picard, Jurie, Duris and Renand2006). The mean cross-sectional area of fibres was determined using Visilog software (Noesis, Gif sur Yvette, France). The MyHC isoforms were revealed by electrophoretic separation on their molecular weights with two complementary techniques. The method of Talmadge and Roy (Reference Talmadge and Roy1993) allows the separation of developmental isoforms and not of adult ones. The modified technique of Talmadge and Roy (Picard et al., Reference Picard, Barboiron, Chadeyron and Jurie2007) separates all the isoforms, developmental and adult.
Metabolic enzyme activities
The activity of Isocitrate dehydrogenase (ICDH), specific of oxidative metabolism, and that of LDH, representative of glycolytic metabolism, were measured according to the protocol of Briand et al. (Reference Briand, Talmant, Briand, Monin and Durand1981) and Ansay (Reference Ansay1974), respectively. Statistical analysis of metabolic enzyme activities between stages was performed as described in Jurie et al. (Reference Jurie, Picard, Hocquette, Dransfield, Micol and Listrat2007).
Protein extraction
All protein samples were handled at 4°C to preserve the samples from proteolytic activity. Muscle proteins were extracted from muscle sample as described in Bouley et al. (Reference Bouley, Chambon and Picard2004). Pieces of muscle were selected in order to have as less collagen as possible. An average of 6.8 μg/μl (±1.45 μg/μl) was determined using the two-dimensional gel electrophoresis (2-DE) Quant kit (Amersham).
Two-dimensional gel electrophoresis
Isoelectrofocalisation (IEF) steps were carried out with 18-cm-long IPG strips, pH range 4–7. The method used was described earlier by Bouley et al. (Reference Bouley, Chambon and Picard2004) with the exception that after a desalting step (50 V, 7 h) proteins were separated according to the following conditions: 200 V for 1 h, 200 V increasing to 8000 V over 5 h, 8000 V continuously until 73 500 Vh.
SDS-PAGE (T = 12%) was run on a Protean Plus Dodeca cell system (Bio-Rad, Hercules, USA) at 15 mA/gel and 110V until the Bromophenol blue migration front reached the bottom of all gels. Four foetuses per stage were represented across four 2-DE gels each, such that a total of 48 gels were run.
Protein coloration
The 2-DE gels were stained with G250 Colloidal Coomassie Blue for 72 h as described earlier in Bouley et al. (Reference Bouley, Chambon and Picard2004). After staining, gels were rinsed for 1 h in fresh distilled water before digitization.
Image analysis
The 2-DE gels were scanned using LabScan v.5.0 software at 300 dpi (dot per inch) with an optical density calibrated ImageScanner (Amersham, Uppsala, Sweden). Spot detection and volume quantification were realized with ImageMaster 2-DE Platinum software. Protein spots from the three stages were matched to a single reference gel. The reference gel was a physical gel conducted with an identical amount (in weight) of muscle protein pooled from all samples analysed.
Data analysis
Profile exploration
In order to group proteins presenting similar expression profiles across the three stages of myogenesis examined, hierarchical clustering analysis (HCA) was used. Raw data from ImageMaster 2-DE software were first imported and pre-processed to allow comparisons of the proteome between all the levels. The data matrix was normalized (%volume) according to the mean volumes of the 110 protein spots, which were strictly common to all myogenic stages. The mean volumes of these 110 spots were not significantly different between levels, which justify this method of normalization.
Missing values and protein profile normalization were managed as described earlier (Meunier et al., Reference Meunier, Dumas, Piec, Bechet, Hebraud and Hocquette2007). Briefly, to achieve comparable profiles, each protein value (%volume) was divided (then logged) by the mean of all replicate values of this protein. HCA was then conducted using freely available PermutMatrix v.1.8.5 software (Caraux and Pinloche, Reference Caraux and Pinloche2005). HCA of the quantitative matrices was processed according to the Pearson distance. The Ward aggregation procedure was then used to construct the resulting dendrogram, as described in Meunier et al. (Reference Meunier, Dumas, Piec, Bechet, Hebraud and Hocquette2007).
Statistical validation of clusters
To analyse protein abundance variations during the three levels more precisely, and to give more weight to protein clustered in HCA, the Student–Newman–Keuls (SNK) test was conducted with SAS software package (SAS Institute, Cary, NC, USA). Differences in protein expressions were significantly different at p < 0.05.
Protein identification by mass spectrometry
Coomassie stained spots of interest were excised by hand and placed in a Multiscreen solvinert 96-well filtration system plate (Millipore Corp., Bedford, MA, USA). This plate allowed spot destaining and acetonitrile (ACN) drying. Digestion, in the plate, proceeded at 37°C over 5 h with three volumes of trypsin (10 ng/μl, V5111; Promega, Madison, WI, USA). About 8–12 μl of ACN (depending on gel volume) was added to extract the peptides. Trypsin digested peptide solution was diluted in an equal amount of matrix (5 mg/ml alpha-cyano-4-hydroxycinnamic acid in 50% ACN/0.1% Trifluoroacetic acid). Peptide mass fingerprints (PMF) of trypsin-digested spots were determined in a positive reflectron mode using a Voyager DE Pro Matrix Assisted Laser Desorption Ionization-Time of Flight (MALDI-TOF) mass spectrometer (Perspective Biosystems, Farmingham, MA, USA). External calibration was performed with a standard peptide solution (Proteomix; LaserBio Labs, Sophia-Antipolis, France). Internal calibration was performed using peptides resulting from autodigestion of porcine trypsin with protonated masses of 842.509, 1045.564 and 2211.104 Da. PMF were compared to Bos taurus nrNCBI databases (05/2007, 50203 seq) using MASCOT 2.1 software. PMF of unidentified proteins (using bovine database) were compared to the nrMammalia database (06/2007, 819370 seq). The search criteria used were one missing trypsin cleavage site, partial methionine oxidation, partial carbamidomethylation of cysteine and a mass deviation lower than 30 ppm. We required at least five matched peptides per protein for identification and used MASCOT probabilistic scores, accuracy of the experimental theoretical isoelectric point (pI) and molecular weight (MW).
Gene ontology
The Babelomics Fatigo+ tool was used to describe our data from clustering with the control vocabulary of gene ontology (GO). All proteins expressed at individuals stages of myogenesis, and groups of protein clusters exhibiting the same expression profile across the three stages of myogenesis were submitted to Fatigo+ (http://babelomics.bioinfo.cipf.es/fatigoplus/cgi-bin/fatigoplus.cgi). Proteins expressed during myogenesis were then described by GO controlled vocabulary and grouped accordingly.
Western blot validation
Variations in protein expression profiles were validated using a quantitative western blot technique with, if possible, two proteins per cluster tested. Total protein extracts used in the 2-DE experiments were further homogenized in 2% SDS, 10% glycerol, 63 mM Tris (pH 6.8) and 1% DTT buffer. In all, 1 μg of protein was separated in 1D in a 15% polyacrylamide gel at 120 V, at 4°C. Proteins were transferred to PVDF (polyvinylidene fluoride) membranes, blocked in milk blocking buffer and then incubated with primary antibodies against ((initial concentration given by manufacturer)/appropriate dilution): Desmin ((230 μg/ml)/1:1000), HSP27 ((200 μg/ml)/1:5000), Calponin 3 ((200 μg/ml)/1:1500), Enolase 3 ((1000 μg/ml)/1:1000), Creatine kinase B ((200 μg/ml)/1:500), Troponin T (TnT) ((1000 μg/ml)/1:100), ApoA1 ((unknown initial concentration)/1:2000), Annexin V ((200 μg/ml)/1:1500), MyBP H ((1000 μg/ml)/1:500), HSP709b ((1000 μg/ml)/1:1000), Peroxiredoxin 6 ((262 μg/ml)/1:1000). The membranes were then incubated with anti-mouse or anti-rabbit horseradish peroxidase-conjugated secondary antibodies ((unknown initial concentration)/both 1:1000) and immunoreactive proteins were detected using enhanced chemiluminescence (ECL; Amersham).
Results
Foetus and Semitendinosus muscle observations
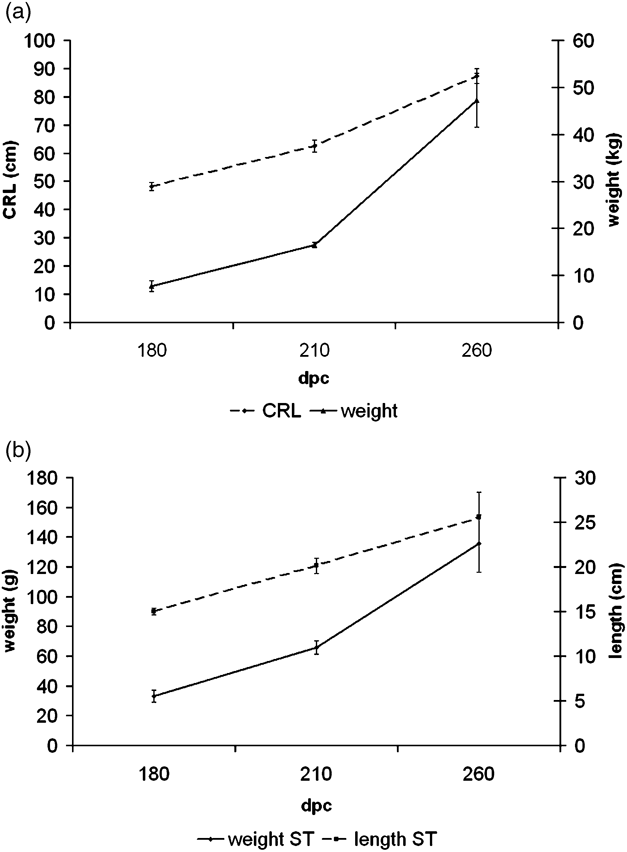
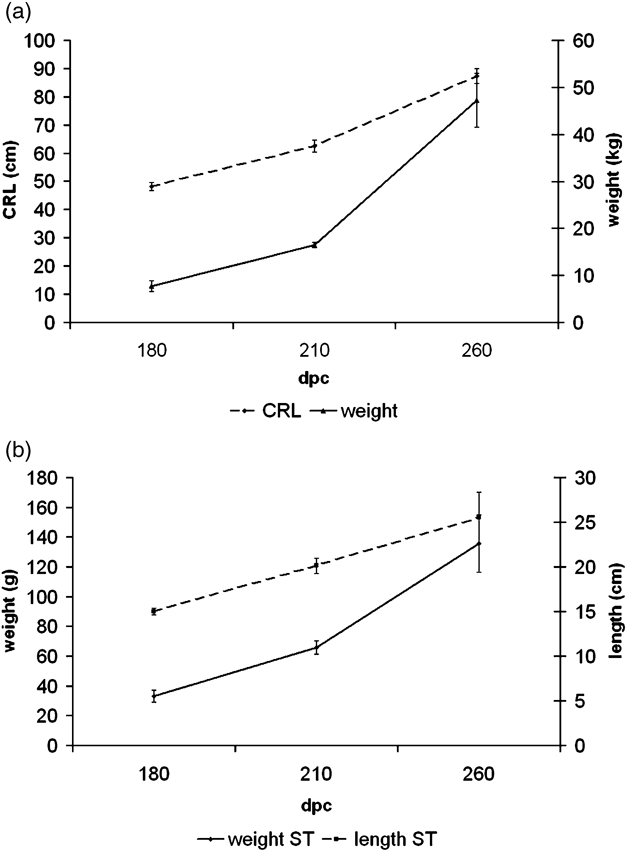
Foetal weight and crown rump length (CRL) increased 6.05-fold and 1.8-fold, respectively, between 180 and 260 dpc (Figure 1a). ST muscle weight and length increased 4.10-fold and 1.7-fold, respectively, across the same time. Relative increases in foetal weight and length both for foetus and ST muscle were slightly greater between 210 and 260 dpc, than between 180 and 210 dpc (Figure 1).
Evolution of Charolais foetus length (crown rump length: CRL) and weight (a) and evolution of Semitendinosus muscle length and weight (b) during the last third of bovine foetal life. These measurements were done on animals that were used for proteomic analysis.
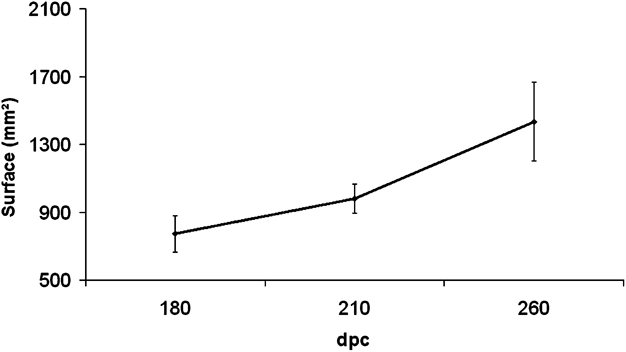
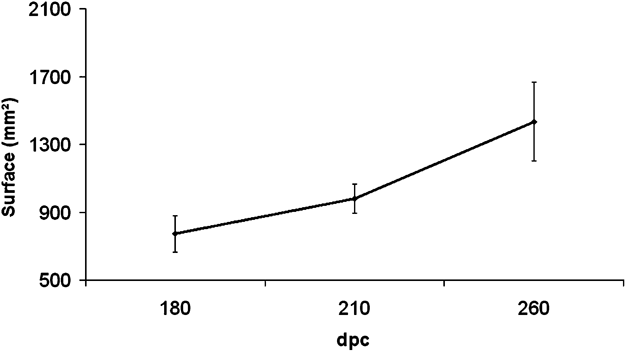
The cross-sectional area of ST muscle doubled between 180 and 260 dpc; it increased 1.2-fold between 180 and 210 dpc and 1.6-fold between 210 and 260 dpc (Figure 2). The cross-sectional area of ST fibres increased 2-fold between 180 and 210 dpc, by 1.4-fold between 210 and 260 dpc and by 2.8-fold between 180 and 260 dpc.
Evolution of cross-sectional area of the Semitendinosus (ST) muscle during the last third of bovine foetal life. These measurements were done on animals that were used for proteomic analysis.
Changes in Myosin heavy chain isoforms
The analysis of the electrophoretic separation of MyHC isoforms with the method of Talmadge and Roy (Reference Talmadge and Roy1993) (Figure 3a) showed the decrease of developmental isoforms from 180 dpc to birth. We observed some changes accordingly from 210 dpc. This method allows a good separation of developmental MyHC but not of adult MyHC as already described earlier (Picard et al., Reference Picard, Barboiron, Duris, Gagnière, Jurie and Geay1999; Picard et al., Reference Picard, Barboiron, Chadeyron and Jurie2007). This confirms the replacement of development MyHC isoforms by fast adult ones during the last trimester of gestation. These data were confirmed by use of the modified Talmadge and Roy protocol (Picard et al., Reference Picard, Barboiron, Chadeyron and Jurie2007), which allows a good separation of adult fast isoforms (I, IIa, IIx) (Figure 3b). It also separates the developmental isoforms but with a lower resolution than the technique of Talmadge and Roy (Reference Talmadge and Roy1993). This confirms modifications in MyHC expression mainly from 210 dpc. On 260 dpc, the profile of MyHC is very similar to that of adult ST.
Electrophoretic separation of Myosin heavy chain isoforms (MyHC) of Semitendinosus muscle from Charolais foetuses of 180, 210 and 260 days post conception (dpc). CT: adult Cutaneus trunci (IIa, IIx), ST: adult Semitendinosus (I, IIa, IIx), Di: adult Diaphragma (I, IIa). (a) Technique of Talmadge and Roy (Reference Talmadge and Roy1993) allows the separation of developmental isoforms and not of fast adult isoforms as observed for ST and CT muscles, (b) whereas the technique of Picard et al. (Reference Picard, Barboiron, Chadeyron and Jurie2007) allows the separation of adult fast isoforms and not of the developmental ones.

Changes in LDH and ICDH enzyme activities
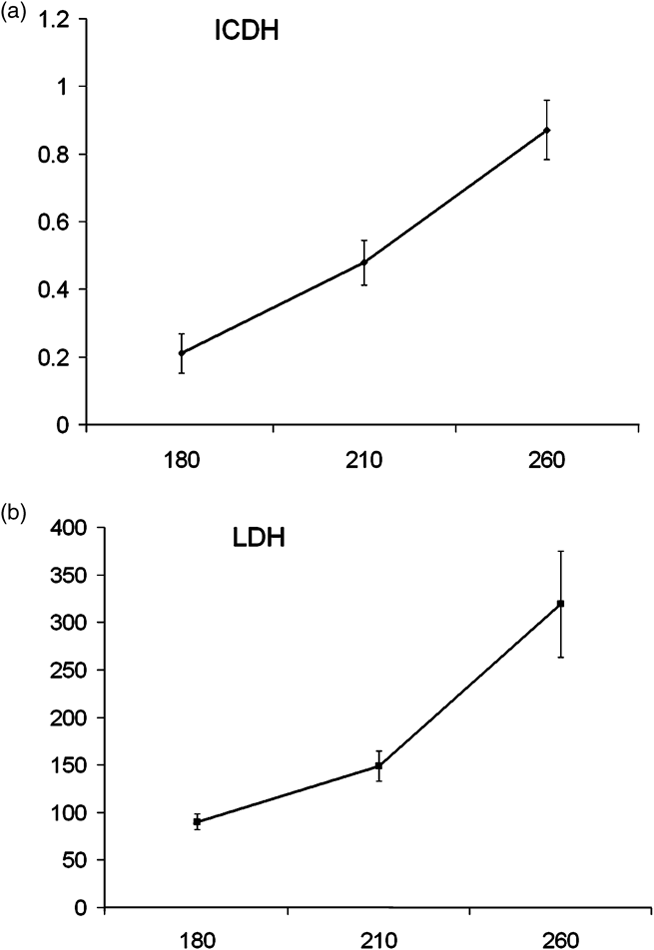
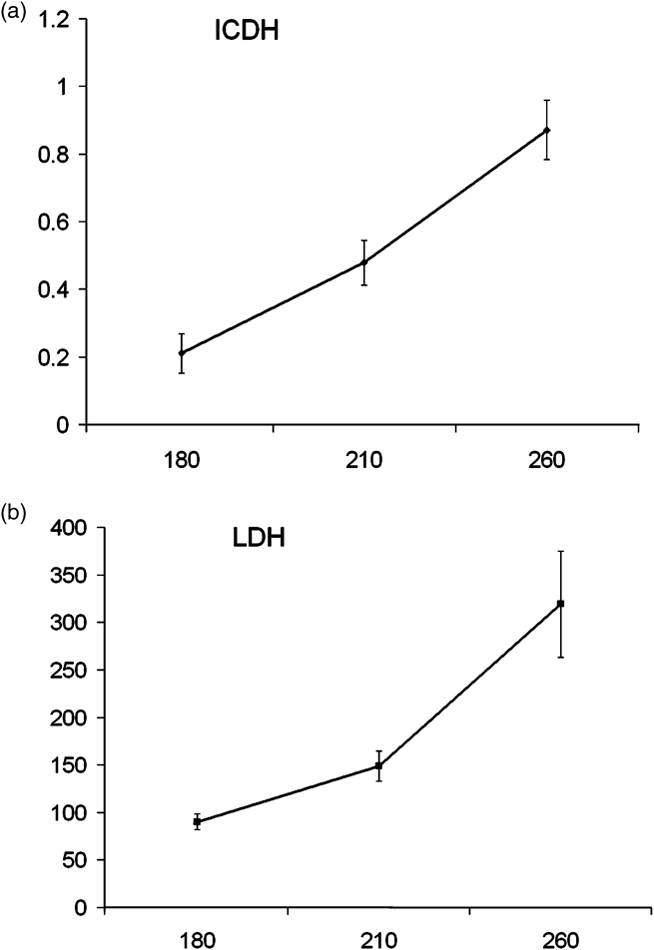
From 180 to 260 dpc, ICDH activity of ST is significantly increased (3.6-fold) (P < 0.0009). LDH activity increased mainly from 180 dpc with a significant increase in its activity since 210 dpc (2.1-fold) (P < 0.0001). Observation of such activity changes of the ICDH and the LDH enzymes, characteristic of oxidative and glycolytic activity, respectively, confirms the important metabolic differentiation during the last trimester of gestation (Figure 4).
Activities (in μmol/min per g) of (a) Isocitrate dehydrogenase (ICDH, oxidative) and (b) Lactate dehydrogenase (LDH, glycolytic) of Semitendinosus muscle of Charolais foetuses from 180 to 260 days post conception (dpc).
Proteome dynamics between 180 and 260 dpc
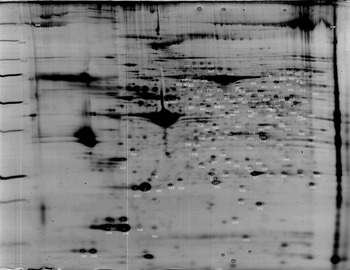
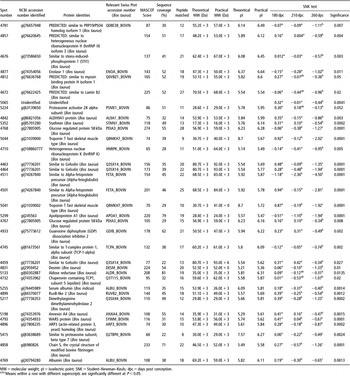
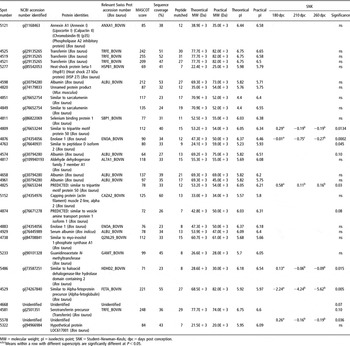
In all, 496 spots were detected on 2-DE reference gel, out of which 169 spots were common to the three stages (Figure 5). These 169 spots were identified using MALDI-TOF mass spectrometry (MS) as 93 different gene products (Table 1).Footnote 1
Map of the 169 protein spots shared by the three developmental stages observed. Two-dimensional gels (T = 11%) cover a dynamic range from 10 to 150 kDa and from 4 to 7 pH units. This Coomassie blue G250 stained gel contains about 490 spots.

Proteins from Cluster 1, Figure 6

MW = molecular weight; pI = isoelectric point; SNK = Student–Newman–Keuls; dpc = days post conception.
a,b,cMeans within a row with different superscripts are significantly different at P<0.05.
Thus, analysis of hierarchical classification allowed the discrimination of six distinct clusters of protein expression. They were grouped into four global profiles of down-regulated (Cluster 1, 2), up-regulated (Cluster 6), transient (Cluster 4) and stable (Clusters 3 and 5) expression across the three stages (Figure 6).
Hierarchical clustering of the 169 proteins common to the three developmental stages observed. HCA experiment was processed using the Pearson coefficient and ward aggregation parameters.

Down regulated clusters
Cluster 1 (Table 1, Figure 6) was composed of 35 proteins, the expressions of which were significantly down-regulated during the last third of foetal life. The GO analysis showed that this cluster could not reflect any particular biological process or function since it was composed of a large variety of different proteins from the nuclear Lamin B2, involved in the onset of C2C12 differentiation (Markiewicz et al., Reference Markiewicz, Ledran and Hutchison2005), to COP9 subunit 4, a member of the COP9 signalosome and strongly involved in cell cycle control through its role on p53 and JUN signalling proteins (Wei and Deng, Reference Wei and Deng2003). Other interesting proteins dealing with cell cycle and proliferation such as Stathmin 1 (Iancu-Rubin and Atweh, Reference Iancu-Rubin and Atweh2004) and HnRNPK (Rahman-Roblick et al., Reference Rahman-Roblick, Johannes Roblick, Hellman, Conrotto, Liu, Becker, Hirschberg, Jornvall, Auer and Wiman2007) were grouped into this cluster 1.
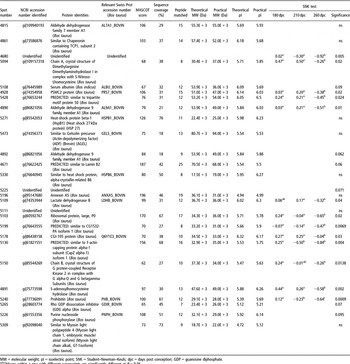
Cluster 2 (Table 2, Figure 6) was composed of 27 proteins. Functional characterization of this cluster dealt with cell development and cell death, in agreement with the identification of Prohibitin, Rho-GDI alpha, HSP27 and Annexin V. This cluster shows also the down-regulated profile of the embryonic muscle isoform of Myosin light chain 1 (MyLC 1).
Proteins from Cluster 2, Figure 6

MW = molecular weight; pI = isoelectric point; SNK = Student–Newman–Keuls; dpc = days post conception; GDP = guanosine diphosphate.
a,b,cMeans within a row with different superscripts are significantly different at P<0.05.
Up-regulated clusters
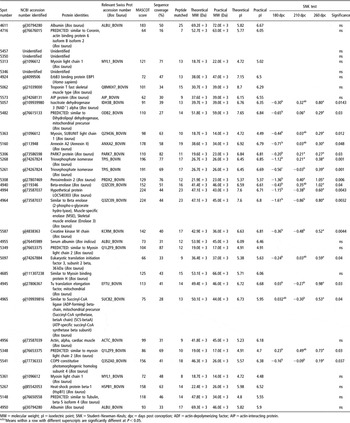
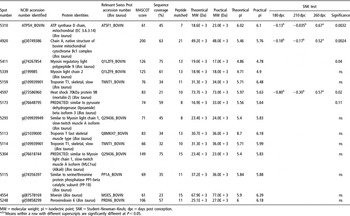
Cluster 6 (Table 3, Figure 6) contained 34 proteins, among which 17 are significantly up-regulated across the three stages. This cluster exhibits 8 proteins having metabolic functions in muscle cells and 10 proteins from contractile apparatus.
Proteins from Cluster 6, Figure 6

MW = molecular weight; pI = isoelectric point; SNK = Student–Newman–Keuls; dpc = days post conception; ADF = actin-depolymerizing factor; AIP = actin-interacting protein.
a,b,cMeans within a row with different superscripts are significantly different at P<0.05.
Thus, proteins from contractile apparatus, including different isoforms of MyLC 1 and MyLC 2, were identified as well as alpha-cardiac actin, fast TnT and Myosin binding protein H (MyBP H). Isoforms of tubulin were also revealed. Proteins dealing with metabolic muscle properties dealt with many metabolic pathways such as glycolysis (Beta enolase, Triose phosphate isomerase) and citrate cycle (ICDH, succinyl CoA synthetase).
Transient expression
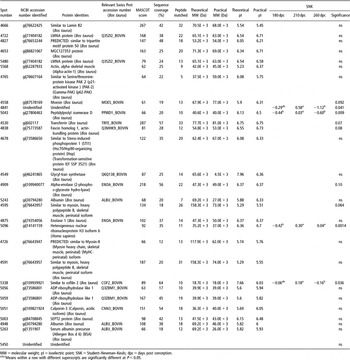
Cluster 4 (Table 4, Figure 6) contained 29 proteins presenting, in average, an up-regulation at 210 dpc. Among these proteins four proteins were significantly up-regulated at 210 dpc. Proteins involved in RNA splicing and mRNA processing, peptidylprolyl isomerase D and hnRNPH3, were identified. Cytoskeletal proteins Desmin and Cofilin 2 are from intermediary filament and Actin-modulating network, respectively.
Proteins from Cluster 4, Figure 6

MW = molecular weight; pI = isoelectric point; SNK = Student–Newman–Keuls; dpc = days post conception.
a,b,cMeans within a row with different superscripts are significantly different at P<0.05.
Stable expression profiles
Cluster 3 (Table 5, Figure 6) contained 30 proteins. This cluster was partly characterized by organ development, according to the identification of alpha-fetoprotein, serine/threonine protein phosphatase 1. Creatine metabolism was also represented according to the identification of the Guanidinoacetate N-methyltransferase protein.
Proteins from Cluster 3, Figure 6

MW = molecular weight; pI = isoelectric point; SNK = Student–Newman–Keuls; dpc = days post conception.
a,b,cMeans within a row with different superscripts are significantly different at P<0.05.
Myosin heavy chain IIx/d identified in Canis familiaris taxonomy presents a high degree of homology with MyHC IIX in Bos taurus taxonomy according to Maccatrozzo et al. (Reference Maccatrozzo, Caliaro, Toniolo, Patruno, Reggiani and Mascarello2007).
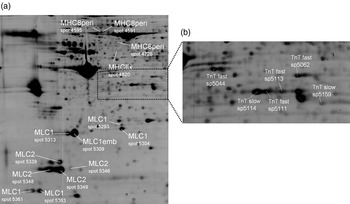
Cluster 5 (Table 6, Figure 6) grouped 14 proteins present, in average, a slight up-regulation at 260 dpc. As cluster 6, this cluster showed a large variety of contractile proteins (two MyLC 1, MylC 2, two TnT slow and TnT fast) (Figure 7).
Proteins from Cluster 5, Figure 6

MW = molecular weight; pI = isoelectric point; SNK = Student–Newman–Keuls; dpc = days post conception.
a,b,cMeans within a row with different superscripts are significantly different at P<0.05.
Localization of different isoforms of proteins from the contractile apparatus. (a) mapping of 14 different isoforms of Myosin light and heavy chain (peptide fragment) (b) mapping of 6 different isoforms of slow and fast troponins.

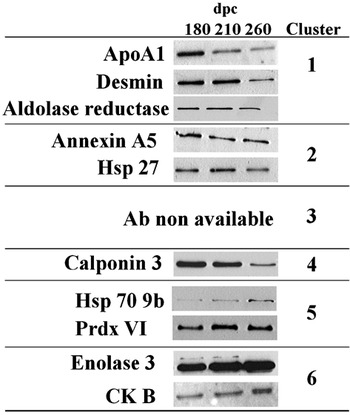
In order to confirm the evolution of protein abundance, a western blot analysis was performed for some selected proteins of different clusters (for which we found suitable antibodies), as presented in Figure 8. Immuno illustration of each cluster was consistent with 2-DE gel-based proteomic data. Clusters 1 and 6 were confirmed using western blot (cluster 1 with protein ApoA1, Desmin and Aldolase reductase and cluster 6 with protein Enolase 3 and Creatine kinase B) while noisy clusters were more difficult to characterize due to their animal variability (clusters 4 and 5 for instance). However, in noisy clusters, Western blot profile was consistent with SNK profile (HSP70A9b in cluster 5, which presents a ‘b-b-a’ SNK test profile). These immunological confirmations support our technical methodologies as well as our method of dataset normalization.
Western Blot confirmation of the expression profile of different proteins. Each immuno validation is consistent with 2D-based proteomic data, which support our technical methodologies as well as our method of data normalization.

Discussion
Measurements of both foetuses and ST muscle growth were comparable to earlier observations (Robelin et al., Reference Robelin, Lacourt, Béchet, Ferrara, Briand and Geay1991). Modifications of MyHC isoforms during the last trimester of foetal life were also in total agreement with the immunochemistry data obtained on numerous stages by Picard’s lab (Gagnière et al., Reference Gagnière, Picard and Geay1999; Picard et al., Reference Picard, Lefaucheur, Berri and Duclos2002). They confirm that the most important changes in MyHC isoforms occurred after 180 dpc, mainly between 210 and 260 dpc, with the extinction of the foetal and embryonic isoforms replaced by the adult ones. Moreover, boost activities observed for ICDH and LDH enzymes in the analysed samples are in agreement with earlier observations on bovine ST muscle (Gagnière et al., Reference Gagnière, Picard and Geay1999). All these data illustrated the important changes in contractile and metabolic properties of muscle corresponding to the acquisition of adult phenotype during this period.
Results about proteome dynamics displayed the decrease of proteins involved in cell cycle and proliferation in accordance with the fact that the TNF is fixed from the end of the second trimester of gestation (Picard et al., Reference Picard, Lefaucheur, Berri and Duclos2002). They showed other important changes in metabolic and contractile properties of ST muscle during the last trimester. Among the 35 spots identified as enzymes, cluster 6 displayed a large proportion of proteins having a role in citrate cycle metabolism including ICDH protein, Succinyl CoA ligase; glycolysis including muscle-specific Enolase and Triose phosphate isomerase. Creatine kinase, involved in phosphocreatine synthesis, is represented by two different isoforms. Finally, Dihydrolipoyl dehydrogenase was detected in this cluster. It is involved in pyruvate metabolism and surrounding pathways such as glycolysis and citrate cycle. This enzyme is also involved in diverse amino acid metabolic pathways (alanine, aspartate, glycine, serine, threonine) and diverse amino acid degradations (valine, leucine, isoleucine) as described in Kyoto Encyclopedia of Genes and Genomes (KEGG) database.
Other clusters from this work displayed proteins having interesting metabolic activities. Thus, changes in proportions of Alpha and Beta enolase in bovine muscle are in total agreement with the finding of Fougerousse et al. (Reference Fougerousse, Edom-Vovard, Merkulova, Ott, Durand, Butler-Browne and Keller2001) on human muscle. Muscle-specific Enolase (Beta enolase) is detected very early in bovine myogenesis, at 60 dpc (Chaze et al., Reference Chaze, Meunier, Chambon, Jurie and Picard2008), the relative abundance of Beta enolase from 180 to 260 dpc increased significantly, while during the same time relative abundance of Alpha enolase decreases slightly.
Finally, metabolic properties of Aldehyde dehydrogenase (ALDH) protein family are exhibited here. Two different members of this family (ALDH9A1 and ALDH7A1) were identified and both were represented by two different isoforms (ALDH9A1: spot 4842 and spot 4890; ALDH7A1: spot 4815 and spot 4892). ALDHs are known to participate in oxidizing of a plethora of endogeneous aldehydes, which are mainly formed during metabolism of amino acids, carbohydrates, lipids and vitamins (Vasiliou et al., Reference Vasiliou, Pappa and Petersen2000). ALDH9A1 is known to have a potential involvement in alternative biosynthesis of GABA neurotransmitter, and is involved in carnitine biosynthesis (Vaz et al., Reference Vaz, Fouchier, Ofman, Sommer and Wanders2000), a component that displays an indispensable role in the mitochondrial transport of long-chain fatty acids for subsequent beta oxidation, and in the regulation of mitochondrial acetylCoA/CoASH ratio (Stephens et al., Reference Stephens, Constantin-Teodosiu and Greenhaff2007). From our knowledge, it is the first time that such members of the ALDH family were described (i) in a mammalian ontogenic process, and (ii) in Bos taurus species according to the Aldehyde dehydrogenase database (2002) (Sophos and Vasiliou, Reference Sophos and Vasiliou2003). Further studies should be of interest since ALDH9A1 is a potential element of muscle energetic metabolism, which is known to have major repercussions for meat quality.
Besides MyHC transitions across the three stages revealed by monodimensional electrophoretic separation, many other proteins displaying contractile properties were identified. Among all contractile proteins, our results displayed expression profiles of four MyHC, six MyLC type 1, four MyLC type 2, four fast TnT and two slow TnT. About two-thirds of these proteins were classified in up-regulated clusters 5 and 6. The two identified isoforms of slow TnT are strongly thought to correspond to slow TnT identified on the cartography of Bouley et al. (Reference Bouley, Chambon and Picard2004), in agreement with the observation of their pI and MW on gel. According to these authors, these two slow TnT isoforms are the product of alternative splicing of the murine exon 5 (Huang et al., Reference Huang, Chen and Jin1999). The most acidic one is referred to as sTnT1 by Muroya et al. (Reference Muroya, Nakajima and Chikuni2003) and the most basic one is referred to as sTnT2. These two isoforms are grouped in cluster 5, which displayed up-regulated proteins at 260 dpc. Fast TnT isoforms proteins are also the product of a complex alternative splicing (Muroya et al., Reference Muroya, Nakajima and Chikuni2003; Bouley et al., Reference Bouley, Chambon and Picard2004). Our results displayed four different isoforms of fTnT according to their pI and MW. Unfortunately, our MS identification strategy could not allow the discrimination of alternative spliced isoforms. In the near future, all fTnT isoforms will be identified using a MS/MS (tandem mass spectrometry) identification strategy to confirm their alternative splices isoform identification. Moreover, the profile of TnT fast isoforms observed in our study at 260 dpc is very different from that of Bouley et al. (Reference Bouley, Meunier, Chambon, De Smet, Hocquette and Picard2005) for the same muscle at adult stage (on young bulls 15 months old) (Figure 6). Among the 11 spots of fast TnT revealed at adult stage, we observed only four spots. This indicates that even if the modifications in TnT isoforms are very important during the last third of gestation, the adult phenotype is not yet reached at birth. Understanding TnT isoform changes is of great importance for the management of beef tenderness since the proteolytic degradation of TnT during post mortem meat ageing is related with this quality (Tsitsilonis et al., Reference Tsitsilonis, Stoeva, Echner, Balafas, Margomenou, Katsoulas, Troy, Voelter, Papamichail and Lymberi2002). This was confirmed by the data of Bouley et al. (Reference Bouley, Chambon and Picard2003), in a proteomic analysis showing a differential expression of TnT isoforms between two groups of ST muscles with high or low sensorial tenderness. Moreover, Bouley et al. (Reference Bouley, Meunier, Chambon, De Smet, Hocquette and Picard2005) showed that the ratio of TnT fast from exon 16/TnT fast from exon 17 was a good marker of muscle hypertrophy. The fact that most of the adult fast TnT isoforms appear after birth allows the possibility to control their expression by modifying the breeding conditions, particularly feeding conditions, during the postnatal period, which is easier than manipulations of foetal nutrition.
Among the contractile modifications observed, four MyHC and a total of 10 MyLC were identified in this study (Figure 7). MyLC 1 embryonic isoforms displayed a down-regulated profile from 180 to 260 dpc in accordance with the decrease of the developmental MyHCs observed during the same time. On the contrary, isoforms of MyLC 1 and 2 increased during this period. The works of Pernelle et al. (Reference Pernelle, Righetti, Wahrmann and Herve1990) described the same pattern of MyLC during the last third of human foetal life using IPG Dalt electrophoresis separations. Our study reveals two others MyLC 1 (spot 5361 and spot 5363, Figure 5) but by the use of very narrow pH range strips, Pernelle et al. (Reference Pernelle, Righetti, Wahrmann and Herve1990) revealed more MyLC 2 isoforms. The high similarity between the work of Pernelle et al. (Reference Pernelle, Righetti, Wahrmann and Herve1990) and the present study is a good argument that reinforces the idea of a similar timing in myogenic process between human and bovine muscle. As for TnT, the study of MyLC isoforms is important for the management of beef tenderness as proteomic studies of ST muscles classified on their notes of tenderness obtained by sensory analysis revealed differential expression of MyLC 1 and MyLC 2 between the two groups in French beef breeds (Bouley et al., Reference Bouley, Chambon and Picard2003).
Conclusion
This work displays the expression profile of 169 proteins during late gestation in ST muscle, in vivo. This study suggests that changes in metabolic and contractile muscle properties are accompanied with a complex proteome dynamics. It constitutes an original and consistent reference within a larger point of view to compare changes occurring in muscle differentiation for particular animals (animals from different breeding systems, animal presenting muscular hypertrophy, cloned bovine).
This investigation of muscular proteome dynamics through last stages of bovine gestation also suggests new tracks concerning the complex regulation of ALDH family members, which could influence muscle metabolism through carnitine biosynthesis. This report also displays the complex regulation of slow and fast TnT isoforms. Complementary studies using MS/MS strategy needs to be designed to investigate the dynamics of TnT isoforms during gestation, in detail.
In conclusion, besides the agronomic interest of this work, it suggests new tracks that could reinforce the fact that bovine and human myogenesis share a lot of common features during the myogenic process, from (i) the gestation time and the muscular maturity at birth, (ii) the developmental modifications of metabolic Enolase isoforms and contractile MyLC isoforms, (iii) the same type of fibre I, IIA and IIX without IIB and (iv) the acquisition of the TNF at about 180 dpc. Completed with earlier work (Chaze et al., Reference Chaze, Meunier, Chambon, Jurie and Picard2008), this larger study could be of particular interests for the study of human muscular diseases and to gain knowledge of early human myogenesis.
Acknowledgments
The authors would like to thank the C2M research (with warm thanks to Ch. Barboiron and D. Chadeyron) group for technical assistance, the experimental farm staff for generating foetuses and the staff at the experimental abattoir for conducting the animal slaughters. We also express gratitude to Bio-Rad for the rent of the Dodeca Cell electrophoresis apparatus for a short period of time.
This work was supported by the ‘Commissariat à l’Aménagement et au développement Economique du Massif Central’ (France) and by an INRA grant from PHASE department.