Grains or tubers, such as paddy rice, wheat, sorghum, barley or cassava, are the most important food sources in the dietary patterns of South Asia, Southeast Asia and Africa(Reference Anitha, Kane-Potaka and Tsusaka1–Reference Stephenson, Amthor and Mallowa4). In low-income countries of these regions, grains and tubers provide substantial energy and a significant proportion of protein intake(Reference Anitha, Kane-Potaka and Tsusaka1–Reference Stephenson, Amthor and Mallowa4). The dietary energy derived from grains can reach over 80 %(Reference Schoenfeldt and Hall5). Moreover, in some extremely impoverished regions, the proportion of protein from grains or tubers in the diet is significantly higher than that from beans or meat(Reference Anitha, Kane-Potaka and Tsusaka1–Reference Stephenson, Amthor and Mallowa4). This situation often results in unbalanced diets, which lead to malnutrition(Reference Anitha, Kane-Potaka and Tsusaka1–Reference Stephenson, Amthor and Mallowa4). It is reported that 10 % of the world’s population has insufficient protein intake, with the majority living in areas including sub-Saharan Africa and South Asia(Reference Smith, Stull and Patz6). Consequently, many children suffer from stunted growth or even die, while adults are prone to different diseases(Reference Anitha, Kane-Potaka and Tsusaka1–Reference Schoenfeldt and Hall5). However, assessing the nutritional value of proteins in grains and tubers may help identify a low-cost, well-balanced diet that can help reduce protein malnutrition(Reference Fanelli, Bailey and Guardiola7,Reference Mathai8) .
The digestible indispensable amino acid score (DIAAS) has been recommended by the FAO of the UN as the preferred method for determining protein nutritional value, replacing the original protein digestibility-corrected amino acid (AA) score(Reference Martineau-Cote, Achouri and Karboune9). To calculate DIAAS, it is necessary to determine the standardised ileal digestibility (SID) of each AA, preferably in humans(Reference Hodgkinson, Stein and de Vries10). If this is unfeasible, growing pigs can serve as a suitable animal model for protein digestion in adult humans(Reference Mathai8). The physiology of protein digestion at the end of the small intestine is similar between adult humans and growing pigs(Reference Hodgkinson, Stein and de Vries10), and the true ileal AA digestibility values derived from the growing pig models exhibit statistically non-significant differences from those determined in adult humans(Reference Hodgkinson, Stein and de Vries10,Reference Stein11) . Ileal digestibility provides a more accurate estimate of AA bioavailability compared with total digestive tract digestibility(Reference Cervantes-Pahm, Liu and Stein12). The apparent ileal digestibility (AID) of AA is defined as the net disappearance of dietary AA from the proximal to the distal ileum of the digestive tract(Reference Cervantes-Pahm, Liu and Stein12). When AID is corrected for basal endogenous losses in pigs, the resulting value is called the SID, which can be used to calculate the approximate DIAAS in humans(Reference Hodgkinson, Stein and de Vries10,Reference Stein11) . In animal nutrition, SID values are commonly used, while in human nutrition, true ileal digestibility values are calculated after correction for ileal endogenous losses(Reference Stein11).
Currently, few studies have used growing pigs to assess the DIAAS of key ingredients in the dietary patterns of low-income countries, and there is often an issue of insufficient sample size. Moreover, existing DIAAS studies have overlooked inexpensive and potentially valuable ingredients such as rice bran, wheat bran and cassava. Therefore, based on our research conducted over the past 3 years on numerous samples of common energy-providing ingredients in diets and utilising the ileal cannulated growing pig model, we determined the SID and DIAAS values of eight common energy feed ingredients (barley, sorghum, wheat, brown rice, rice bran, wheat bran, cassava and paddy rice) in their original state. This evaluation can help low-income countries that mainly rely on grains and tubers to understand the protein nutritional value of dietary ingredients, identify high-quality ingredients that are often overlooked and ultimately improve unbalanced dietary patterns. We anticipate that our findings will contribute to the health and well-being of children and adults.
Materials and methods
Sources of eight ingredients
Samples of barley (n 10), sorghum (n 10), wheat (n 10), brown rice (n 10), rice bran (n 10), wheat bran (n 10), cassava (n 10) and paddy rice (n 11) were selected. The majority of these samples originated from diverse production areas within China. However, three barley samples were sourced from the Shanghai port (Ukrainian barley, Australian barley and Canadian barley), and one sample came from the Guangdong port (Australian barley). Regarding cassava, six samples were concentrated in the Guangxi region, two were from Laos and the remaining two were from Vietnam and Cambodia.
The ingredients were processed in a feed mill to prepare for experimental diets. The samples were sieved through a 40-mesh screen, obtained using stratified sampling and the quadrant method and stored at −20°C until use(Reference Feng, Li and Jiang13).
Animals, diets and experimental design
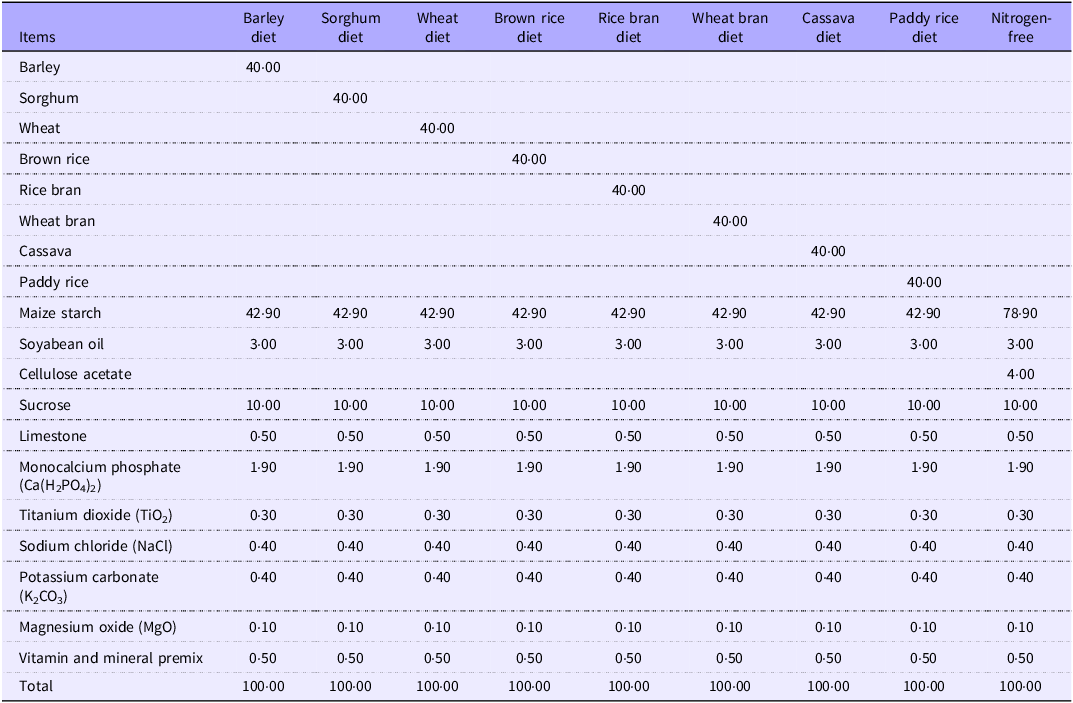
In this study, [Duroc × (Yorkshire × Landrace)] castrated growing pigs were employed, and a T-cannula was installed at the distal ileum(Reference Feng, Li and Jiang13–Reference Stein, Shipley and Easter18). The T-cannula was installed as described by Stein et al(Reference Stein, Shipley and Easter18). A 7-d recovery period was arranged post-operation, with adequate care provided. Twenty-two (twenty-four for paddy rice) pigs for each ingredient were randomly assigned to two incomplete 11 × 3 (12 × 3 for paddy rice) Latin square designs(Reference Feng, Li and Jiang13–Reference Tang, Feng and Zhao16). The initial body weights of the experimental pigs used for the different ingredients were as follows: barley (initial BW: 30 ± 2 kg), sorghum (initial BW: 41 ± 2 kg), wheat (initial BW: 41 ± 2 kg), brown rice (initial BW: 42 ± 2 kg), rice bran (initial BW: 30 ± 2 kg), wheat bran (initial BW: 34 ± 3 kg), cassava (initial BW: 36 ± 2 kg) and paddy (initial BW: 20 ± 3 kg). A total of ninety pigs were utilised in this study. For cassava, twenty-two pigs were used. Another twenty-two pigs were shared between wheat bran and wheat. Another twenty-two pigs were shared between barley and sorghum. And twenty-four pigs were shared among paddy rice, rice bran and brown rice. Ingredient experiments with shared pigs have at least 7-d intervals for normal diet. For the eight ingredients, ten (eleven for paddy rice) distinct diets were formulated using samples from different sources, with the sample serving as the sole nitrogen source. Nitrogen-free diets were also prepared for each ingredient to determine the basal endogenous losses of CP and AA. The respective ingredient diets and nitrogen-free diets were applied to their corresponding incomplete Latin square designs(Reference Feng, Li and Jiang13,Reference Kong and Adeola17,Reference Stein, Shipley and Easter18) . Thus, each sample yields six replicate SID values, and their mean serves as the SID for that sample. Furthermore, the final SID for each ingredient is the overall mean of the average SID values of all its samples. Taking sorghum as an example, its final SIDCP is calculated by averaging sixty independent SIDCP measurements. Since paddy rice has one additional sample, it correspondingly requires sixty-six measurements. All diets had 40 % test components from diverse sources and 0·30 % titanium dioxide (TiO2) as an indigestible marker for CP and AA digestibility calculation (Table 1). Sufficient vitamins and minerals were supplemented into all diets following NRC (2012)(19) guidelines. The experiment for each ingredient included three consecutive phases. Each experimental phase was composed of a 5-d adaptation stage and then a 2-d ileal digesta collection stage. For each diet treatment, six replicated samples were collected. All pigs were separately kept in metabolic cages (sized 1·4 m × 0·7 m × 0·5 m) with the temperature maintained at (23 ± 1)℃. Prior to each experimental cycle, the pigs were weighed individually. The health status and mental state of the pigs were recorded every day, and the pigs remained in a healthy state throughout the experiment. They were fed the same amount at 08.00 and 17.00 h, the total amount being 4 % of the average initial body weight (a quantitative feeding method) and they had free access to water.
Composition of experimental diet (air-dry basis, %)

The vitamin and mineral premix provided the following per kg of diets: 4200 IU VA, 400 IU VD3, 36 IU VE, 1·2 mg VK3, 23 μg VB12, 5·63 mg VB2, 20·5 mg VB5, 28 mg VB3, 1·00 g choline chloride, 0·8 mg folic acid, 3·4 mg VB1, 2·7 mg VB6, 0·18 mg VH, 40·0 mg Mn (in MnSO4), 70·0 mg Fe (in FeSO4), 70·0 mg Zn (in ZnSO4), 70 mg Cu (in CuSO4), 0·3 mg I (as KI) and 0·3 mg Se (as Na2SeO3).
Sample collection and preparation
During the 2-d ileal digesta collection period, ileal digesta was collected for 8 h daily from 08.00 to 16.00. During the operation, a plastic bag was attached to the open T-shaped cannula port and secured tightly with a rubber band for collection. Meanwhile, 5 millilitres of 10 % (v/v) formic acid was added to each bag to reduce bacterial fermentation. Once the collection lasted for 30 min or the volume of the digesta in the plastic bag reached about one-third or more of the bag’s capacity, the bag was immediately removed and frozen at −20℃. After the sample collection period ended, the frozen digesta samples were vacuum freeze-dried (SCIENTZ-50F/A, Ningbo Xinzhi Lyophilization Equipment Co., Ltd). After the samples were dried, they were pulverised and passed through a 40-mesh sieve. Freeze-dried and ground ileal digesta samples from our studies(Reference Feng, Li and Jiang13–Reference Ouyang, Li and Feng15,Reference Yang, Li and Feng20,Reference Jiang, Li and Feng21) were transported to the Institute of Subtropical Agriculture, Chinese Academy of Sciences (Changsha, Hunan, China) for analysis.
Sample analysis and calculation
Referring to the dry matter (DM) (930·15) and CP (984·13) procedures of AOAC (2006)(22), DM and CP of ingredients, diets and sieved digesta samples were analysed. The detection of AA content in ileal digesta, ingredients and diet samples was carried out as follows: First, the samples were hydrolysed with 6 N HCl at 110℃ for 24 h, and then the content of 15 AA was determined using a high-performance liquid chromatograph (Agilent 1200, Agilent Technologies). The contents of methionine (Met) and Cys in all samples were determined by the oxidative hydrolysis method (982·30 E (a); AOAC, 2006)(22). The samples were hydrolysed with 10 % KOH at 40℃ for 16 to 18 h, and the content of tryptophan (Trp) was determined by spectrophotometry according to GB/T 15400-2018(23). Referring to the method of GB/T 5009·246-2016(24), the diet and chyme samples were processed. The remaining parameters gross energy (GE), CP, ether extract (EE), crude fibre (CF), neutral detergent fibre (NDF), acid detergent fibre (ADF), Ca and phosphorus were determined according to the methods described in our previous studies(Reference Feng, Li and Jiang13). The content of titanium dioxide (TiO2) in the samples was determined by an inductively coupled plasma optical emission spectrometer (ICP- OES 5110, Agilent Technologies, Santa Clara). The SID and DIAAS of ingredients were determined based on the method described by Bailey et al. (2020)(Reference Bailey, Mathai and Berg25) and Stein et al. (2007)(Reference Stein, Seve and Fuller26) using the following equations:
 $${\rm{AID}} = \left[ {1 - \left( {{\rm{A}}{{\rm{A}}_{\rm{d}}} \times {{\rm{T}}_{\rm{r}}}} \right)/\left( {{\rm{A}}{{\rm{A}}_{\rm{r}}} \times {\rm{ }}{{\rm{T}}_{\rm{d}}}} \right)} \right] \times 100\% $$
In equation 1, AAd and Td, respectively, signify the concentrations of AA and TiO2 in the ileal digesta (g/kg of DM), while AAr and Tr stand for the concentrations of AA and TiO2 in diets (g/kg of DM), respectively. The same formula was also applied to calculate the AID of CP.
 $${\rm{IA}}{{\rm{A}}_{{\rm{end}}}} = \left[ {{\rm{A}}{{\rm{A}}_{\rm{d}}} \times \left( {{{\rm{T}}_{\rm{r}}}/{{\rm{T}}_{\rm{d}}}} \right)} \right]$$
In equation 2, IAAend is the basal endogenous loss of each AA (g/kg of DM intake). AAd and Td are the concentrations of AA and TiO2 in the ileal digesta of growing pigs fed the N-free diet, respectively. Tr is the TiO2 concentration in the N-free diet. The same equation was for calculating the endogenous loss of CP.
 $${\rm{SID}} = \left[ {{\rm{AID}} + \left( {{\rm{IA}}{{\rm{A}}_{{\rm{end}}}}/{\rm{A}}{{\rm{A}}_{\rm{d}}}} \right) \times 100\% } \right].$$
Equation 3 was used to calculate the SID of AA and CP. The concentration of standardised ileal digestible AA (g/kg) in each ingredient was computed by multiplying the SID value (%) of each AA by its concentration (g/kg) in the ingredient. Then, this value was divided by the CP concentration in the ingredient to obtain the digestible indispensable AA content (mg) in 1 g protein.
 $$\eqalign{& {\rm{Digestible\, indispensable\, AA }}\left( {{\rm{DIAA}}} \right){\rm{ reference\, ratio}} = \cr& {\rm{ digestible\, indispensable\, AA\, content\, in }}\,1\,{\rm{ g\, protein\, of\, food }}\,\left( {{\rm{mg}}} \right)/\cr& {\rm{mg\, of\, the\, same\, dietary\, indispensable\, AA\, in\, }}1\,{\rm{ g\, of\, reference\, protein}}{\rm{.}}}$$
The digestible indispensable AA reference ratios for each ingredient were calculated with equation 4. Separate ratios were computed with the reference protein for different age groups (6 months – 3 years children, over 3 years children, adolescents and adults). The DIAAS was calculated by equation 5.
 $$\eqalign{& {\rm{DIAAS}} = 100 \times {\rm{lowest\, value\, of\, digestible}}\,\cr & {\rm indispensable\, AA\, reference\, ratio}}{\rm{.}}$$
Statistical analysis
The normality and homogeneity of variance of the data were checked using the Descriptive Statistics procedure of SPSS 22.0 (SPSS Inc.), and outliers were detected by analyzing the Z-scores of the data. Each pig was regarded as an experimental unit. The significant differences between treatments were assessed by one-way ANOVA with Duncan’s multiple comparisons test. Statistical significance was set at the α level of P < 0·05(Reference Feng, Li and Jiang13,Reference Li, Tian and Feng14,Reference Tang, Feng and Zhao16) .
Results
Crude protein and amino acids compositions of the eight ingredients and their diets
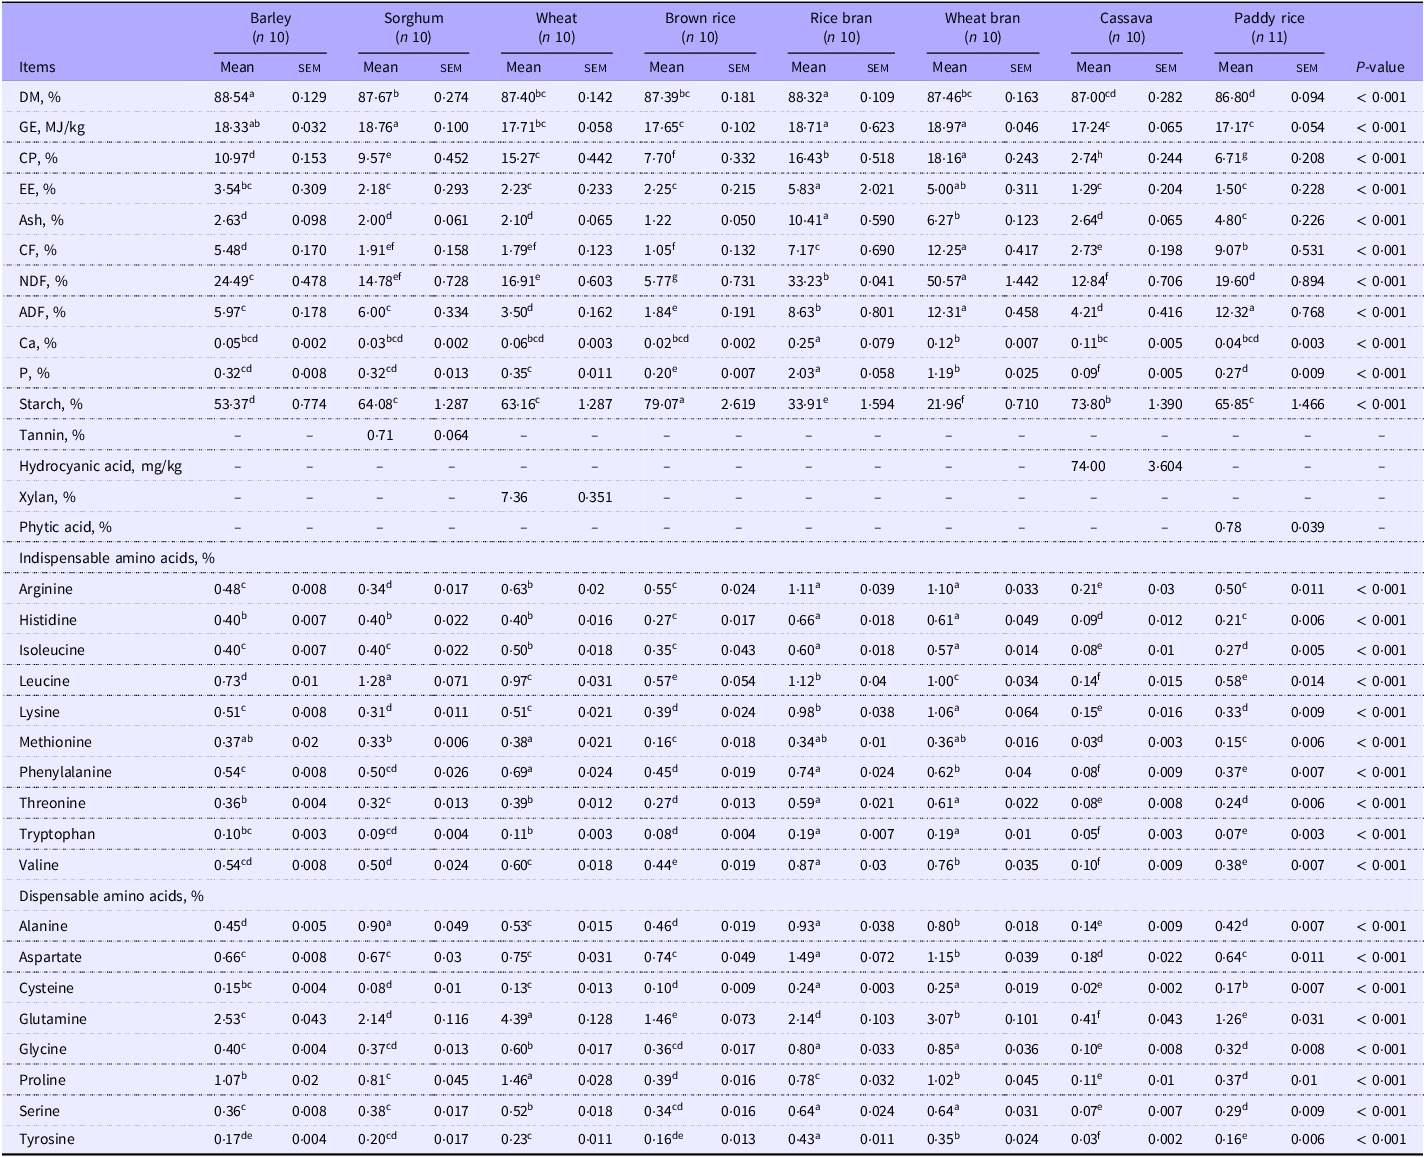
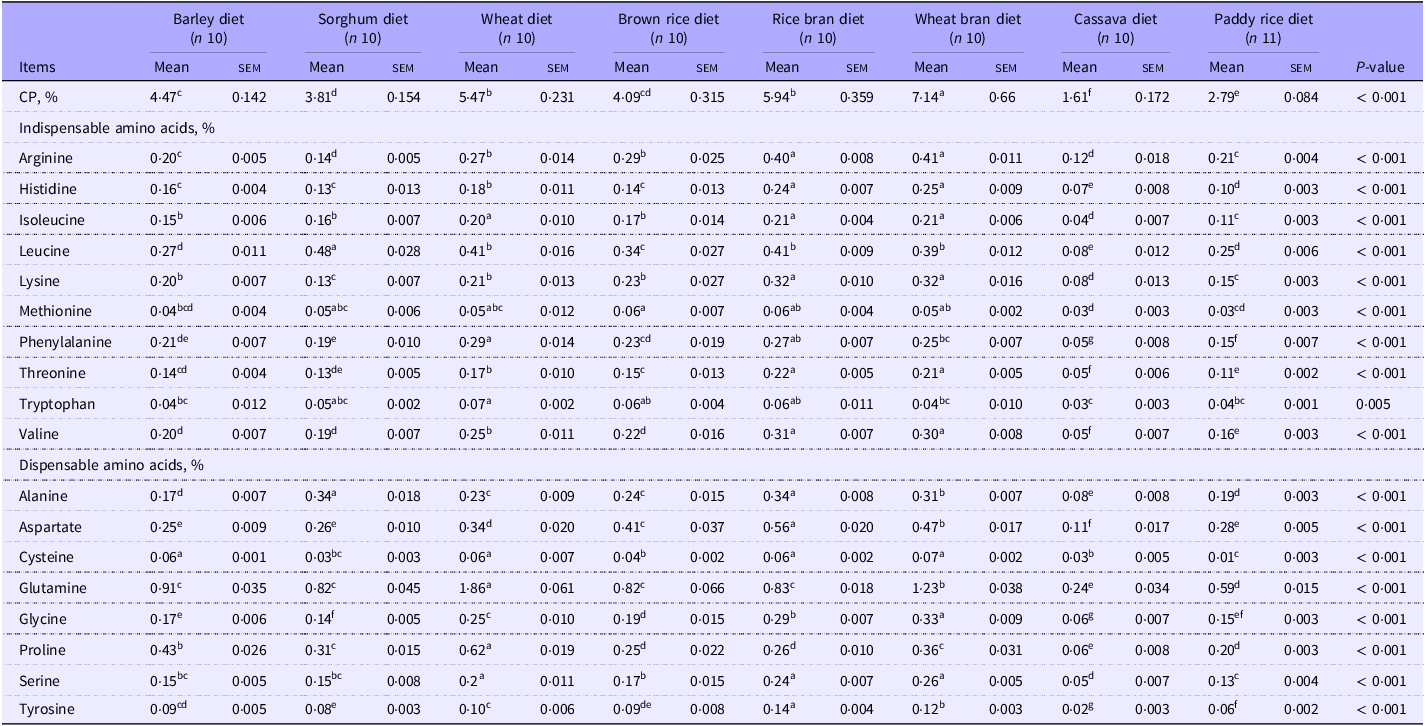
The AA compositions of the different ingredients are presented in Table 2. The contents of CP and AA varied significantly (P < 0·01) among the ingredients. On a DM basis, the average CP content of barley, sorghum, wheat, brown rice, rice bran, wheat bran, cassava and paddy rice was 10·97 %, 9·57 %, 15·27 %, 7·70 %, 16·43 %, 18·16 %, 2·74 % and 6·71 %, respectively. Wheat bran and rice bran had the highest and second-highest CP contents, respectively, and exhibited higher levels of indispensable amino acid (IAA) compared with the other ingredients. Whole grain ingredients formed a second tier in terms of CP and IAA content, while cassava, classified as a tuber, constituted a third tier. Among the whole grains, wheat had the highest CP and IAA content. The average lysine (Lys) content as a percentage of CP for barley, sorghum, wheat, brown rice, rice bran, wheat bran, cassava and paddy rice was 4·6 %, 3·2 %, 3·3 %, 5·0 %, 5·9 %, 5·8 %, 5·4 % and 4·9 %, respectively. Notably, rice bran and wheat bran were richer in Lys content. Additionally, the percentage of Lys in the CP of cassava was relatively high. In the diets, the average CP contents of the diets containing barley, sorghum, wheat, brown rice, rice bran, wheat bran, cassava and paddy rice were 4·47 %, 3·81 %, 5·47 %, 4·09 %, 5·94 %, 7·14 %, 1·61 % and 2·79 %, respectively (Table 3).
The determined CP, AA, and chemical compositions of barley, sorghum, wheat, brown rice, rice bran, wheat bran, cassava and paddy rice (%, DM) (Mean values with their standard errors)

CP, crude protein; AA, amino acids; DM, dry matter; GE, gross energy; EE, ether extract; CF, crude fibre; NDF, neutral detergent fibre; ADF, acid detergent fibre.
a,b,c,d,e,f,g,hMeans in the same row with different superscript letters are significantly different at P < 0·05.
Determined AA compositions of barley, sorghum, wheat, brown rice, rice bran, wheat bran, cassava and paddy rice-based diets (%, DM) (Mean values with their standard errors)

Table 3 Long description
The table presents the amino acid compositions of different dietary ingredients, including barley, sorghum, wheat, brown rice, rice bran, wheat bran, cassava, and paddy rice. It includes data on the mean and standard error of indispensable and dispensable amino acids, as well as the crude protein (CP) content for each diet. The table has 23 rows and 10 columns. The columns are labeled with the diet types and their respective sample sizes. The rows are labeled with the items being measured, including CP percentage and various amino acids. Each cell contains the mean value and standard error for the corresponding item and diet type. Notable trends include higher CP and indispensable amino acid content in wheat bran and rice bran compared to other ingredients. The table also highlights the lysine content as a percentage of CP for each diet type.
AA, amino acids; DM, dry matter; CP, crude protein.
a,b,c,d,e,f,g,hMeans in the same row with different superscript letters are significantly different at P < 0·05.
Mean standardised ileal digestibility of crude protein and amino acid in the eight ingredients
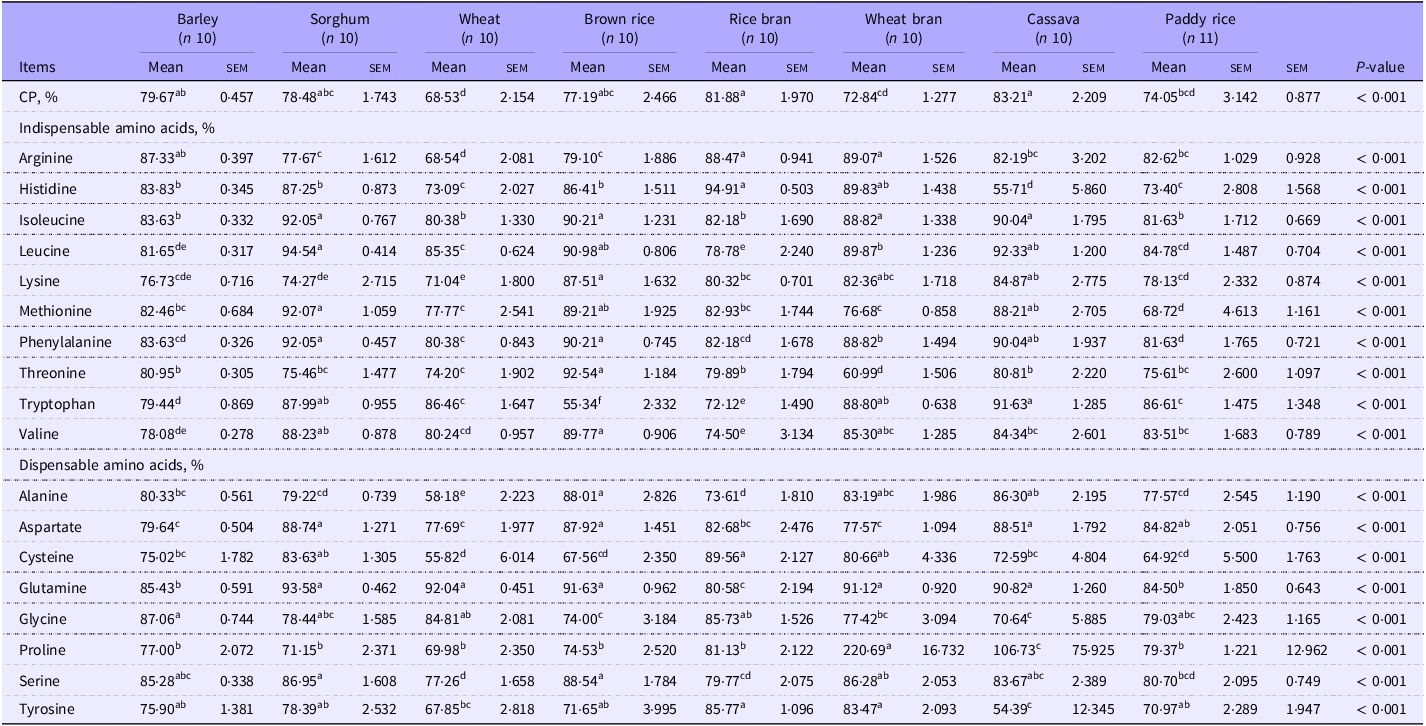
The mean SID of CP and AA in the eight ingredients for growing pigs are shown in Table 2. The mean SID of CP and the mean SID of each AA group differed significantly (P < 0·01) among the ingredients. Cassava and rice bran had higher mean SID values for CP (83·21 % and 81·88 %, respectively) than other ingredients, followed by barley, sorghum and brown rice, while lower for paddy rice, wheat bran and wheat.
For growing pigs, the SID of Lys in wheat (71·04 %) was lower than that in other ingredients, the SID of Met in paddy rice (68·72 %) was lower than that in other ingredients, the SID of Threonine (Thr) in wheat bran (60·99 %) was lower than that in other ingredients and the SID of Trp in brown rice (55·34 %) was lower than that in other ingredients. Among the respective mean SID of IAA of barley, sorghum, wheat, brown rice, rice bran, wheat bran, cassava and paddy rice, the SID values lower than other SID of IAA were Lys (76·37 %), Lys (74·27 %), Lys (71·04 %), Trp (55·34 %), valine (74·05 %), Thr (60·99 %), histidine (55·71 %) and Met (68·72 %), respectively (Table 4).
Standardised ileal digestibility (SID) of AA in barley, sorghum, wheat, brown rice, rice bran, wheat bran, cassava and paddy rice (%) (Mean values with their standard errors)

AA, amino acids; CP, crude protein.
IAAend (g/kg DM intake) averaged as CP, 19·07; arginine, 0·95; histidine, 0·28; isoleucine, 0·41; leucine, 0·28; lysine, 0·63; methionine, 0·14; phenylalanine, 0·36; threonine, 0·66; tryptophan, 0·12; valine, 0·60; alanine, 0·76; aspartate, 1·08; cysteine, 0·15; glutamine, 1·53; glycine, 0·87; proline, 5·61; serine, 0·66; tyrosine, 0·33.
a,b,c,d,e,f,g,h Means in the same row with different superscript letters are significantly different at P < 0·05.
Digestible indispensable amino acid score for the eight ingredients
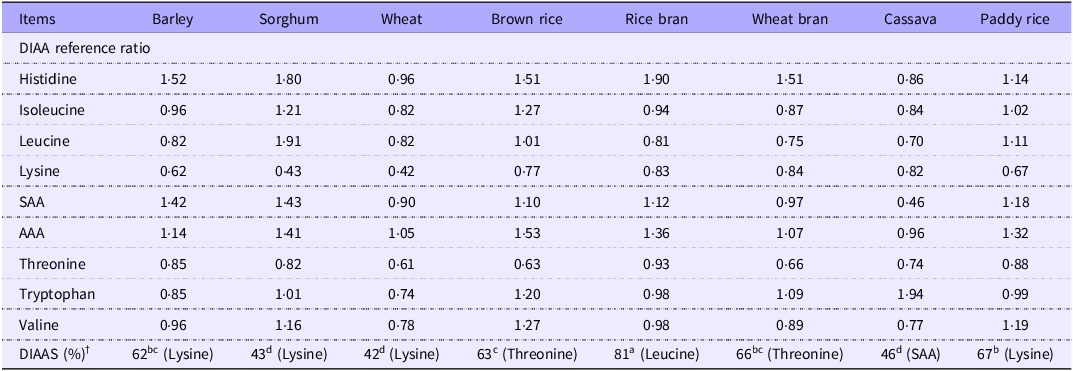
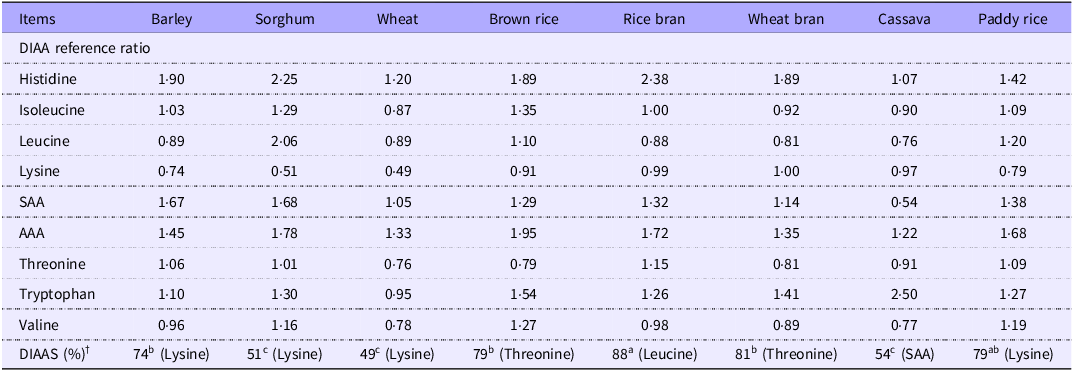
For children aged 6 months to 3 years, the first limiting AA was Lys in barley, sorghum, wheat and paddy rice, Thr in brown rice and wheat bran, leucine in rice bran and sulphur amino acid (SAA) in cassava, respectively. The DIAAS values (%) were 62 for barley, 43 for sorghum, 42 for wheat, 63 for brown rice, 81 for rice bran, 66 for wheat bran, 46 for cassava and 67 for paddy rice, respectively (Table 5). For older children, adolescents and adults, the first limiting AA was Lys in barley, sorghum, wheat and paddy rice, Thr in brown rice and wheat bran, leucine in rice bran and SAA in cassava, respectively. The DIAAS values (%) were 74 for barley, 51 for sorghum, 49 for wheat, 79 for brown rice, 88 for rice bran, 81 for wheat bran, 54 for cassava and 79 for paddy rice, respectively (Table 6).
Digestible indispensable amino acid scores (DIAAS) for barley, sorghum, wheat, brown rice, rice bran, wheat bran, cassava and paddy rice * (child 6 months to 3 years)

DIAA, digestible indispensable amino acid; AA, amino acids.
* DIAAS were calculated for the 6-month to 3-year-old child.
† Indispensable AA reference patterns are expressed as mg AA/kg protein: histidine, 16; isoleucine, 30; leucine, 61; lysine, 48; SAA (sulphur AA), 23; AAA (aromatic AA), 41; threonine, 25; tryptophan, 6·6; valine, 40(Reference Zhang, Zhang and Zhao27).
Digestible indispensable amino acid scores (DIAAS) for barley, sorghum, wheat, brown rice, rice bran, wheat bran, cassava and paddy rice * (older child, adolescent and adult)

DIAA, digestible indispensable amino acid; AAA, aromatic amino acid; SAA, sulphur amino acid.
* DIAAS were calculated for the older child, adolescent and adult.
† Indispensable AA reference patterns are expressed as mg AA/kg protein: histidine, 16; isoleucine, 30; leucine, 61; lysine, 48; SAA, 23; AAA, 41; threonine, 25; tryptophan, 6·6; valine, 40(Reference Zhang, Zhang and Zhao27).
Discussion
Barley, sorghum, wheat, cassava and paddy rice remained unrefined and were retained in their original components, including husk, bran, germ and endosperm (cassava retains its peel). These ingredients were simply crushed, enabling the assessment of their DIAAS scores in their natural state. Accurate evaluation of dietary protein quality and AA digestibility of foods is essential(Reference Herreman, Nommensen and Pennings28,29) . The FAO suggests DIAAS as the preferred method for evaluating protein quality(Reference Herreman, Nommensen and Pennings28,29) . DIAAS is determined by comparing the digestibility of individual dietary IAA in food with that in the reference protein(Reference Bailey, Mathai and Berg25). Each IAA’s digestibility is measured at the end of the ileum and modified considering basal endogenous AA losses. Human data are favoured for DIAAS, yet growing pigs are commonly employed as animal models if human data are lacking. For infants, particularly those under 6 months, bottle-fed piglets are a suitable model(29,Reference Lee, Weisell and Albert30) . Our study used growing pigs; therefore, the results are inapplicable to infants under 6 months. Although rats are an effective model for researching DIAAS, pigs are the preferred model due to their dietary and physiological similarities(Reference Deglaire and Moughan31). However, even though pigs are widely regarded as reliable models for evaluating the digestibility of dietary proteins in humans, significant differences exist between their gastrointestinal systems in terms of physiological environment, anatomical structure and enzymatic activity(Reference Kararli32). For example, the gastric pH in pigs ranges from 3 to 5, significantly higher than the more acidic human stomach (pH 1·5–3·5)(Reference Sciascia, Das and Metges33), and this potentially leads to differences in protein denaturation efficiency and enzymatic cleavage efficacy. Anatomically, pigs exhibit a gastric capacity 2–3 times larger than that of humans, coupled with substantially longer small intestines (15–21 m v. the human 4–7 m)(Reference Sciascia, Das and Metges33), collectively enhancing their nutrient absorption capacity. This structural adaptation is reflected in energy intake metrics: weaned piglets consume 0·8–1·2 MJ/kg BW⁻0·75, whereas human infants at comparable developmental stages consume only 0·26–0·29 MJ/kg BW⁻0·75(Reference Sciascia, Das and Metges33). Additionally, prior studies have demonstrated that porcine trypsin exhibits higher hydrolytic efficiency towards α-lactalbumin and β-casein than its human counterpart(Reference Deng, Gruppen and Wierenga34). These differences may lead to deviations in the DIAAS values measured using the pig model when applied to human dietary evaluation.
The CP content, AA composition and SID of our ingredients were generally within the range of published tabulated values(19,35–Reference Sauvant, PEREZ and Tran37) . However, the SID of some AA in cassava was not listed in these databases, and additional literature reports were scarce. According to the DIAAS thresholds(Reference Bailey, Mathai and Berg25), protein sources with a DIAAS > 100 are classified as excellent, while those with a DIAAS between 75 and 99 are considered good. For children aged 3–6 months, the DIAAS values of the tested ingredients ranged from 42 to 67, except for rice bran, which exhibited DIAAS scores of 81, indicating good protein quality(Reference Bailey, Mathai and Berg25,Reference Herreman, Nommensen and Pennings28,Reference Reynaud, Buffiere and Cohade38,Reference Berg, Mes and Mensink39) . The remaining ingredients exhibited low DIAAS scores. For older children, adolescents and adults, rice bran protein demonstrated a DIAAS of 88, with brown rice and paddy rice falling within the good range(Reference Bailey, Mathai and Berg25). Rice is a major global food crop and a staple for over half of the world’s population(Reference Anagha, Kuttippurath and Sharma40,Reference Zhang, Yang and Liu41) . Paddy rice consists of two parts: the rice husk and the grain (brown rice). The brown rice is processed into commonly consumed rice by removing the bran layer, known as rice bran(Reference Hudson, Dinh and Kokubun42–Reference Min, McClung and Chen44). Historically, rice bran was consumed as human food but lost popularity due to its undesirable taste(Reference Ai and Yang45). Recently, it has regained attention for its nutritional benefits(Reference Sohail, Rakha and Butt46). Our study found that the protein quality of rice bran is comparable to soyabean products(Reference Herreman, Nommensen and Pennings28,Reference Reynaud, Buffiere and Cohade38,Reference Berg, Mes and Mensink39) , though its DIAAS score has not been previously reported. Han et al. (2015)(Reference Han, Chee and Cho47) reported that the protein efficiency, net protein utilisation rate and biological utilisation rate of rice bran protein were comparable to those of animal proteins. Additionally, the true digestibility of rice bran protein (94·8 %) was significantly higher (P < 0·05) than that of rice endosperm protein (90·8 %), soya protein (91·7 %) and whey protein (92·8 %)(Reference Han, Chee and Cho47).
Han et al. (2019)(Reference Han, Han and Wang48) used growing rats to determine DIAAS scores of 42, 37 and 20 for cooked brown rice, polished rice and whole wheat in older children, respectively, with Lys as the first limiting AA. This indicated that brown rice might have a higher DIAAS score than polished rice, and the bran layer improved the overall DIAAS. Cervantes-Pahm et al. (2014)(Reference Cervantes-Pahm, Liu and Stein12) used growing pigs and found DIAAS scores of 64 and 43 for polished rice and wheat in older children, respectively, also limited by Lys. Moreover, these grains have not undergone heat treatment, such as cooking(Reference Cervantes-Pahm, Liu and Stein12). The model selection and raw material processing by Cervantes-Pahm et al. (2014)(Reference Cervantes-Pahm, Liu and Stein12) were similar to ours, and their DIAAS score for wheat in older children was close to ours. Considering that the DIAAS score of their polished rice was 64, and combined with the results of Han et al. (2019)(Reference Han, Han and Wang48), brown rice might obtain a score greater than 64 in the case of no heat treatment and using the pig model. This could explain why our study found that the DIAAS of brown rice, rice bran and paddy rice, all with the bran layer, was higher than that of polished rice by Cervantes-Pahm et al. (2014)(Reference Cervantes-Pahm, Liu and Stein12). Wheat bran and rice bran, both high-protein cereal brans, have been reported as high-quality proteins(Reference Hadidi, Garcia and Ziogkas49). Rutherfurd et al. (2015)(Reference Rutherfurd, Fanning and Miller50), using a male rat model, reported that the DIAAS score of the wheat bran protein in children aged 0·3 months to 3 years was 41, which was higher than that of rice protein concentrate (37). In our study, the DIAAS score of wheat bran for children of the same age was 66, which was higher than that of the brown rice (63), slightly lower than the paddy rice (67) and lower than the rice bran (81). In older children, the DIAAS score of wheat bran was 81, which was within the good range.
For older children, adolescents and adults, the DIAAS scores of barley, sorghum, wheat and cassava ranged from 49 to 74. The first limiting AA for barley, sorghum and wheat was Lys, while for cassava, it was SAA. Notably, except for brown rice, Lys is the primary first limiting AA in grains, consistent with previous studies(Reference Cervantes-Pahm, Liu and Stein12,Reference Sohail, Rakha and Butt46,Reference Han, Han and Wang48) . Cervantes-Pahm et al. (2014)(Reference Cervantes-Pahm, Liu and Stein12) reported DIAAS scores of 51, 29 and 43 for hulled barley, sorghum and wheat in older children, with Lys as the first limiting AA in all cases. Mathai (2018)(Reference Mathai8), using the growing pig as the model, reported that the DIAAS score of cooked sorghum flour was 45 in older children, and its first limiting AA was Lys, which was higher than 43 for black beans and 41 for toasted wheat bread. This research demonstrated that barley had a higher DIAAS than Cervantes-Pahm et al. (2014)(Reference Cervantes-Pahm, Liu and Stein12) hulled barley in older children. Considering that Cervantes-Pahm et al. (2014)(Reference Cervantes-Pahm, Liu and Stein12) adopted the direct method while our study used the indirect method, this difference may be attributed to our use of the indirect method, which reduces dietary fibre and anti-nutritional factors, influencing the results(Reference Kong and Adeola17,Reference Perera, Abdollahi and Zaefarian51,Reference Wang, Shi and Xu52) . This difference may need to be further compared by determining digestibility in vitro or in humans(Reference Sigh, Roos and Chhoun3,Reference Deglaire and Moughan31) . In our study, both sorghum and wheat exhibit DIAAS scores below 55, consistent with typical values observed for most grain proteins(Reference Han, Moughan and Li53).
Cassava is a high-yield, drought-resistant crop(Reference Li, Cui and Zhou54,Reference Okezie, Kosikowski and Markakis55) and the third most important energy source in tropical regions, feeding nearly one billion people(Reference Okezie, Kosikowski and Markakis55). In underdeveloped areas, it is often a crucial economic and food source(Reference Li, Cui and Zhou54,Reference Okezie, Kosikowski and Markakis55) . Accordingly, determining its DIAAS is important. We used air-dried whole cassava to prepare the diet. To date, no similar experimental reports have been found. In our study, the average CP content of ten cassava samples was only 2·74 %. It is noteworthy that the CP content of cassava is very low. To meet the human body’s protein needs, further processing of cassava is required.
In our study, the secondary limiting AA was leucine for barley (DIAA reference ratio 0·89) and cassava (0·76), whereas it was threonine for sorghum (1·01) and wheat (0·76). This suggests that technological interventions could enhance the protein quality of these ingredients. Notably, our results revealed that if Lys is the limiting AA for grains, their SIDLys is generally lower than 80 %, and the percentage of Lys in CP is generally lower than 5 %. For older children, the percentage of Lys in CP of brown rice is comparable with that of paddy rice. The key to a Lys DIAA ratio of 0·91 lies in its high SID value. Previous literature has reported that the SIDAA is easily negatively impacted by fibre components(Reference Li, Tian and Feng14,Reference Messad, Letourneau-Montminy and Charbonneau56,Reference Nursten57) . Fibre components, especially NDF and its lignin part, possess a high water-holding ability. This raises digestive juice viscosity, slows mass transfer and enzymatic reactions and impacts nutrient digestion and absorption(Reference Li, Tian and Feng14,Reference Messad, Letourneau-Montminy and Charbonneau56,Reference Nursten57) . Moreover, fibre components can prompt intestinal mucosa detachment, further increasing endogenous losses. These factors ultimately reduce the SIDAA (Reference Li, Tian and Feng14,Reference Messad, Letourneau-Montminy and Charbonneau56,Reference Nursten57) . Dégen et al. (2011)(Reference Dégen, Halas and Tossenberger58) reported that adding 2·5 % of soyabean hulls would reduce the AIDAA by 4·7 % to 10·8 % compared with 0 % addition (dietary neutral detergent fibre level of 14·8 % v. 13·5 %). However, adding soyabean hulls at a ratio of 2·5 % to 5 % or 7·5 % has little effect on the AIDAA. The fibre’s inhibitory effect on the AIDAA may be due to higher endogenous AA losses, which are speculated to reach a plateau after increasing. Therefore, appropriately controlling the fibre level in the diet is crucial for the DIAAS score of grains such as wheat. Additionally, Lys readily participates in the Maillard reaction with reducing sugars in fibre components due to its exposed ϵ-amino group, leading to its binding with fibre and reducing its digestibility(Reference Tang, Feng and Zhao16,Reference Mosenthin, Messerschmidt and Sauer59) . Hence, grain processing methods and temperatures must be carefully controlled. Modern industrial technologies, such as extrusion technology, can also be used to improve AA digestibility(Reference Zhang, Zhang and Zhao27). Our results indicated that another key factor in addressing Lys limitation involves increasing its percentage in CP. For older children, although Lys remains the first limiting AA for barley, its DIAAS score is 74, which is much higher than that of sorghum (43). This may be because the Lys percentage in the CP of barley is 4·6 %, which is 1·3 % higher than that of sorghum. Consequently, a diet pattern primarily based on sorghum and wheat needs to further increase the Lys content in the diet. The AA DIAA reference ratio of sorghum, except for Lys, has reached more than 1, which means that combining sorghum with Lys-rich sources can yield excellent dietary protein sources comparable to meat protein(Reference Bailey, Mathai and Berg25,Reference Herreman, Nommensen and Pennings28,Reference Hodgkinson, Montoya and Scholten60) . For instance, Malla et al. (2022)(Reference Malla, Norgaard and Larke61) reported that mixing rice with a small amount of cricket powder significantly improved the DIAAS of children from 60 to 73 and increased the DIAA ratio of Lys. Furthermore, for older children, the DIAA reference ratio of leucine in sorghum is 2·06, indicating that adding sorghum to a diet pattern mainly based on rice bran is a good choice. Formulating diets with sorghum or rice bran requires explicit consideration of anti-nutritional factors (notably tannins, phytate and fibre) and their impacts on AA bioavailability. Pan et al. (2022)(Reference Pan, Li and Gu62) reported that low-tannin sorghum (condensed-tannin content 0·5–4·2 g kg⁻¹) and high-tannin sorghum (condensed-tannin content 15·9–47·6 g kg⁻¹) exhibited AIDCP of 53·7 % and 40·2 %, respectively, while SIDLys was 68·2 % and 56·2 %. These data indicate that tannins can reduce AA digestibility by more than 10 %. Feng et al. (2023)(Reference Feng, Li and Jiang13) further showed that tannin is a negative predictor in regression equations estimating SIDLys and SIDTrp. Collectively, these findings confirm that tannins significantly impair AA bioavailability. Tannins, as polyphenolic compounds, can bind proteins to form indigestible complexes; under optimal conditions, they can precipitate up to twelve times their own weight in dietary protein(Reference Feng, Li and Jiang13). Additionally, tannins may decrease the digestibility of most AA by inhibiting digestive enzymes and brush-border transporters and by increasing endogenous protein secretion(Reference Feng, Li and Jiang13).
Neto et al. (2021)(Reference Neto, Gallardo and Junior63) demonstrated the positive effects of phytase and non-starch polysaccharide enzymes on the AIDCP of rice bran in weaned piglets. When phytase or NSP enzymes were added individually, AIDCP increased by more than 2 %; when used in combination, the improvement exceeded 12 %. This indicates that both phytate and fibre in rice bran are key anti-nutritional factors. The phosphate groups of phytate readily bind proteins, forming binary or ternary protein–phytate complexes in the upper gastrointestinal tract that may hinder protease access to cereal proteins(Reference Li, Feng and Qing64). Moreover, phytate can indirectly inhibit trypsin activity by stimulating mucin and enzyme secretion, thereby increasing endogenous AA losses and reducing digestibility(Reference Li, Feng and Qing64). As previously discussed, fibre exerts an inhibitory effect on AA utilisation. In addition, fibre in rice bran may also encapsulate nutrients and phytate, further obstructing enzymatic action on substrates(Reference Neto, Gallardo and Junior63).
Accurate protein quality assessment is valuable to nutritionists. However, its real significance is evident in addressing the global issue of malnutrition, which is prevalent in economically underdeveloped regions and among impoverished populations(Reference Mathai8). For marginalised populations, meeting AA requirements is of critical life-and-death importance. Given this, it is evident that promoting the progress of protein quality assessment is an urgent issue. For these reasons, the DIAAS system needs to be adopted, implemented and verified promptly. Besides, we believe that when selecting the ingredients for DIAAS evaluation, the initial focus should be on those that are cost-effective, of high quality and available in large quantities to accommodate the ability of these people to meet their AA requirements. Based on our research over the past 3 years, we evaluated the DIAAS of the energy-providing ingredients commonly used in diets. These ingredients are cost-effective and available in large quantities. Additionally, the DIAAS scores of some of these ingredients hold significant potential. The proper use of these ingredients can help address global protein nutrition deficiencies.
Conclusion
In conclusion, the DIAAS values of commonly used energy-providing ingredients obtained from growing pigs demonstrate the comprehensive nutritional value of the proteins in these ingredients and will contribute to enriching the DIAAS database, thus providing effective information for formulating balanced diets for humans. In this experiment, for older children, adolescents and adults, paddy, brown rice, rice bran and wheat bran have good DIAAS scores. Additionally, barley, sorghum, wheat and cassava can serve as effective dietary protein sources when optimised through appropriate technical methods and dietary pairings.
Supplementary material
For supplementary material/s referred to in this article, please visit https://doi.org/10.1017/S0007114525106016
Acknowledgements
We express our gratitude to the staff from the Key Laboratory of Subtropical Agroecological Processes, the National Engineering Laboratory of Poultry Breeding Pollution Control and Resource Technology, the Key Laboratory of Animal Nutritional Physiology and Metabolic Processes at the Institute of Subtropical Agriculture, Chinese Academy of Sciences, as well as the Center for Innovative Research on Animal Nutritional Genome and Germplasm in the College of Animal Science and Technology, Hunan Agricultural University for their support.
This study was supported by grants from the National Natural Science Foundation of China (32472957), National Key Research and Development Program (2021YFD1300201, 2021YFD1301004), the Key Project of Science and Technology of Yunnan Province (202202AE090032) and Natural Science Foundation of Hunan Province (2022JJ40532).
R. L.: Conceptualisation, writing – review & editing, investigation, supervision and funding acquisition. H. T.: Conceptualisation, methodology, formal analysis, investigation and writing – original draft. G. Y. F.: Data curation, methodology, formal analysis and investigation. M. L. D.: Methodology, formal analysis and investigation. Q. O.: Formal analysis and investigation. X. J. L.: Formal analysis and investigation. X. J. J.: Formal analysis and investigation. M. Z. T.: Formal analysis and investigation. G. Y.: Formal analysis and investigation. Q. X.: Formal analysis and investigation.
There are no conflicts of interest.
The original contributions presented in the study are included in the article, and further inquiries can be directed to the corresponding author.
The experimental design and procedures of this study were examined and endorsed by the Animal Ethics Committee of the Institute of Subtropical Agriculture, Chinese Academy of Sciences (IACUC#201302). The animal experiment was conducted in the metabolism laboratory of the same institute (Changsha, China).