INTRODUCTION
Detecting growth patterns in tropical forests can help recognize their role either as carbon sinks or as sources in response to climatic changes. Long-term studies based on permanent plots in tropical forests worldwide have shown contradictory trends. Several studies demonstrated that Amazon rain forests have been functioning as carbon sinks since the 1980s (Baker et al. Reference BAKER, PHILLIPS, MALHI, ALMEIDA, ARROYO, DI FIORE, ERWIN, HIGUCHI, KILEEN, LAURANCE, LAURANCE, LEWIS, MONTEAGUDO, NEIL, VARGAS, PITMAN, SILVA and MARTÍNEZ2004, Laurance et al. Reference LAURANCE, LAURANCE, NASCIMENTO, ANDRADE, FEARNSIDE, REBELLO and CONDIT2009, Lewis et al. Reference LEWIS, PHILLIPS, BAKER, LLOYD, MALHI, ALMEIDA, HIGUCHI, LAURANCE, NEILL, SILVA, TERBORGH, LEZAMA, MARTÍNEZ, BROWN, CHAVE, KUEBLER, VARGAS and VINCETI2004a, b; Phillips & Gentry Reference PHILLIPS and GENTRY1994, Phillips et al. Reference PHILLIPS, BAKER, ARROYO, HIGUCHI, KILLEEN, LAURANCE, LEWIS, LLOYD, MALHI, MONTEAGUDO, NEILL, VARGAS, SILVA, TERBORGH, MARTINEZ, ALEXIADES, ALMEIDA, BROWN, CHAVE, COMISKEY, CZIMCZIK, DI FIORE, ERWIN, KUEBLER, LAURANCE, NASCIMENTO, OLIVIER, PALACIOS, PATIÑO, PITMAN, QUESADA, SALDIAS, TORRES-LEZAMA and VINCETI2004). However, the vulnerability of rain forests to increasing moisture stress can turn them into sources and cause great impact on carbon balance (Philips et al. Reference PHILLIPS, ARAGÃO, LEWIS, FISHER, LLOYD, LÓPEZ-GONZÁLEZ, MALHI, MONTEAGUDO, PEACOCK, QUESADA, HEIJDEN, ALMEIDA, AMARAL, ARROYO, AYMARD, BAKER, BÁNKI, BLANC, BONAL, BRANDO, CHAVE, OLIVEIRA, CARDOZO, CZIMCZIK, FELDPAUSCH, FREITAS, GLOOR, HIGUCHI, JIMÉNEZ, LLOYD, MEIR, MENDOZA, MOREL, NEILL, NEPSTAD, PATIÑO, PEÑUELA, PRIETO, RAMÍREZ, SCHWARZ, SILVA, SILVEIRA, THOMAS, STEEGE, STROPP, VÁSQUEZ, ZELAZOWSKI, DÁVILA, ANDELMAN, ANDRADE, CHAO, ERWIN, FIORE, HONORIO, KEELING, KILLEEN, LAURANCE, CRUZ, PITMAN, VARGAS, RAMÍREZ-ANGULO, RUDAS, SALAMÃO, SILVA, TERBORGH and TORRES-LEZAMA2009). These authors reported decelerating growth in Amazon forests in response to a drought event in 2005. Others have found decelerating growth rates in La Selva, Costa Rica (1984–2000) (Clark Reference CLARK2003), Barro Colorado Island, Panama (1985–2005) and Pasoh, Malaysia (1986–2000) (Feeley et al. Reference FEELEY, WRIGHT, SUPARDI, KASSIM and DAVIES2007).
Tropical forests vary in how they respond to increasing global temperatures and CO2 levels because of regional and historical differences. Regional climatic differences between Amazon rain forests and seasonal Neotropical forests (subject to seasonal drought) may lead to different trends between them. Detecting responses of seasonal tropical forests to high temperature and low precipitation may offer important insights on their role in terrestrial carbon balance and the forces driving tropical forest dynamics. However, most long-term dynamics studies rely on few measurement intervals. Changes between two successive periods (single changes) may express transient dynamics of the forest rather than a dominant trend in growth and vital rates, especially for shorter census intervals. On the other hand, single long-term intervals can overlook important changes within the period, which may be revealing of forest dynamics. Understanding short-term and successive behaviour of forests can help determine their response to environmental changes and help management and conservation strategies.
The present work examines stand growth, mortality and recruitment rates of a tropical gallery forest in the Brazilian savanna for six successive periods, spanning a 24-y period (1985–2009). We described size-class dynamics of the forest in another paper (Roitman & Vanclay Reference ROITMAN and VANCLAY2015). Here we hypothesize that, although the forest is protected from direct human disturbances, it is not undergoing accelerated growth.
METHODS
Gallery forests
In Central Brazil's savanna biome, called cerrado, the climate is marked by alternating wet and dry seasons. Cerrado gallery forests are riparian forests bordering narrow rivers. They play a strategic role in biodiversity conservation and act as natural forest corridors connecting the Amazon and Atlantic rain forests (Oliveira-Filho & Ratter Reference OLIVEIRA-FILHO and RATTER1995). These riparian forests are adapted to seasonal climate and are naturally exposed to higher levels of disturbance, due to border effects and, sometimes, flooding regime (Appolinário et al. Reference APPOLINÁRIO, OLIVEIRA-FILHO and GUILHERME2005, Fontes & Walter Reference FONTES and WALTER2011). The watercourse provides a soil humidity gradient, which determines a compositional shift from fire- and drought-resistant outer edge species to inner forest species that are shade-tolerant and sensitive to fire and drought (Silva Júnior Reference SILVA JÚNIOR2001).
Study site
The Gama gallery forest covers 64 ha in the East-Central region of Brazil, near the city of Brasília (~ 16ºS, 48ºW) at an altitude of approximately 1100 m asl. It is located in the University of Brasilia's experimental field station. Permanent plots were established in 1985 (Felfili Reference FELFILI1993), and are one of the oldest sets of permanent plots in gallery forests.
The southern side of the forest is bordered by natural dry grassland vegetation, called campo limpo, with an abrupt transition between the two vegetation types, and the northern side is bordered by a road and suburban housing, both outside the limits of the field station. The soil is well-drained, dystrophic, with high aluminium saturation and low nutrient concentration (Felfili Reference FELFILI1993).
The regional climate is Aw, according to Köppen's (Reference KÖPPEN1900) classification, with marked rainy and dry seasons. Long-term temperature and rainfall data were obtained from the meteorological station at the Brazilian Institute of Geography and Statistics’ Ecological Reserve (RECOR-IBGE) approximately 10 km east of the study area (http://www.recor.org.br/cid360/download/17-dados-meteorológicos.html.)
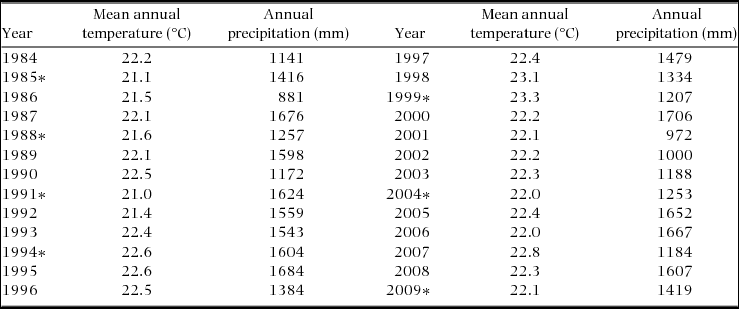
Mean annual rainfall between 1985 and 2009 was 1403 mm, with a mean annual temperature of 22.2°C. These values are within the range observed for historical series since 1965 (http://www.inmet.gov.br/projetos/rede/pesquisa/). General trends show temperature increases after 1991, and that low-rainfall years became more frequent after 1994 (Table 1). The 1991–1994 period was marked by an increase in mean annual temperature (from 21ºC to 22.6ºC) and relatively high precipitation in all years (between 1543 to 1684 mm). In the following five years (1994–1999), mean annual temperature remained high (and reached its peak in 1999) but rainfall was low, especially in the years 1998 and 1999.
Annual precipitation (mm) and mean annual temperature (oC) between 1984 and 2009, recorded close to the study area, at the Brazilian Institute of Geography and Statistics’ Ecological Reserve (RECOR-IBGE). * = forest inventory census years in the present study.

Floristic structure
In 1985, the Gama gallery forest contained 106 tree species distributed in 52 families. Species richness gradually increased to 112 in 2009. The richest families were Myrtaceae, Rubiaceae, Lauraceae, Fabaceae, Apocynaceae and Vochysiaceae. Lists of species recorded since 1985 are given in Felfili (Reference FELFILI1993), Oliveira & Felfili (Reference OLIVEIRA and FELFILI2008) and Roitman (Reference ROITMAN2011). Species abundance distribution was typical of tropical forests, with more than half of the species represented by 10 stems or fewer, and the 10 most abundant species comprised almost half of the total number of stems. The strong presence of shade-tolerant species and the small number of pioneer species and trees suggests that this gallery forest is in a late-successional stage. In 1985, there was a large proportion of shade-tolerant (49.1%) and light-demanding species (41.5%), with relatively few pioneers (9.43%). Shade-tolerant trees also comprised 55.1% of tree numbers and 40.1% of basal area, while pioneers comprised only 2.29% of trees and 1.87% of basal area (Felfili Reference FELFILI1993). These proportions remained relatively constant throughout the study period. The five most dominant species in 1985, in terms of relative abundance and basal area, were Lamanonia ternata Vell., Copaifera langsdorffii Desf., Aspidosperma olivaceum Müll. Arg., Licania apetala (E. Mey.) Fritsch and Metrodorea stipularis Mart. Most of the dominant species have maintained their relative density and basal area since 1985 (Roitman Reference ROITMAN2011).
Sample
Sampling followed a systematic strip sampling design (Felfili Reference FELFILI1995), with 151 contiguous permanent plots (10 × 20 m), divided in 10 transects perpendicular to the main watercourse, 100 m apart, sampling a total area of 3.02 ha. A topographic survey was made prior to plot establishment for topographical corrections. Transect length varied with forest width. Transect 5 was the shortest, with seven plots, whilst transect 9 contained 32 plots. The initial measurements were made in 1985 with subsequent censuses in 1988, 1991, 1994, 1999, 2004 and 2009. All stems with girth at breast height ≥ 31 cm (~10 cm diameter at breast height (dbh)) were mapped, marked with permanent tags, and measured with a girth tape. In cases of trunk anomalies, such as buttress roots or termite colonies, measurements were taken 2 cm above imperfections. Tags missing in subsequent measurements were replaced.
Analysis
Mortality and recruitment rates were based on the Lieberman et al. (Reference LIEBERMAN, LIEBERMAN, PERALTA and HARTSHORN1985) model for instant mortality: < tex − math/ > and  $m=100\cdot\frac{[{\it ln}(N_{0})-{\it ln}(N_{0}-N{m})]}{t}\; {\rm and}\; r=100\cdot\frac{[{\it ln}(N_{0})-{\it ln}(N_{0}+N_{r})]}{t}$, where m = mortality rate, r = recruitment rate, N0 = number of trees at time t0, Nm = number of trees that died during the period, Nr = number of trees recruited during the period and t = time.
Forest growth was described in terms of the rate of basal area increase, as follows:  ${\it BA}_{I}=100\cdot\frac{[{\it ln}({\it BA}_{0})-{\it ln}({\it BA}_{0}+{\it BA}_{r}\mp{\it BA}_{g})]}{t}$, where: BAI = basal area increase rate, BA0 = basal area at time t0 (m2), BAr = basal area gain due to recruitment (m2), BAg = basal area gain due to growth of surviving trees. We tested statistical significance of changes in structure and dynamics with Wilcoxon signed-rank tests (P < 0.05), using each transect as a point sample.
The rate of basal area decrease included loss by mortality and stem loss of living trees: $\ B{A_D} = 100\frac{{\vphantom{\big[}[ {ln( {B{A_0}} ) - ln(B{A_0} - B{A_m} - B{A_d}} ]}}{t}$, where BAD = basal area decrease rate, BA0 = basal area at time t0, BAM = basal area loss due to mortality, BAD = basal area loss due to decrement of surviving trees.
RESULTS
Density and basal area
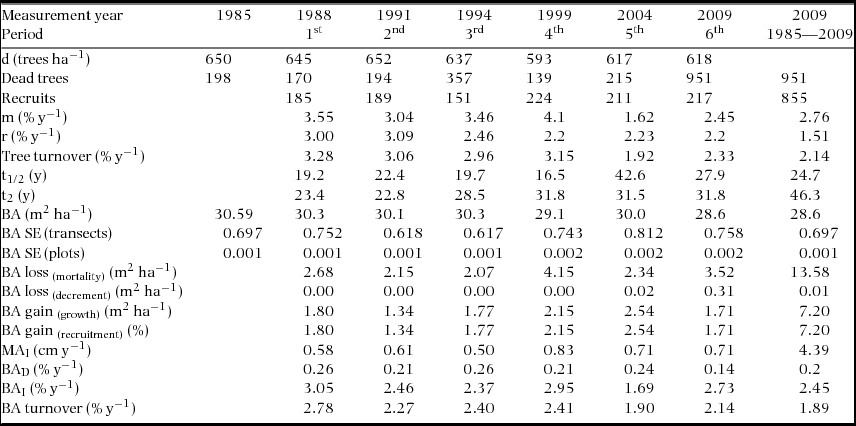
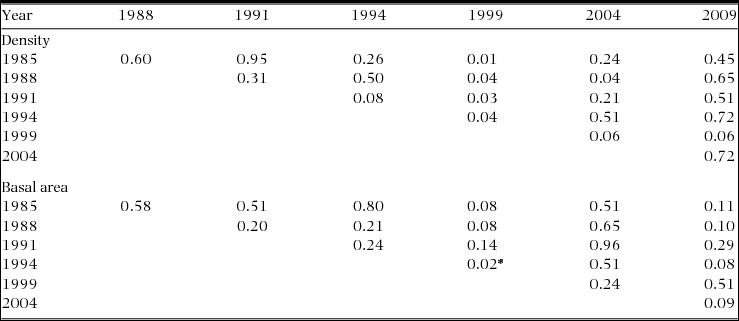
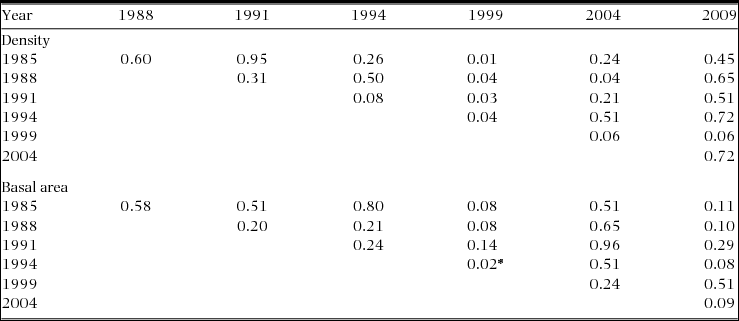
In 1985, tree density was 650 ind. ha−1 and basal area was 30.6 m2 ha−1 (Table 2). In 2009, density and basal area decreased by 4.89% and 6.52%, respectively (not significant, P > 0.05) (Table 3). Basal area loss due to shrinkage or bark loss was less than 1.03% in all measurement intervals and most basal area increase was due to growth of surviving trees rather than recruitment. Density and basal area had no significant change between successive years (Table 3), except for year 1999, when both reduced significantly.
Structure and dynamics of the Gama gallery forest for six successive periods between 1985 and 2009. Where d = density, m = mortality rate, r = recruitment rate, BA = basal area, Ste (transects) = standard error among transects, SE (plots) = standard error among plots, BAI =rate of basal area increase (growth), BAD = rate of basal area decrease, MAI = mean annual increment in diameter, t1/2 = half-life, t2 = duplication time.
Results of Wilcoxon's paired test to detect changes in tree density and basal area in the Gama gallery forest between 1985 and 2009.
Growth and survival rates
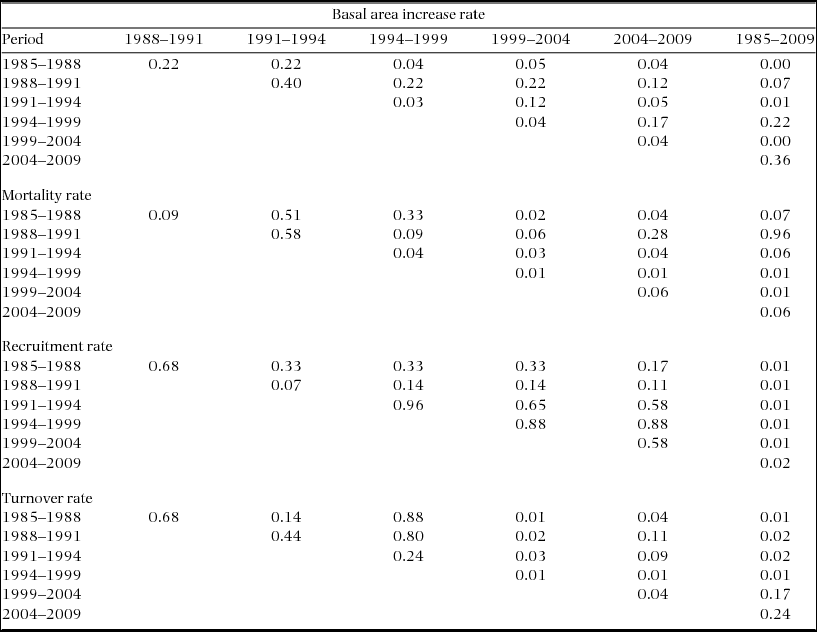
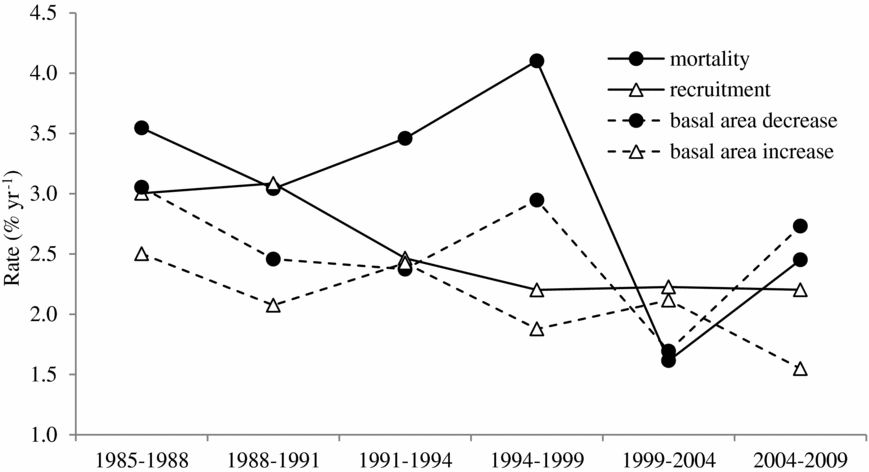
Growth, recruitment and turnover rates oscillated, but had a net decrease for the whole study period (Table 2). Growth decreased significantly in the 1994–1999 period, and all subsequent growth rates were significantly smaller than in the first census interval (Table 4). Greatest growth was observed in the first (1985–1988) and third measurement periods (1991–1994). Growth had an oscillatory behaviour: an increase in BAI immediately followed a decrease, and vice-versa. All other rates had at least one consecutive reduction or increase (Figure 1). After 1994, successive changes in BAI became more pronounced (significant at P < 0.05) (Table 4).
Results of Wilcoxon's paired test to detect changes in basal area increase, mortality, recruitment and turnover rates between 1985 and 2009.
Forest dynamic rates (rates of mortality, recruitment, basal area increase, and basal area decrease) observed in the Gama gallery forest between 1985–2009.
Mortality varied little in the first three census intervals (Table 4). In the following period (1994–1999), mortality increased significantly and presented the highest observed mortality (4.10% y−1). This elevated mortality may have contributed to the substantial reduction (P < 0.05) in mortality for the following period (1.62% y−1). Mortality directly affects BAD and, therefore, both had similar behaviour (Figure 1), except for period 1991–1994, in which mortality increased but BAD decreased in relation to the previous census interval. In this interval, fewer larger trees suffered mortality. Recruitment decreased after 1991 (Figure 1). Changes in recruitment had no statistical significance (P > 0.05) but caused significant reduction (P < 0.05) in tree turnover rates (Tables 2 and 3).
DISCUSSION
Census interval effect
Considering the effect of census interval size on growth and vital rates, mortality rate for the total period (24 y) was mostly smaller than mortality for shorter census intervals (3- and 5-y intervals) (Table 1), whereas recruitment for the total period was significantly smaller than for all other census intervals (Table 3). Thus, the present study empirically confirmed the notion that mortality and recruitment rates should decrease with census intervals (Korning & Balslev Reference KORNING and BALSLEV1994, Lewis et al. Reference LEWIS, PHILLIPS, SHEIL, VINCETI, BAKER, BROWN, GRAHAM, HIGUCHI, HILBERT, LAURANCE, LEJOLY, MALHI, MONTEAGUDO, VARGAS, SONKÉ, NUR SUPARDI, TERBORGH and MARTÍNEZ2004b, Lieberman et al. Reference LIEBERMAN, LIEBERMAN, PERALTA and HARTSHORN1985, Sheil & May Reference SHEIL and MAY1996, Sheil et al. Reference SHEIL, BURSLEM and ALDER1995). On the other hand, short intervals are more sensitive to environmental stochasticity and, therefore, mortality rates are not always smaller in shorter intervals. Mortality rates for the last two census intervals were smaller than mortality for the total period. Mortality rate decreases with census interval length because longer intervals do not include trees that recruited and died within the census interval. For example, in the longest census interval (24 y), mortality rate ignored 322 trees that had recruited after 1985 but died by 2009. Since mortality is often higher among smaller trees, such as new recruits, the census interval effect on mortality of recruits is higher than it is for overall mortality. Recruitment rates based on longer calibration periods tend to be smaller for the same reason.
Forest deceleration and driving forces
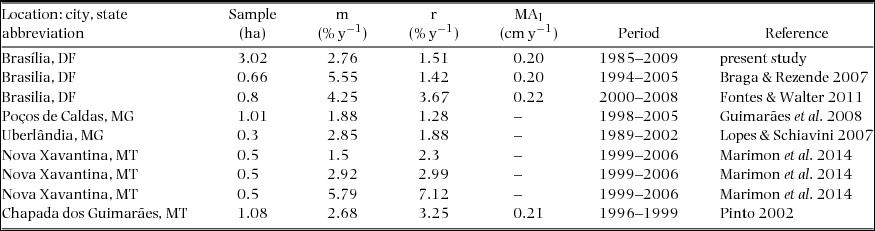
Mortality, recruitment and mean annual increment rates in the Gama forest are within the range found in other gallery forests in the Brazilian savanna (Table 5). Seasonal tropical gallery forests are highly dynamic and imbalances in favour of mortality are common and represent natural fluctuations of dynamic systems (Felfili Reference FELFILI, Cavalcanti and Walter2000). Growth, recruitment and turnover rates fluctuated, but had a net decrease for the whole study period, whereas mortality seemed to be affected by a high disturbance event during the 1994–1999 period. The observed decelerating growth trend after 1994 coincides with the rise in mean annual temperature. The 1994–1999 period had highest mortality and BAD (influenced by high mortality of large trees), and low recruitment and growth rates. In this period, there was a combination of high temperature and low precipitation (especially in the years 1998 and 1999). In the following period (1999–2004), there were 4 y of low precipitation, which may have prevented a stronger growth response of the forest. Observed trends in temperature and precipitation suggest that higher temperatures and low rainfall may be contributing to decreases in growth and recruitment and abnormal mortality rates. However, statistical confirmation of such hypotheses was not possible because of the small number of measurement periods (six) and the fact that census intervals are of 3 and 5 y, and responses to any climate anomalies or changes are dissipated over the census intervals.
Mortality, recruitment and mean annual increment found in gallery forests in the Brazilian savanna.
In the Brazilian savanna, basal area or biomass increase has been reported for closed woodland forests, such as dry forests (Carvalho & Felfili Reference CARVALHO and FELFILI2011) and gallery forests (Guimarães et al. Reference GUIMARÃES, VAN DEN BERG, CASTRO, MACHADO and OLIVEIRA-FILHO2008, Lopes & Schiavini Reference LOPES and SCHIAVINI2007), and for Amazon-savanna transition-zone gallery forests (Marimon et al. Reference MARIMON, MARIMON-JUNIOR, FELDPAUSCH, OLIVEIRA-SANTOS, MEWS, LOPEZ-GONZALEZ, LLOYD, FRANCZAK, OLIVEIRA, MARACAHIPES, MIGUEL, LENZA and PHILLIPS2014, Pinto & Hay Reference PINTO and HAY2005). Our results show an opposite trend for the Gama gallery forest, and suggest that the combination of high temperature and low precipitation may be a limiting factor for carbon assimilation in gallery forests. In seasonal tropical regions, reduced growth and high mortality are often associated with years of high temperature and low rainfall, as in El Niño episodes (Clark Reference CLARK2004). Laurance et al. (Reference LAURANCE, LAURANCE, NASCIMENTO, ANDRADE, FEARNSIDE, REBELLO and CONDIT2009) found increasing mortality rates between 1981 and 2003 in Amazon, associated to ENSO. In the Amazon-savanna transition zone, Marimon et al. (Reference MARIMON, MARIMON-JUNIOR, FELDPAUSCH, OLIVEIRA-SANTOS, MEWS, LOPEZ-GONZALEZ, LLOYD, FRANCZAK, OLIVEIRA, MARACAHIPES, MIGUEL, LENZA and PHILLIPS2014), reported biomass reduction of monodominant (1996–2010) and semi-deciduous forests (2003–2008) after a drought event in 2005. Braga & Rezende (Reference BRAGA and REZENDE2007) also observed reduction in density and basal area in a gallery forest close to the Gama gallery forest (1994–2005).
Dynamic equilibrium
Reduced growth and imbalance in favour of mortality caused non-significant reduction in density (4.89%) and basal area (6.52%). Forests are dynamic systems and their growth and vital rates should vary around an assumed stability point. If this assumption is true, then in mature and stable forests it should be possible (and perhaps expected) to detect such a pattern in turnover and growth rates, using long-term observation of permanent plots. The long-term (24 y) and fine-scale assessment (3- and 5-y census intervals) of the study allowed us to detect an oscillatory pattern of growth. This balanced behaviour shows that growth responses to changes are fast, and suggests that the forest is pulsating around a stable state (dynamic equilibrium). Nonetheless, persistence of decelerating trends, due to high frequency of high temperature and low precipitation events, may force the site's carrying capacity to a lower density or biomass state. On-going monitoring is needed to show whether the forest will continue to oscillate around a stable state or trend toward a lower biomass one.
ACKNOWLEDGEMENTS
To the Brazilian National Council for Scientific and Technological Development (CNPq) for the grant (number 557718/2009-0) and to the forest inventory research team.