





Introduction
Clostridioides difficile infection (CDI) remains a significant threat in healthcare settings primarily due to antibiotic exposure. Reference Webb, Subramanian and Lopansri1,Reference Slimings and Riley2 Although traditional metrics, such as days of therapy (DOT), have been widely used to assess antibiotic usage, Reference Webb, Subramanian and Lopansri1,Reference Kazakova, Baggs and McDonald3 recent interests have shifted toward evaluating the qualitative aspects of antibiotic pressure, specifically the spectrum of activity. Reference Kakiuchi, Livorsi and Perencevich4–Reference Kawamura, Suzuki, Endo, Ogawa and Hasegawa6 Days of antibiotic spectrum coverage (DASC) is a novel metric to quantify this qualitative burden, potentially offering advantages over simple duration-based measures. Reference Maeda, Nakata and Naito7–Reference Oda, Hayashi and Yamamoto9
In a previous single-center case–control study, cumulative antibiotic days showed significant predictive performance for CDI onset. Reference Maeda, Mori, Hiraide, Oda, Yamaguchi and Tokimatsu10 However, the difference in predictive performance between DOT and DASC was minimal. Furthermore, because the control group in the previous study was restricted to patients without diarrhea, the generalizability of the findings to broader inpatient settings was limited. Therefore, evidence of the relative impact of antibiotic quantity versus quality remains limited to specific settings. Reference Schweitzer, van Heijl and van Werkhoven11 Moreover, it remains controversial whether CDI risk is primarily driven by the length of therapy (LOT) or the intensity of concurrent multidrug regimens, as cumulative metrics such as DOT do not distinguish between the two. Reference Stevens, Dumyati and Fine12–Reference Tande, Stevens, Ilges, Lahr and Challener14 Furthermore, although minimizing antibiotic pressure is a key preventive strategy, Reference Carlson and Gonzales-Luna15 it remains unclear whether aggregated spectrum scores adequately reflect true CDI risk without accounting for individual antibiotic profiles. Consequently, clinically actionable thresholds for antibiotic duration to serve as specific alerts for de-escalation or discontinuation remain undefined in routine clinical practice. Reference Seddon, Bookstaver and Justo16
This multicenter retrospective study evaluated the distinct roles of DOT versus DASC in a broad patient population. It aimed to identify independent risk factors for CDI and characterize the continuous risk profiles of antibiotic usage metrics, providing a concrete basis for actionable antimicrobial stewardship interventions.
Materials and methods
Ethics
This study was conducted in accordance with the principles of the Declaration of Helsinki and was approved by the Ethics Committees of Showa Medical University (registration number: J250711-041) and Kochi University (registration number: ERB-111644). Informed consent was waived due to the retrospective design of the study; an opt-out option was provided on the institutional websites.
Study design and setting
This multicenter retrospective cohort study was conducted at two tertiary care hospitals in Japan, Showa Medical University Hospital (815 beds) in the Tokyo metropolitan area and Kochi Medical School Hospital (613 beds) in a regional setting, between January 1, 2016, and December 31, 2024. Considering the balance in the number of eligible patients between the two institutions, patients from Showa Medical University Hospital were enrolled from 2021 to 2023, while those from Kochi Medical School Hospital were recruited from 2016 to 2024. The study included hospitalized patients who underwent CDI testing and received systemic antibiotics within 60 days before testing, a time frame selected to capture the peak risk period for antibiotic-induced dysbiosis and subsequent CDI development. Reference Hensgens, Goorhuis, Dekkers and Kuijper17,Reference McDonald, Gerding and Johnson18 Patients <2 years of age or those with insufficient data to calculate antibiotic exposure were excluded from the study. Patients were classified according to their CDI status. CDI was defined as a positive result for glutamate dehydrogenase (GDH) and C. difficile toxins by enzyme immunoassay (EIA) or nucleic acid amplification testing (NAAT) for the toxin B gene. The non-CDI group included patients with negative GDH, toxin, or NAAT results during the same period.
Data collection and definitions
Data were retrospectively collected from electronic medical records. The collected variables comprised age, sex, intensive care unit admission, prior CDI (any time before CDI testing), malignancy, chronic kidney disease, inflammatory bowel disease, recent gastrointestinal surgery (within 30 days before CDI testing), tube feeding, facility, and year of CDI testing. Clinical status at testing was assessed by vital signs (fever, systolic blood pressure, and altered mental status) and laboratory test results obtained at or near the test date, including white blood cell count (WBC), neutrophil cell count, serum albumin, creatinine, and estimated glomerular filtration rate (eGFR). Continuous laboratory variables were categorized using clinically relevant thresholds: age (</≥ 65 years), Reference Arai19 fever (</≥ 38.0°C), Reference Singer, Deutschman and Seymour20 systolic blood pressure (</≥ 100 mmHg), Reference Singer, Deutschman and Seymour20 serum albumin (≤/> 3.0 g/dL), Reference Chi, Perkins and Khalifeh21 serum creatinine (</≥ 1.5 mg/dL), Reference McDonald, Gerding and Johnson18 and WBC (≤/>15,000/µL). Reference McDonald, Gerding and Johnson18 Concomitant medications—proton pump inhibitors (PPIs), H2 receptor antagonists, vasopressin, antineoplastic agents, and probiotics—were recorded. Diarrhea was defined as the passage of ≥3 stools per day with a Bristol Stool Scale score of ≥5. 22,Reference Lewis and Heaton23
Calculation of antibiotic use metrics
Antibiotic exposure was assessed using DOT, the LOT, the DOT/LOT ratio, DASC, the DASC/DOT ratio, and the DASC/LOT ratio. DOT was defined as the total number of days of systemic antibiotic administration, with each concurrently administered antibiotic counted separately. 24 In contrast, LOT was defined as the total number of calendar days during which a patient received any systemic antibiotic, regardless of the number of antibiotics administered simultaneously. The DOT/LOT ratio was calculated to represent the average number of concurrent antibiotics administered per day, thereby reflecting the intensity of combination therapy. DASC was used to quantify spectrum burden by multiplying the duration of each antibiotic by a predefined spectrum score and summing across antibiotics. Reference Kakiuchi, Livorsi and Perencevich4,Reference Maeda, Nakata and Naito7,Reference Maeda, Kakiuchi and Muraki25 The DASC/DOT ratio represented the average spectrum score per antibiotic day, Reference Maeda, Nakata and Naito7 whereas DASC/LOT ratio represented the average daily spectrum intensity. All systemic antibiotics administered within 60 days before CDI testing were included in this study.
Statistical analysis
Continuous variables were summarized as medians (interquartile ranges) using the Mann–Whitney U test, and categorical variables as counts and percentages using the χ2 test. Restricted cubic spline (RCS) models with three knots were employed for all three antibiotic metrics (DOT, DASC, and DASC/DOT ratio). The reference point (Odds Ratio [OR] = 1.0) was set at the cohort median for each metric. Variables for multivariable analysis were selected based on initial group comparisons, clinical relevance, and established CDI risk factors. Reference McDonald, Gerding and Johnson18,Reference Riley and Kimura26 Multivariable logistic regression was performed to estimate adjusted odds ratios and 95% confidence intervals. Model discrimination was evaluated using the C-statistic, and calibration was assessed using the Hosmer-Lemeshow goodness-of-fit test and the Brier score. Internal validation was conducted using bootstrap resampling with 1,000 iterations. Propensity score matching (PSM) was performed as a sensitivity analysis to balance measured baseline CDI risk factors between groups. Covariates were selected based on established CDI risk factors, clinically relevant baseline characteristics, and observed baseline group differences. Reference McDonald, Gerding and Johnson18,Reference Riley and Kimura26 Patients were matched 1:1 using nearest-neighbor matching. Covariate balance was visually assessed using a Love plot, with standardized mean differences (SMD) <0.1 indicating adequate balance. To assess robustness, five sensitivity analyses were conducted: replacing DOT with LOT; simultaneous modeling of LOT and DOT/LOT; restricting the analysis to toxin EIA-positive CDI; restricting to the common study period (2021–2023); and restricting to patients presenting with diarrhea. Additionally, a multivariable Cox proportional hazards model assessed time to CDI from the first systemic antibiotic exposure within the 60-day window to CDI testing, with non-CDI patients censored at testing. Finally, to investigate the specific clinical drivers behind DASC scores, utilization profiles of individual antibiotic classes and agents were compared between the CDI and non-CDI groups using Fisher’s exact test. All analyses were performed using the R statistical software version 4.5.2 (https://www.r-project.org/). A two-sided P value<.05 was considered statistically significant.
Results
Patient characteristics and antibiotic use metrics
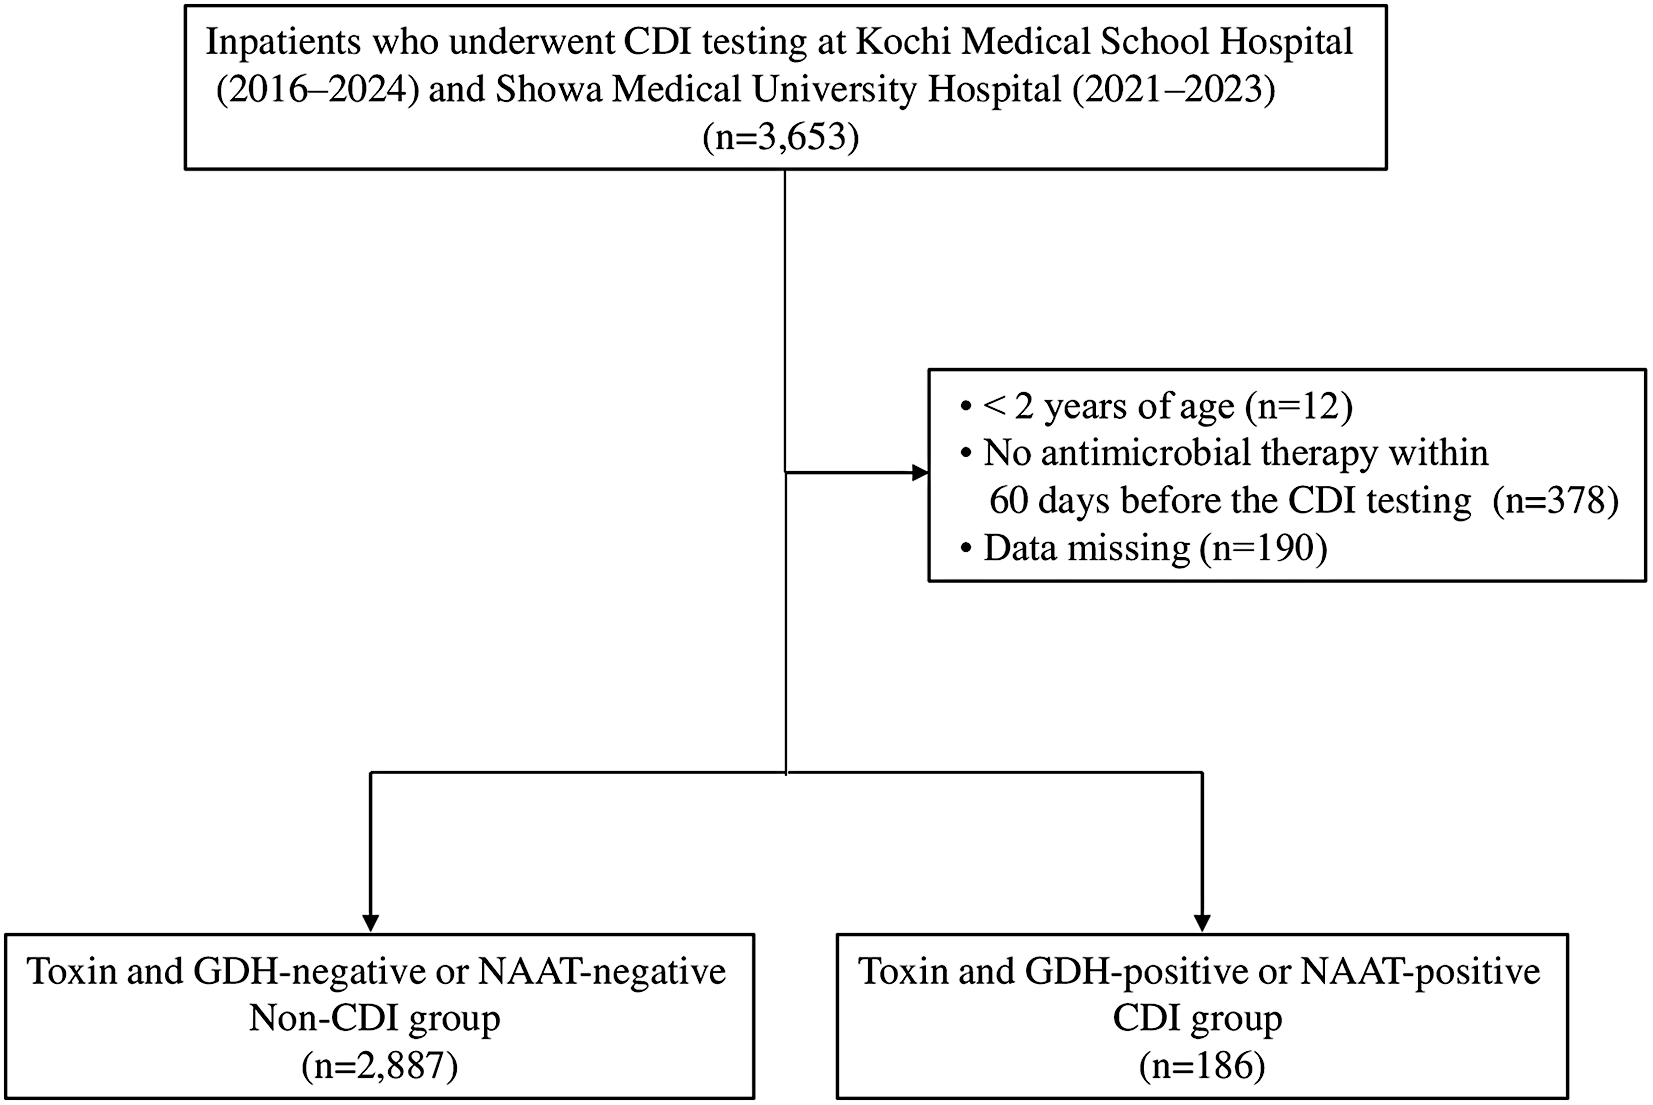
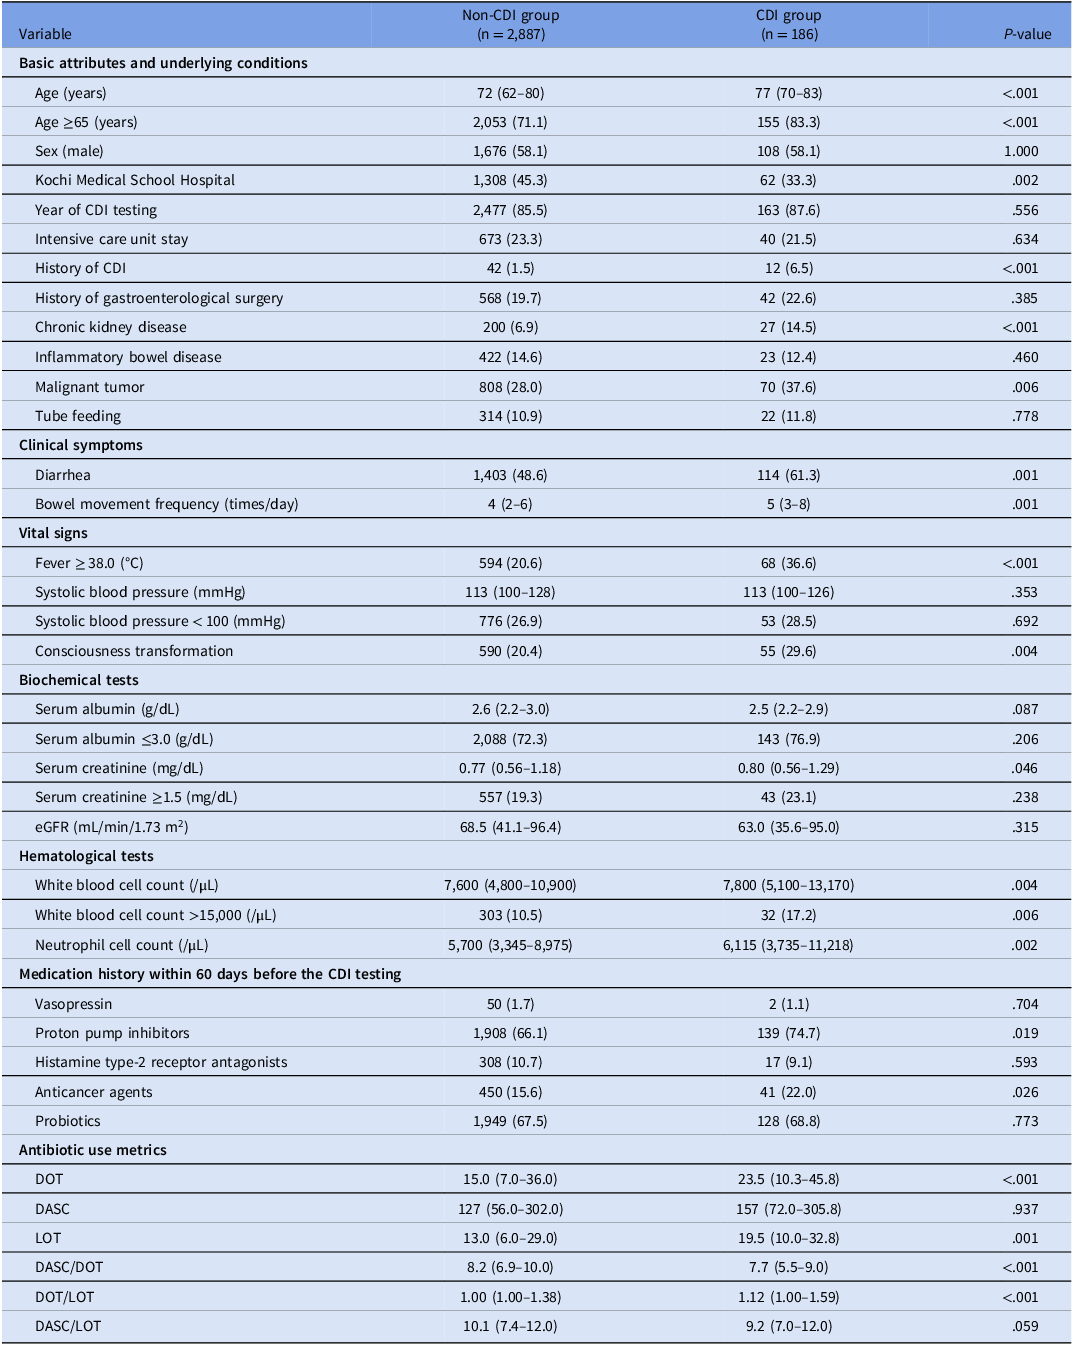
The study flow diagram is shown in Figure 1. A total of 3,073 patients met the inclusion criteria, with 186 (169 toxin EIA-positive and 17 NAAT-only positive) and 2,887 patients in the CDI and non-CDI groups, respectively. Patient characteristics and univariate comparisons are summarized in Table 1. The CDI group was significantly older (77 [70–83] vs 72 [62–80] years, P<.001) than the non-CDI group. Regarding comorbidities, the prevalence of prior CDI (6.5% vs 1.5%, P<.001; median interval from the most recent CDI case to testing, 251.0 [67.0–719.0] days overall, 27.0 [13.5–48.0] vs 482.5 [114.8–887.8] days), chronic kidney disease (14.5% vs 6.9%, P<.001), and malignancy (37.6% vs 28.0%, P = .006) was significantly higher in the CDI group than in the non-CDI group. Clinical symptoms and laboratory findings at the time of testing also differed between the two groups; the CDI group exhibited a higher frequency of diarrhea (61.3% vs 48.6%, P = .001) and fever ≥ 38.0 (°C) (36.6% vs 20.6%, P<.001), as well as elevated WBC counts (7,800 [5,100–13,170] vs 7,600 [4,800–10,900]/μL, P = .004) and serum creatinine (0.80[0.56–1.29] vs. 0.77[0.56–1.18] mg/dL, P = .046). PPIs (74.7% vs 66.1%, P = .019) and antineoplastic agents (22.0% vs 15.6%, P = .026) were administered more frequently in the CDI group than in the non-CDI group.
Study flow diagram. Flow diagram detailing the patient selection process. Patients who underwent CDI testing after receiving systemic antibiotics between January 1, 2016, and December 31, 2024 at the two participating hospitals were initially screened. After applying the exclusion criteria, the eligible patients were included in the primary analysis and categorized into the CDI and non-CDI groups. CDI, Clostridioides difficile infection; GDH, glutamate dehydrogenase; NAAT, nucleic acid amplification testing.

Baseline characteristics, clinical presentations, and antibiotic use metrics of patients with and without Clostridioides difficile infection

Table 1. Long description
The table compares baseline characteristics, clinical presentations, and antibiotic use metrics between patients with and without Clostridioides difficile infection (CDI). It has 31 rows and 5 columns. The columns are labeled ‘Variable’, ‘Non-CDI group (n = 2,887)’, ‘CDI group (n = 186)’, and ‘P-value’. The rows are grouped into sections: Basic attributes and underlying conditions, Clinical symptoms, Vital signs, Biochemical tests, Hematological tests, Medication history within 60 days before the CDI testing, and Antibiotic use metrics. Each row lists specific variables and their corresponding values for the Non-CDI and CDI groups, along with the P-value indicating statistical significance. Notable trends include higher age, prevalence of prior CDI, chronic kidney disease, and malignancy in the CDI group compared to the Non-CDI group. The CDI group also exhibits a higher frequency of diarrhea, fever, elevated white blood cell counts, and serum creatinine levels. Proton pump inhibitors and antineoplastic agents were administered more frequently in the CDI group.
Data are presented as the median (interquartile range) or n (%).
CDI, Clostridioides difficile infection; eGFR, estimated glomerular filtration rate; DOT, days of therapy; DASC, days of antibiotic spectrum coverage; LOT, length of therapy.
A strong positive correlation was observed between DASC and DOT across the primary cohort (r = 0.932, Supplementary Figure S1). DOT was significantly longer in the CDI group than in the non-CDI group (23.5[10.3–45.8] vs 15.0[7.0–36.0], P = .001). In contrast, DASC showed no significant difference between the CDI and non-CDI groups (157[72–306] vs 127[56–302], P = .937). Consequently, the DASC/DOT was significantly lower in the CDI group (7.7[5.5–9.0] vs 8.2[6.9–10.0], P<.001) than in the non-CDI group. LOT and DOT/LOT were also significantly higher in the CDI group, whereas DASC/LOT did not differ significantly.
Multivariable analysis and non-linear risk assessment
Multivariable logistic regression, adjusting for baseline patient characteristics, identified prolonged DOT and several baseline comorbidities as factors independently associated with CDI onset (Figure 2). DASC was not identified as an independent risk factor in this model.
Multivariable analysis of risk factors for Clostridioides difficile infection. Forest plot displaying the adjusted odds ratios (ORs) and 95% confidence intervals (CIs) for variables included in the multivariable logistic regression model. Dots represent the adjusted ORs, and horizontal lines indicate the 95% CIs. The vertical black dashed line indicates an OR of 1.0 (no effect). CDI, Clostridioides difficile infection; OR, odds ratio; CI, confidence interval; DOT, days of therapy; DASC, days of antibiotic spectrum coverage; DASC/DOT, days of antibiotic spectrum coverage/days of therapy.

The RCS analysis revealed continuous risk profiles for the antibiotic metrics (Figure 3). DOT exhibited a non-linear risk increase; the adjusted OR exceeded 1.0 and became statistically significant after 16.1 days (Figure 3A). DASC also showed increased risk beyond 130.9 in the RCS model (Figure 3B). Furthermore, the DASC/DOT ratio demonstrated that lower values were associated with a higher risk of CDI (Figure 3C).
Continuous and non-linear risk profiles of antibiotic metrics for Clostridioides difficile infection. Restricted cubic spline curves with three knots demonstrating the adjusted dose-response relationship between CDI risk and (A) DOT, (B) DASC, and (C) the DASC/DOT ratio. Solid black lines represent the adjusted ORs, and shaded areas indicate the 95% CIs. The reference point (OR = 1.0) is set at the cohort median for each metric. The number of patients in each interval is shown at the bottom of the plots. CDI, Clostridioides difficile infection; OR, odds ratio; CI, confidence interval; DOT, days of therapy; DASC, days of antibiotic spectrum coverage; DASC/DOT, days of antibiotic spectrum coverage/days of therapy.

Figure 3. Long description
Panel A: A line graph shows the adjusted odds ratio (OR) for Clostridioides difficile infection (CDI) risk against days of therapy (DOT). The x-axis represents DOT, and the y-axis represents the adjusted OR. The solid black line indicates the adjusted ORs, with shaded areas showing the 95% confidence intervals (CIs). The reference point (OR = 1) is set at the median DOT of 16. The number of patients in each interval is displayed at the bottom. Panel B: A line graph illustrates the adjusted OR for CDI risk against days of antibiotic spectrum coverage (DASC). The x-axis represents DASC, and the y-axis represents the adjusted OR. The solid black line shows the adjusted ORs, with shaded areas indicating the 95% CIs. The reference point (OR = 1) is set at the median DASC of 130. The number of patients in each interval is shown at the bottom. Panel C: A line graph presents the adjusted OR for CDI risk against the DASC/DOT ratio. The x-axis represents the DASC/DOT ratio, and the y-axis represents the adjusted OR. The solid black line depicts the adjusted ORs, with shaded areas showing the 95% CIs. The reference point (OR = 1) is set at the median DASC/DOT ratio of 8.1. The number of patients in each interval is displayed at the bottom.
Model validation and propensity score matching analysis
The multivariable model demonstrated predictive performance with a C-statistic of 0.734, a Hosmer-Lemeshow fit of P = .323, and a Brier score of 0.054 (Supplementary Figure S2). Internal validation using 1,000 bootstrap resamples revealed an estimated optimism of 0.028, yielding an optimism-corrected AUC of 0.706 (Supplementary Table S1), which supported the stability of the model.
After 1:1 PSM, 186 pairs of patients were included in this study. The baseline characteristics used for matching, including age, sex, prior CDI, other comorbidities, and concomitant medications, achieved excellent balance between the two groups (Supplementary Figure S3). The SMD for all matched covariates was <0.1, confirming that patient backgrounds were effectively balanced (Supplementary Table S2). In the multivariable logistic regression model adjusted for baseline covariates (Supplementary Table S3), prolonged DOT remained significantly associated with CDI (P<.001) (Supplementary Table S4). Furthermore, in this matched model, lower DASC was significantly associated with an increased CDI risk (P<.001) (Supplementary Table S4).
Sensitivity analyses and specific antibiotic profiles
Sensitivity analyses largely supported the primary findings (Supplementary Table S5). When replacing DOT with LOT, prolonged LOT remained a significant independent risk factor for CDI (adjusted OR [aOR], 1.049; 95% CI, 1.032–1.066; P<.001). In the supplementary multivariable model incorporating both LOT and the DOT/LOT ratio, both prolonged LOT (aOR, 1.011; 95% CI, 1.002–1.020; P = .017) and higher combination therapy intensity (DOT/LOT ratio: aOR, 1.248; 95% CI, 1.097–1.420; P<.001) were identified as independent risk factors. Restricting the analysis to the common years (2021–2023) yielded consistent results (DOT aOR, 1.037; P<.001). Findings were consistent in both the toxin EIA-positive and time-to-event analyses (Supplementary Tables S5 and S6). However, the statistical significance of DOT was attenuated when the cohort was limited to patients with diarrhea (P = .488).
To elucidate the prescribing patterns underlying the DASC scores, individual antibiotic profiles were compared (Supplementary Table S7). The utilization rate of piperacillin/tazobactam (ASC [antibiotic spectrum coverage] score: 11) was significantly lower in the CDI group (29.6% vs 38.3%, P = .017). Conversely, cephalosporins, which are generally assigned lower ASC scores but are recognized by current guideline as high-risk antibiotics for CDI, Reference McDonald, Gerding and Johnson18 were used significantly more frequently in the CDI group. These included cefepime (ASC score: 8; 25.8% vs 14.6%, P<.001) and ceftriaxone (ASC score: 6; 18.3% vs 12.3%, P = .017).
Discussion
The primary finding of this multicenter study was that higher DOT was independently associated with an increased risk of CDI. Specifically, the RCS analysis demonstrated a continuous increase in risk after DOT exceeded approximately 16 days. Because DOT reflects both treatment duration and concurrent antibiotic use, it should not be interpreted as treatment duration alone. Notably, both longer LOT and higher DOT/LOT were independently associated with CDI. Given that shorter therapy durations have been validated to reduce resistance without compromising clinical outcomes across various infections, Reference Spellberg and Rice27 antimicrobial stewardship programs may benefit from incorporating duration reduction measures, such as antibiotic timeouts, alongside traditional de-escalation. Reference Alegria, Marini, Gregg, Bixby, Perissinotti and Nagel28 Furthermore, as this identified time frame provides a clinical benchmark, prompt C. difficile testing is warranted for patients developing diarrhea after this cumulative exposure to facilitate timely diagnosis and intervention.
While the multivariable analysis highlighted DOT as an associated factor for CDI, the role of spectrum intensity merits careful interpretation. A recent retrospective cohort study demonstrated that higher antibiotic exposure intensity, measured by the Antibiotic Spectrum Index per antibiotic day, was independently associated with an increased risk of healthcare-associated CDI.Reference Ray, Strnad and Tucker 13 In the present study, our RCS analysis demonstrated that an increase in DASC itself did not elevate the risk of CDI. In fact, in the propensity score-matched model, lower DASC emerged as a significant risk factor. This apparent paradox must be interpreted cautiously, recognizing that DASC quantifies the breadth of the antimicrobial spectrum rather than directly reflecting the CDI-inducing potential of individual drugs. To elucidate the clinical drivers behind this phenomenon, we evaluated the specific antibiotic utilization profiles of our cohort (Supplementary Table S6). Notably, the use of piperacillin/tazobactam—a broad-spectrum antibiotic with a high ASC score—was significantly less frequent in the CDI group. Conversely, the CDI group exhibited a significantly higher use of cephalosporins, specifically cefepime and ceftriaxone. Although these antibiotics have relatively lower ASC scores, they are well recognized in the IDSA/SHEA guidelines for their profound impact on the gut microbiome and substantial CDI risk. Reference McDonald, Gerding and Johnson18 For ceftriaxone, substantial biliary excretion may contribute to CDI risk despite its relatively low ASC score, a pharmacokinetic feature not captured by the ASC scoring. Reference Wendt, Ranft, Rodloff, Lippmann and Lübbert29 Therefore, the association between lower DASC and higher CDI risk does not imply that lower-score regimens are inherently safe; rather, it reflects a compositional difference where specific low-score, high-risk antibiotics disproportionately drove the CDI incidence in our cohort.
In a different clinical context, another recent study highlighted the long-term impact of cumulative antibiotic exposure. It reported that increasing cumulative antibiotic therapy prior to bloodstream infection, quantified by the modified ASI, was associated with an increased risk of CDI over a 1-year period. Reference Tande, Stevens, Ilges, Lahr and Challener14 This suggests that the impact of spectrum intensity metrics, such as DASC or ASI, might be more pronounced when evaluating long-term cumulative risks across specific patient populations or extended observation windows. In contrast, our findings suggest that focusing on DOT and the DASC/DOT ratio—which reflects qualitative patterns of use—for short-term CDI prediction may provide an immediate and practical framework for antimicrobial stewardship.
The internal validity of our multivariable model was corroborated via a 1,000-iteration bootstrap analysis, which yielded minimal optimism. Given the inherent heterogeneity of patient populations and prescribing practices across a multicenter cohort, Reference Prosty, Bortolussi-Courval, Lee, Lee and McDonald30 this minimal degree of overfitting supports the robustness of the identified risk factors, particularly the independent prognostic value of DOT. Consequently, our risk estimates are unlikely to be merely data set-specific findings, thereby reinforcing their applicability as benchmarks for antimicrobial stewardship.
The overall CDI positivity rate was 6.1%, with rates of 4.5% and 7.3% at the respective institutions. This variance falls well within the general epidemiological range for tertiary care facilities, reflecting inherent real-world differences in patient demographics and institutional practices. Reference Riley and Kimura26,Reference Viprey, Davis and Benson31 Furthermore, PSM reduced measured differences in baseline CDI risk factors between groups, supporting the robustness of the primary findings. Reference Gabriel, Grigorian and Phillips32 While baseline facility variance is expected, the persistence of institutional differences as a risk factor even after this adjustment suggests that facility-level factors, such as infection control practices or testing thresholds, continue to exert a notable impact on CDI incidence. Reference Oh, Makar and Fusco33 Crucially, despite these facility-level influences, the independent association of prolonged DOT remained consistent across our multivariable model and prespecified sensitivity analyses, including a model restricted to common study years (2021–2023) to eliminate temporal biases between facilities. This indicates that stewardship interventions focusing on reducing antibiotic duration are universally applicable, irrespective of a patient’s underlying clinical condition Reference Ostrowsky, Ruiz and Brown34 or a facility’s baseline CDI incidence.
The retrospective nature of the study introduces several limitations. Since our control group exclusively included patients receiving antibiotics, baseline DASC may be elevated in such cohorts, which could potentially mask spectrum-related risks. Additionally, when restricting the sensitivity analysis to patients presenting solely with diarrhea, the statistical significance of DOT was attenuated. This may reflect limited statistical power or difficulty distinguishing CDI-specific from antibiotic-associated diarrhea. Pretest hospitalization duration and referral source could not be consistently ascertained, and the time since prior CDI was not included in adjusted models, leaving potential residual confounding. NAAT-only positivity may also have included colonization; however, the toxin EIA-positive analysis yielded consistent findings. Furthermore, unmeasured confounders, such as specific dietary factors or ward-level environmental contamination, remain possible sources of bias. Reference Brown, Valenta, Fisman, Simor and Daneman35 Prospective studies should evaluate whether stewardship alerts based on DOT thresholds reduce CDI incidence. Additionally, integrating the genomic analysis of C. difficile strains with these metrics could help elucidate whether specific strains would be more prone to proliferation under prolonged antibiotic pressure, Reference Lorenzo-Diaz, Klassert and Zubiria-Barrera36 potentially paving the way for more precise stewardship strategies.
Prolonged DOT was identified as a primary factor independently associated with CDI, with the risk increasing after 16 days of exposure. Furthermore, the risk associated with lower DASC highlights the CDI-inducing potential of specific lower-score, high-risk antibiotics. Ultimately, antimicrobial stewardship interventions could benefit from incorporating duration reduction measures alongside careful evaluation of individual antibiotic CDI risks during spectrum optimization.
Supplementary material
The supplementary material for this article can be found at https://doi.org/10.1017/ice.2026.10597.
Data availability statement
The datasets generated and analyzed during the current study are not publicly available due to patient privacy and institutional ethical restrictions. However, de-identified data set used for the analysis is available from the corresponding author on reasonable request, subject to approval by the relevant institutional review boards.
Acknowledgement
We would like to thank Editage (www.editage.jp) for the English language editing.
Author contribution
Conceptualization: Y. Yagi, MM. Methodology: Y. Yagi, MM. Formal analysis: Y. Yagi. Investigation: Y. Yagi, NM, MH, MO, KY. Data curation: Y. Yagi, NM, MH, MO, KY. Validation: MM. Visualization: Y. Yagi. Writing—original draft: Y. Yagi. Writing—review and editing: MM, NM, MH, MO, KY, YA, Y. Yamagishi, IT, YH. Supervision: YA, Y. Yamagishi, IT, YH. Project administration: MM. Funding acquisition: MM.
Funding statement
This work was supported by JSPS KAKENHI (grant number 25K20555).
Competing interests
All authors report no conflicts of interest relevant to this article.


 Open access

