I. INTRODUCTION
Due to increasing environmental concerns, the microelectronics industry is replacing Pb-containing solders by Pb-free solders. In the recent publications, SnAg-based solder has emerged as one of the most promising Pb-free candidates to replace the conventional eutectic SnPb solder in flip-chip technology.Reference Tu, Gusak and Li1–Reference Zeng and Tu3 A reliable solder joint can be formed by a metallurgical reaction between molten solders and the under-bump metallization (UBM) layer on the chip side, as well as on the substrate side; the interfacial reaction produces intermetallic compounds (IMCs) at the joint interfaces.Reference Kang and Ramachandran4 The growth of these IMCs can strongly affect the mechanical reliability of the solder joints.Reference Alam, Chan and Hung5–Reference Tu and Zeng7 As a result, the selection of appropriate metallization layer plays an important role in developing a reliable joint.
Cu and Ni are the two common metallization materials used in the packaging industry. Cu provides a rapid reaction and an excellent wetting property with the solder alloy.Reference Kim and Tu8 However, the fast consumption rate of the Cu UBM may cause spalling of the interfacial IMC after longer reflowing time.Reference Liu, Kim and Totta9, Reference Kim, Tu and Totta10 Because of the much higher reaction rate of Sn-based Pb-free solders with Cu, the spalling issue becomes more serious. Instead, Ni-based UBMs, such as electroless Ni (EL-Ni) alloy and electroplated Ni (EP-Ni), have attracted more attention in recent years because of their good wettability,Reference Wassink11 acting as a good diffusion barrier, and the slow reaction rate with solders.Reference Tu and Zeng7, Reference Kim, Jang, Lee and Tu12 Many studies have been published on the interaction between Ni–P and Sn-based solders.Reference Lin and Liu13–Reference Sharif, Chan, Islam and Rizvi25 They mainly investigated the formation and growth of IMCs at the interface between molten solder and Ni–P UBM, solder reaction-assisted crystallization of Ni–P alloy, and the influences of the IMCs on the mechanical properties of the solder joints. The Ni–P metallization has been found to be a main issue for the interface strength since voids form at the interface and the IMCs detach easily after a longer reaction time.
Most of the previous works focused on solder/Ni–P reaction. However, only few have been done on the interfacial reaction between molten solder and EP-Ni.Reference He, Kumar, Yeo, Qi and Chen26–Reference Shen, Chan and Liu32 The comparison between molten solder and the Ni-based metallization in flip-chip solder joints has not been investigated systematically, nor the kinetics of the growth and the interfacial reaction. In this study, the interfacial reaction between the eutectic SnAg solder and the EP-Ni is investigated using flip-chip joints and bumped die samples. The IMC growth rate was measured at various temperatures and time durations, and thus the activation energy for the interfacial reaction can be obtained. This study provides the fundamental understanding on the kinetics of the interfacial reactions in flip-chip SnAg solder joints with EP-Ni UBMs.
II. EXPERIMENTAL PROCEDURE
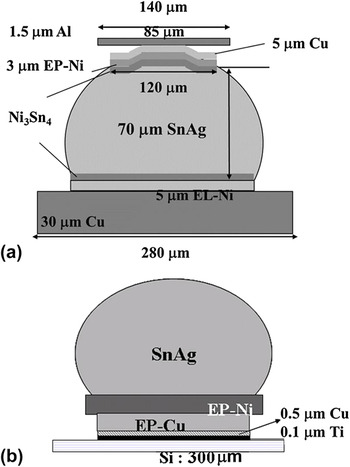
To examine the interfacial reaction and mechanical properties, two types of specimens were used. Figure 1(a) shows the flip-chip sample for the interfacial reaction study, whereas bumped die sample is adopted to be the comparison and to facilitate the shear test on the solder bump as shown in Fig. 1(b). The dimensions of the samples are labeled in the figures. On the chip side for both samples, titanium of 0.1 μm was sputtered onto the oxidized Si wafer to serve as an adhesion layer. Then 0.5-μm-thick Cu was then sputtered on the Ti layer and served as a seed layer for the subsequent electroplating process. Cu and Ni layers were electroplated on the Ti/Cu layers. Photolithography was applied to define the contact opening on the chip side for solder electroplating of eutectic SnAg solder. The solder bumps were formed by reflowing in an infrared oven at 260 °C for 1 min. For flip-chip package samples, the bumped dies were then mounted to FR5 substrates by another reflow at 260 °C for 1 min. Therefore, for the flip-chip samples, the reflow time on the EP-Ni/solder interface was 2 min, whereas it was only 1 min on the EL-Ni/solder interface. The pad metallization on the substrate side was 5-μm EL-Ni on 30-μm-thick Cu lines. The solder bumps experienced another reflow during the mounting process. For metallurgical reactions at the liquid state, flip-chip samples were reflowed at 230, 240, 250, and 260 °C for 5, 10, 15, and 20 min, respectively, on a hot plate, whereas bumped die samples were reflowed for 1, 5, and 10 min. The Si side was placed on the hot plate so that the temperature in solder was close to the temperature on the hot plate. The samples were cooled in air, and the cooling rate is around 0.5 °C/s. The temperature gradient should be small and thus have effect on the IMC formation. In addition, because we cooled the samples in the air after each reflow process and the Sn–Ni reaction is slow, the cooling stage may not have an obvious influence on the interfacial morphology and thickness. The microstructures of the solder bumps were examined by a scanning electron microscope (SEM) (JEOL 6500, Tokyo, Japan). Backscattered electron images of SEM were used to examine the morphology of the cross-sectioned SnAg samples. The compositions of the solder joints and the IMC were analyzed quantitatively by energy dispersive spectroscopy (EDX) and an electron probe microanalyzer (EPMA) (JXA-8800M, JEOL, Tokyo, Japan). To facilitate the observation of the interfacial IMCs, a solution of nitride acid and acetone at the ratio of 49:1 was used for the selective etching of Sn. The thickness of the IMC was calculated by a commercial software, Image J. To obtain the average IMC thickness, six bumps were measured for each condition. Each bump was scanned 25 times by the software to reduce the artificial deviations. Moreover, to study the effects of different reflow durations on the mechanical properties of the solder, the shear strength was assessed by the shear punch testing. Test was carried out at the room temperature and run with a constant crosshead speed of 100 μm/s. The shear height is about 15 μm above the Si die. After the shear tests, failure morphology was analyzed by SEM.
(a) Schematic structure for flip-chip sample used in this study. Electroplated Ni (EP-Ni) was adopted on the chip side, and electroless Ni (EL-Ni) was fabricated on the substrate side. (b) Schematic illustrations for bump-die used in this study: SnAg solder bump on EP-Ni under-bump metallization.

III. RESULTS
A. Growth of IMCs and Ni consumption rate
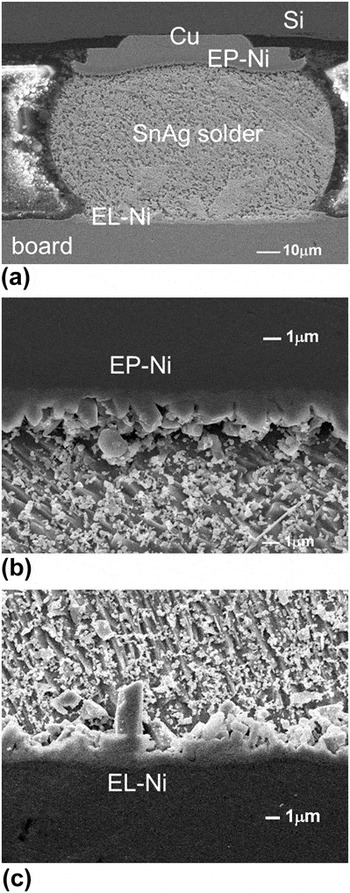
The flip-chip samples provide a direct comparison between the EP-Ni/solder and EL-Ni/solder interface. Figure 2(a) shows the cross-sectional SEM image for the as-received flip-chip samples; two interfaces are noted here, i.e., the EP-Ni/solder interface located on the chip side and the EL-Ni/solder interface on the substrate side. The bump height is 75 μm. The enlarged SEM images of these two interfaces are illustrated in Figs. 2(b) and 2(c), respectively. Due to the fabrication processes described above, the EP-Ni/solder interface experienced reflows two times, which correspond to 2-min duration of liquid state reaction. On the other hand, the interface of EL-Ni/solder experienced only 1-min liquid state reaction. Two different types of the IMC morphology can be observed. The IMCs on the two interfaces were both identified to be Ni3Sn4. Column-type IMCs are observed on the EP-Ni surface, whereas needle-type IMCs are observed on the EL-Ni surface. The height of the column-type IMCs is more uniform than the needle-type IMCs.
Cross-sectional scanning electron microscopic (SEM) images showing microstructure of the interfacial Ni3Sn4 intermetallic compounds (IMCs) for (a) whole bump; (b) enlarged image on the EP-Ni interface (chip side); (c) enlarged image on the EL-Ni interface (board side).

The IMCs on the EP-Ni grew slower than that on the EL-Ni as shown in Figs. 2(b) and 2(c); the IMCs on EP-Ni/solder interface was measured to be 0.94 μm, which is thinner than that on EL-Ni/solder interface (1.31 μm). This thinner layer indicates that the growth rate of initial IMCs is slower on the EP-Ni side since the EP-Ni/solder experienced one more minute reflow than the EL-Ni/solder interface. The Ni3Sn4 formation rate on the EL-Ni side is more than 1.4 times faster than that on the EP-Ni side.
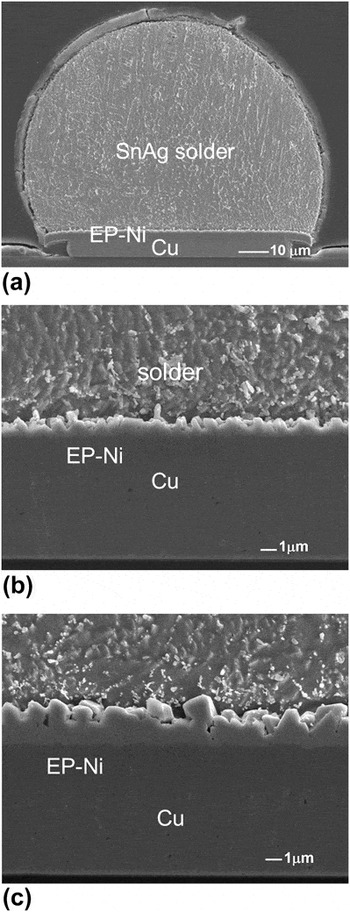
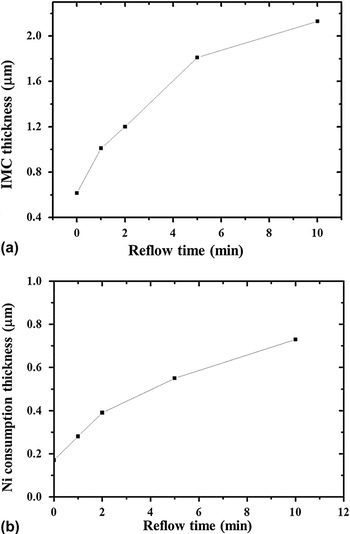
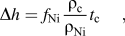
The bumped die samples were used to measure the IMC growth rate and the EP-Ni consumption rate at typical reflow temperature of 260 °C for eutectic SnAg solders without the influence of EL-Ni. Figure 3(a) shows a cross-sectional SEM image for the as-received SnAg bump with an EP-Ni UBM, and the enlarged image for the interfacial IMCs is shown in Fig. 3(b). After reflowed for 10 min at 240 °C, the column-type IMC still attached well with EP-Ni UBM, as depicted in Fig. 3(c). Only about 0.8 μm of EP-Ni was consumed after 10-min reflow process, and 2.6-μm IMCs are formed as shown in Figs. 4(a) and 4(b). The measured Ni consumption rate of EP-Ni is 1.33 × 10⁻³ μm/s under this reflow condition within 10 min. We obtained the average IMC thickness using the following equation:
Cross-sectional SEM images for the SnAg solder on EP-Ni (bump-die): (a) whole bump; (b) magnified image for the interfacial structure of as-fabricated bump; (c) the interfacial microstructure after reflow for 10 times.

(a) Measured Ni3Sn4 IMC thickness versus reflow time in bumped die sample; (b) measured Ni consumption thickness versus reflow time.

where Δh is the Ni consumption thickness; f Ni is the weight fraction of Ni in the Ni3Sn4 IMCs; ρ Ni and ρ c is the density of Ni and the IMC, respectively; and t c is the IMC thickness.
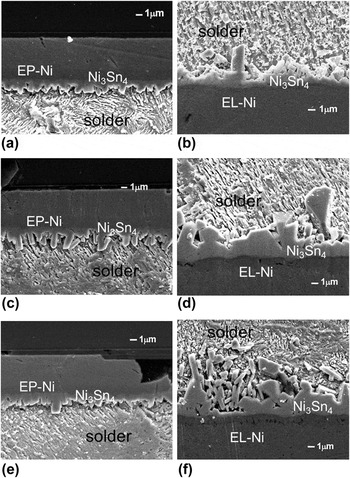
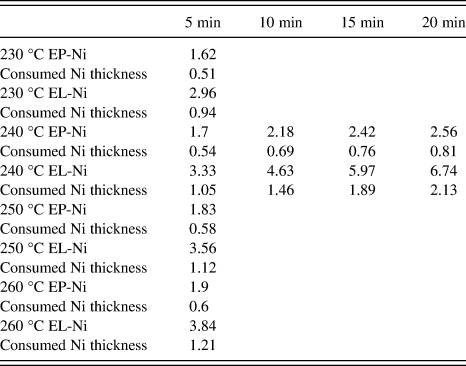
For flip-chip samples, Table I lists the measured IMC thicknesses for various temperatures and time durations. Since we want to obtain the activation energy for the formation of Ni3Sn4, we need to make sure that all the IMCs are Ni3Sn4. For the reflow temperatures higher than 240 °C and longer than 5 min, the IMCs would transform into (Ni,Cu)3Sn4. Therefore, we did not measure the IMC thickness for the rest of the conditions in Table I. The corresponding SEM images of IMC thickness variation with time and temperature are shown from Figs. 5(a)–5(f). From 5- to 20-min reflow, the IMCs at EP-Ni side remained column type and indicated that the IMCs grew in a slow thickening process with a rough surface toward the liquid solder. From EDX analysis, IMCs are detected to be Ni3Sn4 and there is residual EP-Ni existed between IMCs and Cu UBM. In other words, IMCs attached well even after 20-min reflow under 240 °C. However, the IMCs on the EL-Ni side are needle type. Moreover, as reflow duration increased, IMC grew thicker rapidly and some of the IMCs spalled away from interface as indicated by the arrows in Fig. 5(f). According to the SEM images, it is obvious that the growth rate on EP-Ni is much slower than that on EL-Ni. It is suggested that the crystalline Ni3P layer might play an important role and the detail would be discussed later.
Cross-sectional SEM images showing microstructure of the Ni3Sn4 IMCs reflowed at 240 °C. (a) EP-Ni end, 5 min; (b) EL-Ni end, 5 min; (c) EP-Ni end, 10 min; (d) EL-Ni end, 10 min; (e) EP-Ni end, 20 min; (f) EL-Ni end, 20 min.

Average thickness in micrometer of the Ni3Sn4 IMCs for various reflow conditions.

The consumed Ni thickness is also shown in the table.
It is known that the growth kinetics of the continuous IMC layer can be expressed with an empirical power law which is describing the average IMC thickness (h) as a function of time (t) and temperature (T):

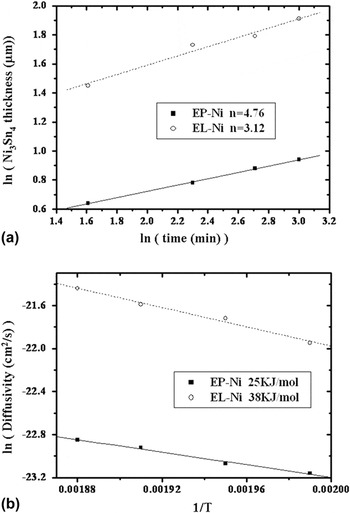
where h 0 is the initial IMC thickness, k h and n are constants, Q h is the activation energy for the thickening process, and R is the universal gas constant. According to Eq. (1), if we plot Ni3Sn4 thickness against the natural log of reflow time for both EP-Ni and EL-Ni layer, the fitting of the experimental data can be obtained as shown in Fig. 6(a), yielding n values of 4.76 and 3.12 for EP-Ni and EL-Ni systems, respectively. This result is comparable with the n values of 4.55 and 4.69 reported by Ghosh for Ni3Sn4 scallops formation in SnAg/Ni system at temperature range of 230–290 °C up to 5 min.Reference He, Kumar, Yeo, Qi and Chen26 Taking natural log of diffusivity and plotting versus with reciprocal temperature, the activation energy for IMC growth of EP-Ni and EL-Ni can be obtained. The activation energies are measured to be 25 kJ/mol and 38 kJ/mol for the IMC formation on EP-Ni and EL-Ni, respectively, as shown in Fig. 6(b). These values are quite different compared with the activation energy of 13–17 kJ/mol, which is obtained from Ni diffused in liquid Sn in previous research.Reference Kang and Ramachandran4
(a) Plot of the Ni3Sn4 thickness against the reflow time for both EP-Ni and EL-Ni metallizations; (b) Arrhenius plot for both EP-Ni and EL-Ni metallizations. The activation energies were determined to be 25 KJ/mol and 38 KJ/mol for the IMC growth on EP-Ni and EL-Ni, respectively.

B. NiSnP phase between Ni3Sn4 and Ni3P
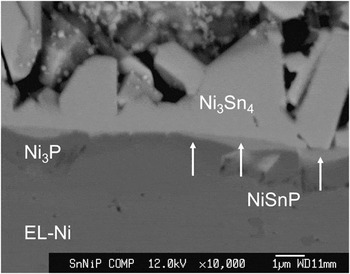
For further detailed analysis on the interfacial IMCs on the EL-Ni side, EDX and EPMA were used to identify phases on the interface. Figure 7 shows the analysis results for the interfaces in between SnAg solder and EL-Ni UBM layer after 5-min reflow at 230 °C. A layer with a composition containing Sn, Ni, and P exists between the Ni3Sn4 and Ni3P. This layer is labeled in the figure. Quantitative EPMA analysis shows that Sn concentration varies inside the NiSnP region with location close to Ni3Sn4 side containing larger amount of Sn and vice versa. The stoichiometry of those elements of this thin layer can be identified using EPMA, and the formation mechanism has been explained by Lin et al.Reference Lin, Wang and Duh33
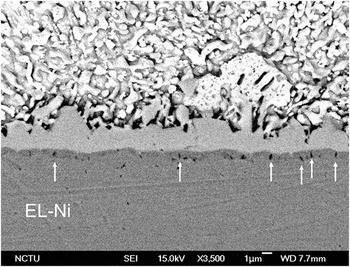
Cross-sectional SEM image showing the electron probe microanalyzer analysis of NiSnP layer between the Ni3Sn4 and Ni3P layers in flip-chip SnAg sample reflowed at 250 °C for 5 min.

C. Kirkendall voids formation in the interface of solder/EL-Ni
Kirkendall voids, as indicated by the arrows in Fig. 8, can be observed inside Ni3P layer in every sample. Even after reacted at 230 °C for 5 min, voids inside crystallized Ni3P can be observed as well. These Kirkendall voids have been reported in previous literatures.Reference Zeng and Tu3, Reference Ghosh31 Similar situations occurred in our study. Due to the unbalanced atomic fluxes from EL-Ni to molten solder, Ni3P layer formed easily as Ni continued diffusing out. Therefore, Kirkendall voids can be obtained inside Ni3P layer.
Kirkendall void formation at the interface of Ni3Sn4 and EL-Ni metallization after reflow at 230 °C for 5 min.

Furthermore, the amount of voids increased with the increase of reflow durations and temperature. However, there is no such void found on EP-Ni, and the interface remained almost the same regardless of the reflow temperature and durations, except that the interfacial IMCs grew thicker. Some Ni3Sn4 IMCs on the EL-Ni side was spalling into solder. He et al.Reference He, Lau, Qi and Chen23 reported that the stress, which generated during the formation of IMC through the liquid–solid reaction, would cause the IMCs spalling from the Ni(P) metallization. As the IMC layers grew thicker, the compressive stress may squeeze out the IMCs, causing the spalling of the IMCs.
D. Shear test
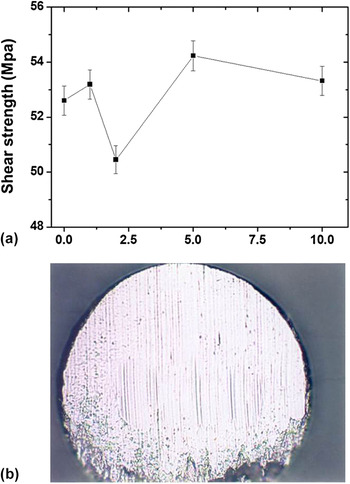
The shear tests were also performed on the SnAg solder bumps on EP-Ni UBM. Figure 9(a) depicts the measured shear stress as a function of reflow time at 260 °C. It is not clear at this moment why there was a dramatic decrease in shear stress after 2-min reflow. All measured stresses are higher than required specification. Furthermore, all the fracture occurred inside solder joints, as shown in Fig. 9(b). The fracture mode indicates that the solder/EP-Ni interface is good even after 10-min reflow.
(a) The measured shear stress as a function of reflow time for the bumped die samples. (b) Typical ductile fracture surface after the shear tests.

IV. DISCUSSION
A. IMC growth kinetics in liquid state reaction
During soldering process, it involves several stages, including phase nucleation, atomic transfer across the interface, creation or annihilation of point defects, and Ni dissolution into the molten solder. Therefore, the kinetic parameters measured from the experimental data may have contained all these steps. The thickening process of Ni3Sn4 in Fig. 6(a) demonstrates a different behavior from diffusion-controlled growth, which predicts t 1/2 growth kinetics,Reference He, Kumar, Yeo, Qi and Chen26, Reference Takaku, Liu, Ohnuma, Kainuma and Ishida34, Reference Dauskardt, Haubensak and Ritchie35 and from a scallop coarsening by a ripening process referring to t 1/3.Reference Kim and Tu36 The results obtained from our experiments are comparable to those reported by Ghosh.Reference Ghosh27 According to Ghosh, the thickening kinetics of Ni3Sn4 scallop is related to the radial growth kinetics and the diffusion through liquid channels between neighboring IMC grains.
Kang and RamachandranReference Kang and Ramachandran4 reported the interfacial reaction kinetics between pure liquid Sn and bulk Ni. Three kinetic regions for intermetallic growth could be found, where Ni3Sn4 was the dominant phase, in the temperature range of 300–513 °C: initial with n = 1.85, intermediate with n = 8.33, and final with n = 1.59. Kang reported the interfacial reaction between EP-Ni on Cu and various kinds of solders without kinetic parameters.Reference Kang, Rai and Purushothaman37 Gur and BambergerReference Gur and Bamberger38 reported that both thickening and grain growth kinetics of Ni3Sn4 follow parabolic law in Ni/Sn diffusion couples in the temperature range from 235 to 600 °C. Considering of the t 1/3 growth kinetics, Kim and Tu proposed a model which assumes that the scalloped grains coarsening is caused by a ripening process in which the driving force is the Gibbs–Thomson effect.Reference Kim, Tu and Totta10 On the other hand, a model based on diffusion through channels between each grain controlling mass transport also predicts the t 1/3 behavior.Reference Gur and Bamberger38 Recently, Ghosh reported n values for Sn–3.5Ag, Sn–Bi, and Sn–38Pb reacting with Ni in different temperature ranges. The n values are 4.55 at 230 °C and 4.69 at 260 °C for SnAg solders. Li et al.Reference Li, Mannan, Clode, Chen, Whalley, Liu and Hutt30 also reported the interfacial reactions of Ni and Ni(P) with liquid Sn–Bi solders. The n value is greater than 3 for the thickening kinetics of Ni3Sn4 scallops formed on both systems. In the present study, the diffusion-controlled process occurred in these interfaces might only have minor effect on the thickening process. Yet, diffusion through the channels between neighboring IMC grains may be the dominant diffusion paths for Ni.
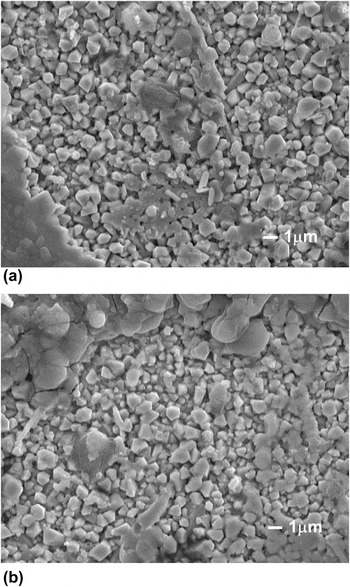
To investigate the radial growth to obtain further understanding regarding the thickening mechanism, EP-Ni samples were polished and etched from the top side to reveal the IMC morphology. A larger n value predicts that the reaction rate decrease rapidly with an increase of time. From our observation, the IMC shapes on EP-Ni side are similar after different reflow durations. However, the IMC on EL-Ni side showed different morphologies with reflow durations, which grew bigger and became layer type after more than 5 min. To figure out the mechanism, the change of IMC grain size with different reflow durations was investigated. The top-view SEM images of the IMCs after 5- and 10-min reflow are shown in Figs. 10(a) and 10(b), respectively. Rod-like Ni3Sn4 IMCs were observed. The diameter of the IMCs remained almost identical but yet the height measured from the cross-sectional images revealed that the heights of these rods increased with reflow time. These results suggested that the Ni atoms may diffuse through the liquid channels between neighboring IMC grains; once the channels become IMC as well, the Ni must diffuse through IMC to react with Sn atoms, which will take longer. Moreover, it is speculated that once the Ni atoms dissolve into the molten solder, they tend to diffuse to the top of the rods and then react with solder there. As the reflow time increases, the IMC grew thicker and thus diffusion paths for Ni become longer. By these two reasons, the n value is larger for the IMC growth on the EP-Ni side. In 2004, Ghosh first utilized the radial size distribution as a function of reaction time to analyze the radial growth kinetics of the Ni3Sn4. According to their results, diffusion through liquid channels and radial growth played an important role in thickening process of Ni3Sn4 formation.
Top-view SEM images of the interfacial Ni3Sn4 IMCs on the EP-Ni side (a) after 5-min reflow, (b) after 10-min reflow. The solder was etched selectively.

The growth activation energy of Ni3Sn4 can be calculated by the empirical law in Eq. (1). The activation energies are calculated to be 25 KJ/mol for EP-Ni interface and 38 KJ/mol for EL-Ni interface within 5 min. Compared with the 13–17 KJ/mol activation energies for the reaction between liquid Sn and bulk Ni,Reference Takaku, Liu, Ohnuma, Kainuma and Ishida34 the activation energy of EL-Ni has a larger value. In addition, Gur and BambergerReference Gur and Bamberger38 also reported that the activation energy for the diffusion of Ni in liquid Sn is 27.6 ± 1.7 kJ/mol in the temperature range of 235–600 °C. In the present study, the activation energy of the eutectic SnAg with Ni system is higher than that of the pure Sn reacting with Ni.
B. Kirkendall voids in the Ni-based UBM system during reaction
Kirkendall void formation in the solder/UBM reaction has been reported in other researches.Reference Zeng and Tu3, Reference Jeon, Paik, Bok, Choi and Cho39, Reference Chen and Chen40 The presence of voids was reported to be either inside Ni3Sn4 phaseReference Chen and Chen40, Reference Ho, Yang and Kao41 or inside Ni3P layer.Reference Zeng and Tu3 With the different observed location of voids, many conclude different explanations for the formation mechanisms. Our observation shows that voids located at the the Ni3Sn4/Ni3P interface and mostly inside the Ni3P layer. Therefore, it can be concluded that the presence of Ni3P layer between the IMC and the UBM is an essential condition for void formation.Reference Ho, Yang and Kao41 Because of liquid state reaction, Sn reacted with Ni and therefore enhanced the depletion rate of Ni from EL-Ni layer. Once Ni is diffused out, the crystallization of the P-enriched portion of the alloy was transformed into Ni3P.Reference Jang, Peter, Lee and Tu22 And as the crystalline Ni3P formed, it would increase the Ni depletion from the EL-Ni layer through grain boundaries. From Fig. 7, it is revealed clearly that Ni3P layer can be seen on EL-Ni UBM interface. Indeed, the Sn would diffuse through IMC,Reference Chen and Chen40 but the Sn flux can be ignored, compared with the out-diffused Ni flux. With an unbalanced diffusion fluxes, it leads to the accumulation of voids inside the Ni3P layer.
On the contrary, the absence of voids at the interface of the EP-Ni UBM system can be realized because the EP-Ni is denser. Our experiments obtained similar results as that of He et al.,Reference He, Lau, Qi and Chen23 which showed void-free interfaces of the sputtered pure Ni UBM system because of its dense structure.
V. CONCLUSIONS
Using flip-chip samples, the liquid state reaction between the SnAg and EP-Ni as well as EL-Ni has been studied at various reflow conditions. By fabricating the EP-Ni on the chip side and the EL-Ni on the substrate side, direct comparison on the growth of Ni3Sn4 can be achieved. The IMC growth rate on the EP-Ni UBM is much slower under all the reflow conditions, compared with that on EL-Ni layer. The obtained parameter n is greater than 3 for the thickening kinetics of Ni3Sn4 scallops on both EP-Ni and EL-Ni. This can be attributed to the thickening process, which is mainly affected by diffusion through liquid channels between each grains and the radial growth reported before. During the reaction, porous Ni3P layer along with microcracks formed between the IMC and the EL-Ni are observed. This porous layer may provide abundant diffusion paths for the Ni atoms to diffuse out; therefore, the IMC growth rate on the EL-Ni side is faster than that on the EP-Ni side. The activation energy for Ni3Sn4 growth in liquid state reaction is found to be 25 kJ/mol on EP-Ni UBM and is 38 kJ/mol on EL-Ni layer. On the other hand, the larger time exponent value, n, on the EP-Ni side here predicted a rapid decrease in reaction rate as an increase in reflow time. The EP-Ni UBM shows a superior performance than the EL-Ni layer.
ACKNOWLEDGMENT
The authors thank the National Science Council of Republic of China for the financial support through Grant No. 98-2221-E-009-MY3.