


Trees store a record of past events in their long-lasting woody structures. Stem age in a given crown position at a given time can be determined by counting the xylem growth rings, provided growth is seasonal. Physical distance from the top may serve as a proxy for time, the oldest part of the tree being located at ground level. These time records may be used for evaluating the typical lifespan and growth rates of an epiphyte such as a corticolous lichen thallus, which clearly cannot be older than the tree part it has colonized. This source of information on lichen life history seems to have been overlooked. In this communication we offer an example of its possibilities in a pilot study of age-determined bark.
On living trees, corticolous lichens need to acclimate to the growth of their substratum. A live bark surface is a much more dynamic substratum than dead trunks or processed wooden surfaces that lichens may also colonize. The bark is subject to tangential stretching because of stem thickening growth, and bark texture and chemistry change with age in a manner that is specific to the tree species. Furthermore, primary shoot growth means that the tree’s crown periphery expands with each annual growth cycle. An epiphyte, such as a corticolous lichen, settled on the stem or on a limb, will thus be influenced not only by the changing features of an expanding and aging bark but also by the year to year increase in distance to the outer foliage layer, making its microsite gradually more shaded and sheltered (Rasmussen & Rasmussen Reference Rasmussen and Rasmussen2018). Meanwhile, its physical distance from the ground is unaltered, so that an observer from below may tend to ignore the changes that take place. Ideally, this dynamic should be kept in mind when the distribution of corticolous lichens is under study.
Most studies on corticolous lichens only address the lowermost 2–3 m from the ground (e.g. Thor et al. Reference Thor, Johansson and Jönsson2010; Jüriado et al. Reference Jüriado, Liira, Csencsics, Widmer, Adolf, Kohv and Scheidegger2011; Asplund et al. Reference Asplund, Sandling, Kardol and Wardle2014), and thus only concern the oldest part of the tree. Studies that explore major parts of the tree crown, however, show that lichen biomass tends to be larger in the upper-mid crown (Clements & Shaw Reference Clements and Shaw1999) and the lichen diversity higher (Hale Reference Hale1952; Eversham et al. Reference Eversham, Johnson and Gustafson1987; Williams & Sillett Reference Williams and Sillett2007; Fritz Reference Fritz2009). A base-to-top analysis also reveals differential height distribution in different lichen species and lichen life forms (Kershaw Reference Kershaw1964; Harris Reference Harris1970; McCune et al. Reference McCune, Rosentreter, Ponzettis and Shaw2000; Campbell & Coxson Reference Campbell and Coxson2001; Marmor et al. Reference Marmor, Tōrra, Saag, Leppik and Randlane2013). Crown zonation is well established in the distribution of epiphytic plants generally (Zotz Reference Zotz2007, references therein), the likely regulating factors being physical gradients in light, temperature fluctuations and humidity, as well as biological gradients connected to bark development. These gradients are reasonably easy to predict if the crown develops with little interference from dominant neighbours, such as in solitary trees or even-aged stands where the distance from the tree’s own top and crown periphery is the deciding factor.
Within-tree gradients in environmental factors are usually parallel and interconnected, making it difficult to distinguish the decisive factor(s) for lichen occurrence. An even greater challenge, as explained above, is that the gradients change position with respect to a colonization site as the tree grows. Thus, supposing a site at a certain distance from the shoot tip offers the best conditions for spore attachment of a certain lichen species; thallus establishment will preferentially begin here but conditions at this colonization site will eventually change so that further recruitment becomes unlikely and the growth of the existing thallus inhibited. The rate at which this happens depends on the growth rate of the tree and defines the potential thallus lifespan being dependent of course on the individual tree or tree species. While old colonization sites are becoming unsuitable, however, new colonization sites will be made available as long as the tree is growing, enabling short-range dispersal, and thus the lichen population is likely to persist in the tree once established.
If there is no dispersal limitation, a bark surface will begin to be colonized when crown development and bark aging make it suitable for propagules of the lichen species in question, or soon after, depending on chance. This area is identifiable as the upper zonation limit for that lichen species. The lower zonation limit, on the other hand, coincides with the transition to unfavourable conditions, either in microclimate or bark characteristics. Other limiting factors within the bark habitat, such as browsing or competition, are also conceivable (e.g. Antoine & McCune Reference Antoine and McCune2004) but in most cases they are dependent on the gradients mentioned above.
Corticolous lichens evidently rely on the growth rates of the phorophyte: a long lifespan is possible if either the lichen species has a broad tolerance range enabling it to acclimate to the successional changes it is subjected to in the growing tree, or if these changes occur slowly in trees with a low growth rate, such as in very dry or cold climates. For example, in Alaska, thalli of Vulpicida pinastri growing on Alnus virida were reported to have c. 10% chance of survival beyond 20 years (Shriver et al. Reference Shriver, Cutler and Doak2012). Data for ferns and orchids suggest that a high growth rate in a phorophyte has a negative effect on epiphytic lifeforms (Hirata et al. Reference Hirata, Kamijo and Saito2009). Lichen thalli probably have a shorter lifespan in corticolous growing sites than individuals of the same species might obtain in more stable environments, such as a wall or a rock.
In this study, lichens on indigenous oak trees (Quercus robur L.; seed source Zevenaar, Holland, 1963) were compared with two non-indigenous conifer species Abies grandis (Dougl. ex D. Don) Lindl. (seed source: Comox, Vancouver Island, British Columbia, 1962) and Pseudotsuga menziesii (Mirbel) Franco (seed source: F 53a Wedellsborg Kongeskov, 1962), referred to by generic names hereafter. All were planted as 3 year-old seedlings in 1964–65 as common garden experiments at two localities, separated by c. 250 km in E-W direction. At Stenholt Vang (UTM zone 32N, 709370 E, 6206263 N) the soil is former farmland on a fine, loamy till classified as a Typic Hapludalf (Callesen Reference Callesen2003), where the precipitation and temperature averages are 424 mm/13·9 °C (growing season) and 773 mm/8·7 °C (annual). It receives c. 11·3 kg nitrogen ha−1 y−1 as bulk precipitation (Gundersen et al. Reference Gundersen, Sevel, Christiansen, Vesterdal, Hansen and Bastrup-Birk2009). Katborg Plantation (UTM 32N, 464584 E, 6238767 N) was established on heathland, the soil classified as a sandy Typic Haplorthod, where the precipitation and temperature averages are 452 mm/13·2 °C (growing season) and 975 mm/8·5 °C (annual); it receives c. 8·7 kg nitrogen ha−1 y−1. Each tree species was grown in a 50×50 m plot within each site and thinned at intervals of 8–10 y by stratified selection. While harvesting wood for biomass functions in 2012 (Nord-Larsen & Nielsen Reference Nord-Larsen and Nielsen2015), three specimens per species and site (i.e. 18 trees) were sampled and bark and lichens investigated. Stem discs were cut at 0·75 and 1·5 m above ground and then at equidistant levels up the main stem, the intervals varying between 1–3 m according to total tree height, short trees being sampled more intensively. Discs were dried at 105 °C for 48 h, bark stripped off and inspected for lichen thalli (as below). A total of 207 stem disks was analyzed for lichen presence and abundance. The main stem surface was inspected for lichens over an average area of 2·1% of the total trunk surface area (range 1·5–3·9 %) depending on the tree size and the height and diameter of the discs.
Lichen thalli were identified at ×10–50 magnification, using keys in Smith et al. (Reference Smith, Aptroot, Coppins, Fletcher, Gilbert, James and Wolseley2009) and reference collections at the Danish lichen herbarium (Natural History Museum of Denmark); nomenclature follows Smith et al. (Reference Smith, Aptroot, Coppins, Fletcher, Gilbert, James and Wolseley2009) and Arup & Sandler Berlin (Reference Arup and Sandler Berlin2011). A rough estimate of frequency was made for each lichen species: scarce (<10 % coverage), common (10–50 % coverage), abundant (>50 % coverage). The diameter of the largest thallus was estimated as: small (<5 mm), medium (5–10 mm) and large (>10 mm), on each tree disc. The dry bark has been kept as vouchers at the Section for Forest, Nature and Biomass (University of Copenhagen).
Bark samples were taken for measuring characteristics traditionally recognized as having an effect on lichen distribution, such as roughness, acidity and water holding capacity (Ellis Reference Ellis2012). Pieces complete from the cambial layer to the natural surface were prepared and adjusted to an approximate rectangular surface outline with a table saw (Proxxon DSH) and a sander (Hegner HSM300), obtaining samples ranging from c. 30×30 mm in surface area down to 7×7 mm at the treetops. Visible epiphyte colonization was avoided or removed. Surface area was measured twice, and thickness at eight standardised positions with a digital calliper. As an indicator of bark roughness, the standard deviation of thickness measurements was calculated. To measure bark pH an excised bark piece was floated in 0·03–0·05 ml water mm−2 surface area with the intact natural surface placed in the water (e.g. Kricke Reference Kricke2002). The demineralized water initially measured pH 5·66, and the pH change was recorded after 1 h. For water holding capacity, samples were soaked in demineralized water for 72 h (yielding 100–95% saturation, data not shown) and weighed (WW). Samples were dried at 105 °C for 24 h and weighed (DW). Water holding capacity was calculated as ((WW − DW)/WW) ×100.
Correlation of physical bark properties and age was analyzed by mixed effects modelling (MIXED procedure in SAS 9.4). To adjust for possible autocorrelation and to ensure correct variance estimates and subsequent statistical inference, we assumed an unstructured covariance of bark samples from the same stem. We analyzed the vertical distribution of lichens using the NPAR1WAY procedure in SAS 9.4. To allow for comparison of multiple groups (the three different tree species), we first analyzed the distributions using Kruskal-Wallis tests for the average location. Subsequently, pairwise comparisons of lichen distributions were made using a Kolmogorov-Smirnov test. Owing to the bivariate nature of the data, the effect of different physical bark properties on lichen colonization was analyzed using logistic modelling with a binomial distribution and logit link (GENMOD procedure in SAS 9.4).
The number of xylem growth rings of the individual discs was used as a proxy for bark age. Bark thickness and roughness data suggested that bark peeling was still insignificant in the lichen-colonized part of the stem so that the original surfaces were still in place, though divided by bark cracking. It was therefore possible to obtain the maximum time available for lichen colonization on each disc.
On the whole, we found rather few lichen taxa after 47 years of tree development (Table 1). We identified a total of 12 species belonging to 10 genera; several thalli were poorly developed and identifiable only to generic level. Both with respect to abundance and diversity of species, the lichen community on Quercus was richer than on the two conifer species. Approximately 85% (range 60–100%) of the Quercus stem discs were colonized compared to 23% (range 0-58%) for both of the conifer species. Among the Abies trees, samples from one tree were bare of lichens and two trees showed very sparse colonization (1–3 records per tree). In Pseudotsuga, one tree was recorded as uncolonized and four as sparsely colonized. On Quercus we observed an average of 5·2 lichen genera and 7·2 different species compared with 1·5 and 1·8 for Abies plus Pseudotsuga. The poor conifer lichen flora had only two doubtful unique members (Lecanora aff. horiza and L. cf. intumescens, both on Abies). Lecanora horiza is described as an obligate epiphyte on deciduous trees, making our observation on a conifer somewhat surprising, but it was based on small thalli.
The presence of lichens on bark of Quercus robur, Pseudotsuga menziesii and Abies grandis, recorded over the whole length of leader stems in 48 year-old trees, grown in two common gardens in Denmark. Number of records are given in brackets

Only 18% of our observations and 17% of lichen species occurred within the lowermost 2–3 m of the stems. The majority of the lichen taxa identified showed a predominantly middle or top position on the tree stems. Only species of Physcia and Lecanora were noted as “common” anywhere on the trees, and none as “abundant”. In spite of differing soils, nitrogen deposition and precipitation, the lichen species composition at the two sites was largely similar, although a small number of unique records occurred. This suggests a roughly similar propagule exposure at the two sites but also that there are differences among tree species in lichen establishment success since some of the conifer trees yielded few or no lichen records at all (see above).
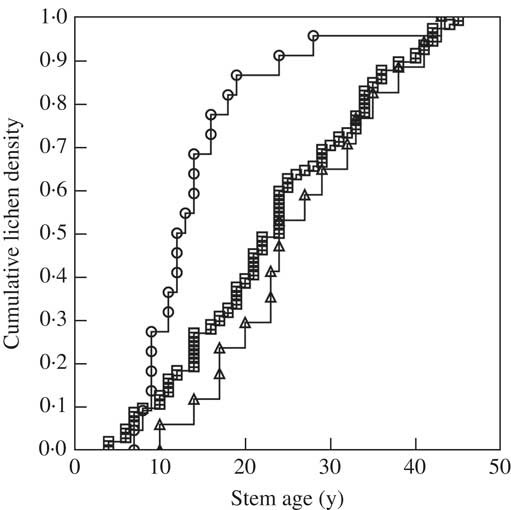
The vertical distribution of lichens (across all lichen species) differed among tree species (P<0·001). For both Quercus and Pseudotsuga it was close to even, while colonization in Abies was more pronounced in the upper c. 40% of the stem, corresponding to bark younger than 25 y (Fig. 1). When the same lichen species was compared across tree species, the colonization in Abies tended to be more elevated than in the other trees (Table 2). This could be an effect of low light availability caused by the dense evergreen crown of Abies.
Relationship between cumulative density of lichens (as a proportion of total records throughout the main stem) and stem age (as a proxy for bark age) (n=6) for three tree species. Key: circle=Abies grandis; triangle=Pseudotsuga menziesii; square=Quercus robur.
Vertical zonation of selected lichen species on Quercus robur, Pseudotsuga menziesii and Abies grandis in two common gardens in Denmark. Establishment position and longevity can be estimated (see text) but where records are few, these estimates should be treated with caution. A single outlier value is given in brackets. High=highest record, low=lowest record, both expressed as stem age (y)

Bark thickness averaged 4·6 mm (range 0·5–30·4 mm) and increased significantly with age (P<0·0001). Bark thickness in younger stems was similar among the species (P=0·06) but the rate of increase with stem age differed (P<0·0001), with the most marked basal thickening in Pseudotsuga. This, however, occurred at a bark age where few lichens were present. Bark surface roughness averaged 0·7 mm (range 0·1–3·9 mm), the amount differing between tree species (P=0·035). For all three tree species, it increased significantly (P<0·0001) with increasing stem age. The bark of Abies was conspicuously smooth, at thicknesses below 0·5 mm, except at the tree base. The bark of Quercus and Pseudotsuga was equally rough in the lichen-colonized parts, but roughness seemed to increase steadily along the Quercus stems from top to base, while increasing abruptly in Pseudotsuga at an age >35 y. All bark exuded acid compounds (we presume), the pH of water extracts ranging from 5·2 to 4·2, with no overall difference between species (P=0·192). A decline in pH with stem age was found in Abies and Quercus (P<0·0001) but was not significant in Pseudotsuga (P=0·067). Such young-to-old bark trends have been recorded before (Bates Reference Bates1992; Marmor et al. Reference Marmor, Tōrra and Randlane2010; Rambo Reference Rambo2010). Data and graphs are provided in the Supplementary Material (available online).
Maximum water content of the bark samples differed markedly with age among tree species (Fig. 2), with a steep decrease in Abies and Pseudotsuga and almost stable values up the stem in Quercus. Thus, water content in Quercus differed significantly from conifer bark (both species), both at the treetops and in the old stem bark (P<0·0001).
Relationship between stem age (as a proxy for bark age) and bark water content (% of wet weight) after soaking in water for 72 h. Data were collected from two growing sites and three tree species. Note that the greatest stem age was measured at the base of the trees. Locally weighted regression lines are shown ±95% confidence limits (n=6). Key: circles and continuous line=Abies grandis; triangles and long dashes=Pseudotsuga menziesii; squares and variable dashes=Quercus robur.

When our fixed effects (in the link function) included tree species and relative sample height (sampling height relative to total tree height), none of the physical bark properties (bark thickness, bark surface roughness, bark pH or bark maximum water content) provided an additional explanation for the overall lichen colonization (P>0·05). Thus, the physical bark features could not offer a unique explanation, either for the preferred lichen colonization on Quercus compared to the conifers or for their distribution up the trunks. The only notable feature in Quercus bark was that water relations remained roughly equivalent along the stem conferring stability during tree growth. This might make Quercus a favourable host by offering lichens the potential for greater longevity through the persistence of a suitable microhabitat. However, in the upper half of the conifer stems, poor lichen colonization cannot be attributed to dry bark conditions.
As many confounding factors are eliminated in the common-garden material, we were able to outline approximate maximum thallus lifespan for selected lichen species. Originating from an even-aged plantation in a homogeneous environment, the canopies of the trees developed concurrently and exposure at a given distance from the treetops is expected to be relatively stable over time. Thinning management kept the common-garden stands within a limited range of density. A generally low density of lichen thalli suggests that interspecific competition was not a likely explanation for the absence of certain species. Indications of zonation were observable in lichen species occurring with high to moderate frequency in the study material (Table 2).
Lifespan studies in lichens have mainly concerned epilithic species (Armstrong Reference Armstrong2015), while data for corticolous species are available from only a limited number of studies (Phillips Reference Phillips1969; Snelgar & Green Reference Snelgar and Green1982). In our material, Lepraria incana (incl. Lepraria sp.) showed a predominance on old bark (generally >20 y) and extended all the way to the tree base. Given a tree age of c. 50 y, thalli at the base might thus have been growing there for c. 30 y. The prediction is that young thalli of L. incana should occur predominantly with c. 20 y of crown development above them, that propagules landing above that height should have difficulty in attaching or growing, and that the oldest thalli should be found at the tree bases (mixed with younger ones). Provided that borders between thalli are distinguishable, the maximum thallus size could in principle be measured anywhere along the distribution zone, and compared to the age of the corresponding bark substratum. In this way it would be possible to obtain an estimate of growth rate during the time that had elapsed since the bark was 20 y.
Height/age occurrence of L. incana differed significantly (P<0·0001) from that of the other lichen taxa and tended to be found on more mature bark (Fig. 3). This species has previously been noted for its tolerance of coniferous bark (Picea abies, Saag Reference Saag2007) and for a positive bias towards Quercus, its incidence being correlated with depth of bark crevices (Mežaka et al. Reference Mežaka, Brǖmelis, Piterans and Printzen2012). In our material, however, it also occurred on the very smooth bark of Abies. The versatility of L. incana was noted in a study by Motiejünaitė et al. (Reference Motiejűnaitė, Iršenaitė, Adamonytė, Dagys, Taraškevičius, Matulevičiutė and Koreivienė2014) where the leprose lifeform was judged to be well adapted to rugose bark and cork accumulation, as seen in the old stem parts of Pseudotsuga and Quercus.
Relationship between stem age (as a proxy for bark age) and cumulative lichen density (as a proportion of total records throughout main stem). Data were collected from two growing sites and three tree species (Abies grandis, Pseudotsuga menziesii and Quercus robur, n=6). Lecanora (open circle)=several species of Lecanora; Lepraria (triangle)=L. incana plus an unidentified Lepraria sp.; Parmelia (square)=Parmelia saxatilis and unidentified Parmelia; Physcia (closed circle)=Physcia tenella and an unidentified Physcia sp.

The genus Physcia (P. tenella and Physcia sp.) colonized oak bark as young as 3 years old and occurred on bark aged 34 y, which probably means that a maximum lifespan for a thallus was about three decades on these trees. We suggest that the bark of the tree bases (>34 y) was too shaded or too aged for the persistence of Physcia. Light requirements might also be reflected in its entire absence from the evergreen conifer trees nearby.
Species of Lecanora seemed to differ from each other in distribution (Table 2). Our data show that L. chlarotera is able to colonize bark as young as 4 years old, and suggest that thalli may survive no longer than 2–3 decades. Absence of the species on the oldest bark could be due to low tolerance of bark rugosity. Crown development is also a potential reason for disappearance, either depriving the thalli of sufficient light or increasing the humidity beyond tolerances. In support of this hypothesis, L. chlarotera is described as an early colonizer (Edwards et al. Reference Edwards, Aptroot, Hawksworth and James2009). In contrast, L. expallens was recorded on more mature bark, consistent with its known distribution on stumps and decaying wood (Edwards et al. Reference Edwards, Aptroot, Hawksworth and James2009), and its near-absence from the upper third of a 10 m tall Pinus (silvestris?, Kershaw Reference Kershaw1964).
This study emphasizes that physical bark features are not adequately represented by inspecting the lowermost 2–3 m of trees, just as corticolous lichen communities are not. Growth dynamics and gradients within the trees have to be considered if inferences are to be meaningful. The location in which a lichen thallus is observed today will have changed its characteristics since the propagule first settled and began to develop, possibly to a considerable extent. The data suggest that age-determined bark can yield information about maximum potential thallus lifespan, sites of colonization and mortality of thalli, upon which hypotheses about the requirements of individual lichen species can be formulated. Such hypotheses should preferably be tested by experimental approaches rather than by correlative studies where the co-variation of many factors, both in respect of bark development and microenvironment, tends to confound the results.
The study was supported by the Foundation of 15th of June, ref # 2015-A-44. Thanks are due to Anders Nordin, Uppsala University, who helped verify some lichen identifications. The Section for Landscape Architecture and Planning kindly allowed us to use their wood workshop machinery.
Supplementary material
For supplementary material accompanying this paper visit https://doi.org/10.1017/S0024282918000440



