





1. Introduction
The electro-osmotic effect brings in precise control over the underlying flow of small liquid volumes in various miniaturized applications, including lab-on-a-chip devices, microfluidic sensors, bioanalytical systems, microbiological sensors, microelectro-mechanical systems, and many more (Lyklema Reference Lyklema1995; Long, Stone & Ajdari Reference Long, Stone and Ajdari1999; Ghosal Reference Ghosal2002; Bahga, Vinogradova & Bazant Reference Bahga, Vinogradova and Bazant2010; Nam et al. Reference Nam, Cho, Heo, Lim, Bazant, Moon, Sung and Kim2015). It may be mentioned here that the electro-osmotic effect facilitates the flow control, requiring a lesser energy budget, while realizing this actuation parameter in practice does not involve the cumbersome system to be integrated with the small-scale fluidic circuit/device (Brask, Goranovic & Bruus Reference Brask, Goranovic and Bruus2003; Brask et al. Reference Brask, Goranović, Jensen and Bruus2005). Kemery, Steehler & Bohn (Reference Kemery, Steehler and Bohn1998) have conducted extensive research efforts to investigate several facets of electro-osmotic flow in different microfluidic configurations, encompassing diverse physical and geometric conditions. To this end, a number of experiments have also been conducted by leveraging electro-osmotic effects in centrifugal microfluidic systems, typically in the multiple enzymatic assays (Duffy et al. Reference Duffy, Gillis, Lin, Sheppard and Kellogg1999).
It is worth mentioning here that pertaining to rotational flows in lab-on-a-chip-based centrifugal microfluidic systems/devices, used largely in medical diagnostics, biochemical analysis and laboratory instruments cooling, the deployment of electro-osmotic effect offers a few distinctive features, namely noise-free operation, minimally invasive actuation process, and a greater degree of flow controllability, to name a few (Ajdari Reference Ajdari1995, Reference Ajdari1996; Chakraborty Reference Chakraborty2006; Mondal et al. Reference Mondal, Ghosh, Bandopadhyay, DasGupta and Chakraborty2013; Barimani, Jamei & Abbasi Reference Barimani, Jamei and Abbasi2022). Despite having such inevitable beneficial aspects of the electro-osmotic effect, employment of this flow actuation parameter in rotational platforms leads to a few problematic facets, including a stability issue of the underlying flow (Zhang et al. Reference Zhang, Lashgari, Zaki and Brandt2013). Probing into the stability threshold of rotational flows in the presence of electrokinetic actuation seems to be of vital importance, attributed primarily to many implications of this characteristic feature on the prevailing transport (Chang & Wang Reference Chang and Wang2011). As witnessed in the reported observations by Posner & Santiago (Reference Posner and Santiago2006), the onset of instability in rotational force-modulated microscale flows under electrokinetic influences promotes solute mixing quite promisingly. Nevertheless, in electro-osmotic flow, the transition to instability in many cases severely disturbs the underlying transport in the rotating platform, and at times becomes vulnerable for the efficient operation of rotational fluidic systems typically used in biochemical/biomedical applications (Song et al. Reference Song, Yu, Zhou, Antao, Prabhakaran and Xuan2017; Sengupta et al. Reference Sengupta, Ghosh, Saha and Chakraborty2019). It may be mentioned here that a few studies are reported in the literature wherein the influence of the electro-osmotic effect on the stability picture of non-rotating microscale flows has been discussed aptly (Suresh & Homsy Reference Suresh and Homsy2004; Ray et al. Reference Ray, Reddy, Bandyopadhyay, Joo, Sharma, Qian and Biswas2012).
A substantial application of electrokinetically assisted rotational flow in different state-of-the-art systems, together with the basic interest of unravelling the intricate behaviour of the electro-osmotic effect in triggering instability of rotational flows, indeed, demands a comprehensive stability analysis of rotating electro-osmotic flows. For rotating systems, in addition to the forcing due to the centrifugal effect, the Coriolis force alters the flow velocity, and consequently the fluid flux, considerably (Kaushik et al. Reference Kaushik, Mondal, Kundu and Wongwises2019; Siva et al. Reference Siva, Kumbhakar, Jangili and Mondal2020). Specifically, rotation-induced forcing, i.e. centrifugal force and the Coriolis force, plays a significant role in shaping the flow dynamics (Kaushik, Mondal & Chakraborty Reference Kaushik, Mondal and Chakraborty2017b; Gandharv & Kaushik Reference Gandharv and Kaushik2022). The underlying effect, influenced by the electrical double layer phenomenon, affects the flow dynamics non-trivially, including the onset of flow instability through the formation of vortices (Abhimanyu et al. Reference Abhimanyu, Kaushik, Mondal and Chakraborty2016). Considering all the aspects above, stability analysis of rotating electro-osmotic flow could be an interesting yet practical proposition, which remains unexplored in the literature until the present work.
Here, we consider the effect of channel rotation on the stability analysis of electro-osmotic flow under the influence of electrical forcing that stems from the electrical double layer effect. Our analysis pertains to the framework of the Debye–Hückel approximation, while the validity of this approximation is justified by invoking the relation between surface charge density ( $\sigma$) and the zeta potential (
 $\zeta$) (Ganchenko et al. Reference Ganchenko, Demekhin, Mayur and Amiroudine2015). We consider a dilute aqueous solution of symmetric electrolyte in order to neglect the Joule heating effect from the underlying stability analysis of this work (Mayur, Amiroudine & Lasseux Reference Mayur, Amiroudine and Lasseux2012). We perform the stability analysis for the flow over a single plate (unbounded domain) and the flow bounded by two parallel plates using the Galerkin approximation (Reza & Gupta Reference Reza and Gupta2012). Quite notably, for the first time, we establish as well as use the modified Routh–Hurwitz criteria (Anagnost & Desoer Reference Anagnost and Desoer1991) to investigate the transition of the flow from stability to instability modes. We mention briefly here that the Routh–Hurwitz criteria serve as a mathematical test to determine the signs of the real parts of the zeros of a polynomial. In § 3.2.2 of this paper, this criterion is utilized to verify analytically the stability of the flow for a specific range of electrokinetic parameter
 $K$ and rotation number
 $\omega$. By employing the Routh–Hurwitz criteria, a thorough assessment of the flow stability is achieved, validating the numerical results with analytically verified solutions.
2. Mathematical model and flow configuration
We consider the electro-osmotic flow of an incompressible viscous fluid under the influence of rotation-induced forces through two different configurations, depicted in figure 1. We consider the Cartesian coordinates  $(x', y', z')$ to represent the flow configurations, as shown schematically in figure 1. The velocity field
 $\boldsymbol {u}'= (u',v')$ is taken along the
 $x'$–
 $y'$ plane. We assume that the entire system rotates along the
 $z'$-axis with angular velocity
 $\boldsymbol {\varOmega }=(0,0,\varOmega )$. The external electric field, which is applied along the
 $x'$-direction, together with the rotational forcing, drives the flow in the positive
 $x'$-axis. For both configurations, we consider height along the
 $z'$-axis, width along the
 $y'$-axis, and the length spans the
 $x'$-axis.
Schematic diagram depicting the geometry of the electro-osmotic flow (a) over a flat infinite plate and (b) in a region bounded by two parallel plates. The external electric field  $\boldsymbol {E}$ is being applied along the
 $x'$-direction. The entire system is being rotated about the vertical axis, i.e. the
 $z'$-axis.

The transport equations governing the electro-osmotic flow dynamics are the Poisson–Boltzmann equation for the potential distribution and the Navier–Stokes system of equations for the flow field.
Let  $\varPsi$ be the potential distribution due to the electrical double layer (EDL). The EDL potential is governed by the Poisson–Boltzmann equation (Gouy Reference Gouy1910; Chapman Reference Chapman1913; Probstein Reference Probstein2005)
 \begin{equation} \frac{{\rm d}^{2}\varPsi}{{\rm d}z^{\prime 2}}=\frac{-\rho_e}{\epsilon}, \end{equation}
where  $\epsilon$ is the electrical permittivity of the electrolyte solution under consideration, and
 $\rho _e$ is the net charge density. Note that
 $\rho _e=2C_0ez\sinh ({ez\varPsi }/{K_B T})$, where
 $e$ is the fundamental electric charge,
 $C_0$ is the concentration of the bulk electrolyte,
 $z$ is the valency of ions,
 $K_B$ represents Boltzmann's constant, and
 $T$ is the absolute temperature. Substituting the expression for
 $\rho _e$ in (2.1), we obtain the equation for EDL potential as
 \begin{equation} \frac{{\rm d}^2\varPsi}{{\rm d}z^{\prime 2}}=2zeC_0\sinh\left(\frac{ze\varPsi}{K_B T}\right). \end{equation}
For  $ze\varPsi /K_B T \ll 1$, one may write
 $\sinh ({ze\varPsi }/{K_B T})\approx {ze\varPsi }/{K_B T}$, and this approximation is known as the Debye–Hückel approximation. Considering the surface charge density for glass (
 $\sigma =10^{-3}\ {\rm C}\ {\rm m}^{-2}$), the Gouy–Chapman relation between surface charge density and zeta potential is given by the relation
 $\sigma ={2\sqrt {2}\,\varepsilon \hat {\varPhi }}/{ k^{-1}} \sinh ({\zeta }/{2\hat {\varPhi }})$ (Ganchenko et al. Reference Ganchenko, Demekhin, Mayur and Amiroudine2015; Demekhin et al. Reference Demekhin, Ganchenko, Navarkar and Amiroudine2016). The calculation of
 $\zeta$ from the above relation for
 $\kappa ^{-1}=200\ {\rm nm}$ and
 $\hat {\varPhi }=25\ {\rm mV}$ gives the value
 $\zeta =0.012\ {\rm mV}\ (\ll 25\ {\rm mV})$. As is evident, the calculated value of
 $\zeta$ is considerably less than the threshold value of the zeta potential. This order analysis underscores the applicability of the Debye–Hückel approximation pertaining to the present analysis (Masliyah & Bhattacharjee Reference Masliyah and Bhattacharjee2006).
By appealing to the Debye–Hückel approximation, we have the following equation that describes the potential, derived from (2.2):
 \begin{equation} \frac{{\rm d}^2\varPsi}{{\rm d}z^{\prime 2}}=\kappa^2 \varPsi, \end{equation}
where  $\kappa$ denotes the inverse Debye length, defined by
 $\kappa =\sqrt {{2z^2e^2C_0}/{\epsilon K_B T}}$. Equation (2.3) can be solved subject to the boundary conditions
 \begin{equation} \varPsi=\zeta \ {\rm at} \ z^{\prime }=0 \quad {\rm and} \quad \varPsi\rightarrow0 \ {\rm as}\ z^{\prime}\rightarrow\infty, \end{equation}
where  $\zeta$ is the zeta potential at the solid surface.
The Navier–Stokes equations and the equation of continuity for an incompressible fluid flow are written as
 $$\begin{gather} \rho\left(\frac{\partial \boldsymbol{u}'}{\partial t'}+\boldsymbol{ u'} \boldsymbol{\cdot}\boldsymbol{\nabla} \boldsymbol{u}'+2\boldsymbol{\varOmega} \times \boldsymbol{u}'\right)= \boldsymbol{f} - \boldsymbol{\nabla} P + \mu\, \nabla^{2}\boldsymbol{u}', \end{gather}$$
 $$\begin{gather}\boldsymbol{\nabla}\boldsymbol{\cdot}\boldsymbol{u}'=0, \end{gather}$$
where  $\rho$ is the fluid density,
 $\mu$ is the dynamic viscosity,
 $\boldsymbol {u}'$ is the velocity vector,
 $\boldsymbol {f}$ is the body force, and
 $P=p-{\rho }/{2}|\boldsymbol {\varOmega } \times \boldsymbol {r}'|^{2}$, with
 $\boldsymbol {r}'= (x',y',z')$ the modified pressure (Zheng & Jian Reference Zheng and Jian2018). We assume that no pressure gradient exists other than the centrifugal force. The body force for the flow is given by
 \begin{equation} \boldsymbol{f}=(-\rho_{e}E,0,0), \quad {\rm with} \ \rho_{e}={-}\epsilon\, \frac{{\rm d}^{2}\varPsi}{{\rm d}z'^2}, \end{equation}
where  $\rho _e$ is the charge density of the electrolyte solution, and
 $E$ is the constant electric field being applied along the
 $x'$-direction. For an infinite plate, one may consider solutions in the form
 $u'=u'(z',t')$ and
 $v'=v'(z',t')$. In this analysis, we investigate the stability analysis of purely electro-osmotic flow, and we do not consider any applied pressure gradients in the chosen configuration. However, the prevailing centrifugal forcing owing to the channel rotation develops a pressure gradient in the flow field, and this has been considered in the modified pressure gradient term that acts along the axial (
 $x'$) direction. The axial pressure gradient, which is assumed to be almost constant across a long microchannel, has also been ignored, considering its minuscule effect in comparison to the electrical forcing. We have considered the width of the channel to be large (pseudo-two-dimensional analysis – here, we did not consider the confinement effect), and the Coriolis force modulated induced pressure gradient along the
 $y'$-axis is trivially small. As such, it is because of this small induced pressure gradient along the
 $y'$-axis that we did not consider induced pressure gradient along the
 $z'$-axis as well. Accounting for these assumptions, which have been considered in seminal works of this paradigm (Kaushik, Mandal & Chakraborty Reference Kaushik, Mandal and Chakraborty2017a; Kaushik et al. Reference Kaushik, Mondal, Kundu and Wongwises2019), we did not consider induced pressure gradients along the
 $y'$- and
 $z'$-directions of this analysis. Consequently, the solution for the velocity components
 $u'$ and
 $v'$ (induced due to the Coriolis force) in the long microchannel has been sought to be dependent on
 $z'$ and
 $t'$. Consistent with the assumptions made in this analysis, and by neglecting the convective and pressure gradient terms, the componentwise momentum transport equations obtained from (2.5) read as
 $$\begin{gather} \rho\,\frac{\partial u'}{\partial t'}-2\rho\varOmega v' =\epsilon E\,\frac{{\rm d}^{2}\varPsi}{{\rm d}z^{'2}}+\mu\,\frac{{\rm d}^{2}u'}{{\rm d}z^{'2}} , \end{gather}$$
 $$\begin{gather}\rho\,\frac{\partial v'}{\partial t'}+2\rho\varOmega u' =\mu\,\frac{{\rm d}^{2}v'}{{\rm d}z^{'2}}, \end{gather}$$
with the boundary conditions given as
 \begin{equation} \boldsymbol{u^{\prime}}=0 \quad {\rm at} \ z^{\prime}=0\ \mbox{and}\ z^{\prime}\rightarrow \infty. \end{equation}
It is worth mentioning here that upon neglecting the electrical body force in the momentum transport equation, the effect that arises due to the formation of the EDL phenomenon can be taken into account through the employment of the Helmholtz–Smoluchowski slip velocity at the wall. Such a consideration is valid only in the limit of thin EDL cases (Bahga et al. Reference Bahga, Vinogradova and Bazant2010). Our study employs a generic approach, i.e. incorporation of the electrical body force in the transport equation (2.8), suitable for both thin and thick EDL scenarios. We justify this approach by noting that surface hydrophobicity boosts electro-osmotic flow, typically modelled through the implementation of a Navier-slip boundary condition at the fluid–solid interface. Past research has shown that uncharged hydrophobic patches on channel walls can intensify electro-osmotic flow velocity, emphasizing the role of the Navier-slip condition in enhancing flow velocity (Bahga et al. Reference Bahga, Vinogradova and Bazant2010; Zhao Reference Zhao2010; Belyaev & Vinogradova Reference Belyaev and Vinogradova2011; Dehe et al. Reference Dehe, Rofman, Bercovici and Hardt2020). Also, it is evident from the literature that surface charge significantly reduces the hydrophobicity on that particular portion of the wall due to the mobile ions (Ajdari & Bocquet Reference Ajdari and Bocquet2006; Maduar et al. Reference Maduar, Belyaev, Lobaskin and Vinogradova2015; Xie et al. Reference Xie, Fu, Niehaus and Joly2020). In this analysis, we consider a uniformly charged wall, and the maximum value of slip length on such a uniformly charged wall would be approximately  $40\ {\rm nm}$ (Xie et al. Reference Xie, Fu, Niehaus and Joly2020), leading to an overall enhancement of electro-osmotic flow velocity by a factor (
 $1+40\kappa$), where
 $\kappa$ is the inverse of the EDL thickness in nm. Pertaining to this analysis,
 $\kappa ^{-1}$ or
 $\lambda _D = 200\ {\rm nm}$, hence the slip-modulated velocity enhancement factor becomes
 $1.2$. Accounting for this trivial enhancement factor of electro-osmotic flow velocity, we did not consider slip velocity on the surface in the underlying analysis.
3. Analysis of rotating electro-osmotic flow
3.1. Flow dynamics and stability in an unbounded domain
3.1.1. Dimensionless equations
We make an effort to cast (2.3), (2.5) and (2.6) into their dimensionless counterparts. Normalizing lengths by  $1/\kappa$,
 $\varPsi$ by
 $\zeta$, the velocity components by
 $\epsilon E\zeta /\mu$, and time by
 $\rho /\mu \kappa ^{2}$, we obtain the dimensionless forms of (2.3), (2.8) and (2.9) as
 $$\begin{gather} \frac{\partial^{2}\psi}{\partial z^2}=\psi, \end{gather}$$
 $$\begin{gather}\frac{\partial^{2}u}{\partial z^2}-\frac{\partial u}{\partial t}+2\,\frac{Re}{Ro}\,v ={-}\frac{\partial^{2}\psi}{\partial z^2}, \end{gather}$$
 $$\begin{gather}\frac{\partial^{2}v}{\partial z^2}-\frac{\partial v}{\partial t}-2\,\frac{Re}{Ro}\,u =0. \end{gather}$$
The dimensionless numbers appearing in (3.2) and (3.3) are  $Re={U_0\rho }/{\kappa \mu }$, the Reynolds number, and
 $Ro= {U_0\kappa }/{\varOmega }$, known as the Rossby number (Aurnou, Horn & Julien Reference Aurnou, Horn and Julien2020). The term
 $U_0$ appearing in the definitions of
 $Re$ and
 $Ro$ is called the Helmholtz–Smoluchowski velocity.
Using the boundary conditions  $\psi (0)=1$ and
 $\psi (\infty )=0$ for the dimensionless EDL potential
 $\psi$, the solution to (3.1) has the form
 \begin{equation} \psi={\rm e}^{{-}z}. \end{equation}
The following boundary conditions govern the flow field:
 \begin{equation} \boldsymbol{u}=\boldsymbol{0}\ \mbox{at } z=0\quad \mbox{and}\quad \boldsymbol{u}\rightarrow \boldsymbol{0}\ \mbox{when}\ z\rightarrow \infty. \end{equation}
3.1.2. Linear stability analysis
We consider the solutions of (3.2) and (3.3) in the form (Chandrasekhar Reference Chandrasekhar2013)
 \begin{equation} \begin{bmatrix} u(z,t)\\ v(z,t)\\ \psi(z,t)\\ \end{bmatrix} = \begin{bmatrix} \hat{u}(z) \\ \hat{v}(z) \\ \hat{\psi}(z) \end{bmatrix} \exp({{\rm i}\alpha z-\beta t}), \end{equation}
where  $\hat {u}$,
 $\hat {v}$ and
 $\hat {\psi }$ respectively denote the amplitudes of velocities and dimensionless EDL potential. Here,
 $\alpha$ is the wavenumber along the
 $z$-direction, and
 $\beta$ is the complex growth rate. Henceforth, the ‘hat’
 $(~\hat {}~)$ symbol has been omitted from the dimensionless variables for ease of presentation.
On substituting (3.6) into (3.2) and (3.3), we obtain the equations
 $$\begin{gather} \psi^{\prime\prime}+2{\rm i}\alpha\psi^{\prime}-(\alpha^2+1)\psi=0, \end{gather}$$
 $$\begin{gather}u^{\prime\prime}+2{\rm i}\alpha u^{\prime}+(\beta-\alpha^{2})u+ 2\omega v+\psi=0, \end{gather}$$
 $$\begin{gather}v^{\prime\prime}+2{\rm i}\alpha v^{\prime}+(\beta-\alpha^2)v-2\omega u=0. \end{gather}$$
Here, the prime  $(')$ represents the derivative with respect to
 $z$. We denote
 $\omega =\eta ^{2}= {\varOmega \rho }/{\kappa ^2 \mu }={Re}/{Ro}$, where the parameter
 $\eta$ is defined as the measure of the thickness of EDL relative to the depth of the Ekman layer. Precisely, we have
 $\eta = \lambda _{D}/L_k$, where
 $\lambda _D$ is the Debye length, and
 $L_{k}\ (=(\mu /\rho \varOmega )^{{1}/{2}})$ is defined as the Ekman depth (Chang & Wang Reference Chang and Wang2011).
Let us take  $\chi (z)= \hat {u}(z)+{\rm i}\,\hat {v}(z)$, where
 $\chi$ is defined as the complex velocity function. By using this complex velocity function
 $\chi$ in (3.8) and (3.9), we get the equation
 \begin{equation} \chi^{\prime\prime}+2{\rm i}\alpha\chi^{\prime}+m^2\chi=0, \end{equation}
where  $m^2= \beta -\alpha ^2-2{\rm i}\omega$.
The boundary conditions used for solving (3.10) are
 \begin{equation} \chi(0)=0\quad \mbox{and}\quad \chi(\infty)=0, \end{equation}
and
 \begin{equation} \psi(0)=1\quad \mbox{and}\quad \psi(\infty)=0. \end{equation}
Now the solution of (3.10) subject to the boundary conditions described in (3.11a,b) is obtained as
 \begin{equation} \chi=\frac{1}{1-p+m^{2}}\left(\exp\left({-z/2\left(p+\sqrt{-4m^2+p^2}\right)}\right)-\exp({-z})\right). \end{equation}
3.1.3. Generalized flow analysis
In order to investigate the general flow analysis, we first resolve  $\chi$ into its real and imaginary parts:
 \begin{equation} \hat{u}={\rm Re}(\chi)= \frac{{\rm e}^{{-}az}\,(\cos(bz)\,(1+\beta-\alpha^2)+2(\alpha+\omega) \sin(bz))-{\rm e}^{{-}z}\,(1+\beta-\alpha^2)}{(1+\beta-\alpha^2)^{2}+4(\alpha+\omega)^{2}} \end{equation}
and
 \begin{equation} \hat{v}={\rm Im}(\chi)=\frac{{\rm e}^{{-}az}\,(2(\alpha+\omega) \cos(bz)-(1+\beta-\alpha^2)\sin(bz))-2(\alpha+\omega)\, {\rm e}^{{-}z}}{(1+\beta-\alpha)^{2}+4(\omega+\alpha)^2}. \end{equation}
In this context,  $\hat {u}$ is called the axial electro-osmotic velocity in the axial direction of the applied external electric field, while
 $\hat {v}$ is the electro-osmotic flow velocity in the transverse direction. The quantities
 $a$ and
 $b$ in (3.14) and (3.15) are defined in the form
 \begin{equation} a= \sqrt{\frac{\beta-\alpha^2+|m^2|}{2}}\quad {\rm and}\quad b=\sqrt{\frac{-(\beta-\alpha^2)+|m^2|}{2}}. \end{equation}
For  $\alpha =0$ and
 $\beta =0$, the Ekman spiral curve coincides with the reported results (Chang & Wang Reference Chang and Wang2011). However, the generalized flow analysis for the case
 $\beta \neq 0$ is our aim in this work.
3.1.4. Analysis of the Ekman spiral flow by Galerkin approximation
We consider two cases.
Case A: consider  $\alpha =0$ and
 $\beta =0$.
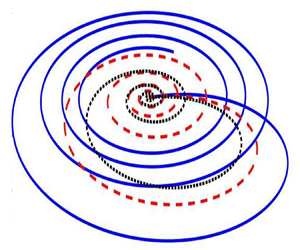
It is known that an Ekman spiral refers to wind or current structures that are developed near a horizontal boundary. As one moves away from the boundary region, the direction of the flow deviates from the external forcing and rotates gradually. Generally, the transport of volume associated with the Ekman spiral occurs in the right-hand direction towards the northern hemisphere. However, in the case of electro-osmotic flow, the Ekman spirals exhibit different characteristics. The direction of the volume transportation of electro-osmotic flow is essentially dependent on  $\omega$ as depicted in figure 2. The Ekman spirals obtained in this scenario are observed as closed curves, and as the value of
 $\omega$ increases, the area enclosed by the curves tends to decrease. Notably, each closed curve originates from the origin (
 $z=0$). As
 $z$ increases, the
 $u$-component swirls along the positive
 $x$-axis, while the component
 $v$ swirls along the negative
 $y$-axis. When
 $u$ reaches its maximum value, the spiral changes direction until the
 $-v$ velocity reaches its maximum. Following this, the magnitudes of both
 $u$ and
 $v$ begin to decrease, eventually spiraling back towards the origin as witnessed in figure 2.
When considering a single plate, the Ekman spirals exhibit different closed spirals in the steady state corresponding to different values of  $\omega$. Regardless of the value of
 $\omega$, closed spirals are obtained consistently. However, as the value of
 $\omega$ increases, the area enclosed by these spirals gradually shrinks in size.

We rewrite (3.7) and (3.10) as
 \begin{equation} \psi^{\prime\prime}+p\psi^{\prime}-q\psi=0 \end{equation}
and
 \begin{equation} \chi^{\prime\prime}+p\chi^{\prime}+m^{2}\chi+\psi=0, \end{equation}
where  $q=\alpha ^2+1$. Equations (3.17) and (3.18) along with the boundary conditions (3.11a,b) and (3.12a,b) are solved using Galerkin approximation. We approximate the functions
 $\chi (z)$ and
 $\psi (z)$ by a finite series that can be obtained from a complete continuous set of linearly independent functions
 $\chi _n(z)$ and
 $\psi _n(z)$. The functions are approximated in such a way that they satisfy the boundary conditions. We take the following approximations for
 $\chi$ and
 $\psi$:
 \begin{equation} \left.\begin{gathered} \chi(z)=\sum_{n=1}^{N} a_n\,\chi_n(z), \\ \psi(z)=\sum_{n=1}^{N} b_n\,\psi_n(z), \end{gathered}\right\} \end{equation}
where  $a_n$ and
 $b_n$ are constants. For the sake of mathematical simplicity, we consider
 $n=2$ and the following basis functions for
 $\chi _n(z)$ and
 $\psi _n(z)$:
 \begin{equation} \chi_1(z)=z\,{\rm e}^{{-}z}, \quad \chi_2(z)=z^2\,{\rm e}^{{-}z}, \end{equation}
and
 \begin{equation} \psi_1(z)={\rm e}^{{-}z}, \quad \psi_2(z)={\rm e}^{{-}2z}. \end{equation}
The relevant equations (3.20a,b) and (3.21a,b) are substituted in (3.17) and (3.18). The residuals are obtained in each case. The sets of coefficients  $a_n$ and
 $b_n$ are determined using the fact that each residual is orthogonal to the set of trial functions over the selected domain. The integral formulation can be written as
 \begin{equation} \int_{0}^{\infty}\chi_n (z)\,R_1 \,{\rm d}z=0 \quad \mbox{and} \quad \int_{0}^{\infty}\psi_n(z)\,R_2 \,{\rm d}z=0 \quad (n=1,2), \end{equation}
where  $R_1$ and
 $R_2$ are the respective residues. Equations (3.22a,b) lead to a homogeneous system of linear equations with four unknowns. The necessary condition for the existence of a non-trivial solution gives rise to the approximated equation
 \begin{align} &0.0016(1.6+m^4+1.32\alpha^2-5.33\beta+5.33\alpha^2+10.66{\rm i}\omega +4{\rm i}\alpha\beta-4{\rm i}\alpha^3+8\alpha\omega)\nonumber\\ &\quad{}\times (\beta-\alpha^2-2{\rm i}\omega-2.5\alpha^2+0.5\alpha^4-3{\rm i}\alpha+3{\rm i}\alpha^3)=0. \end{align}
This equation is solved numerically to obtain the values of  $\alpha$ for which the flow is either stable or unstable. Consequently, the nature of the Ekman spirals is analysed in the stable and unstable regions.
Case B: we analyse Ekman spirals in unstable and stable regions.
In the unstable region, the Ekman spirals are closed curves that initiate from the origin. In the unstable region, as the value of  $\omega$ increases in the range
 $\omega <1$, the area enclosed by the Ekman spirals also increases, and the spirals gradually shift towards the left.
On the other hand, when  $\omega > 1$, the Ekman spirals continue to shift towards the left as the value of
 $\omega$ increases. However, the area enclosed by the spirals becomes smaller with increasing values of
 $\omega$. The maximum enclosed area is obtained at
 $\omega =1$. By comparing figures 3(a) and 3(b), it is apparent that the deviation of the Ekman spirals in the leftward direction is considerably smaller for
 $\omega \geq 1$ compared to
 $\omega <1$.
Unstable Ekman spirals: (a) when  $\omega \leq 1$, (b) when
 $\omega >1$. Closed Ekman spirals initiating from the origin are obtained in unstable cases as well. The deviation of the spirals towards the left is substantially smaller when
 $\omega >1$ compared to when
 $\omega \leq 1$.

In the stable region (when  $\textrm {Re}(\beta )>0$), the behaviour of the Ekman spirals differs from that in the unstable region, as can be seen in figure 4. In the stable region, the Ekman spirals appear as broken curves that initiate from the origin. As the value of
 $\omega$ increases, the discontinuity or ‘cut’ present in the broken spiral gradually diminishes, but a closed curve is never formed. Additionally, with an increasing value of
 $\omega$, the area covered by the curve also reduces, and finally, the discontinuity or ‘cut’ in the spiral moves closer to the origin. As
 $\omega \rightarrow \infty$, both axial and lateral electro-osmotic flow velocities become negligible. This observation indicates that as
 $\omega \rightarrow \infty$, the system behaves like a rigid body, where the fluid motion becomes significantly restricted.
In the case of stable flow, the Ekman spirals are broken curves with the origin as the initiation point. (a) A prominent discontinuity is observed for smaller values of  $\omega$. (b) As
 $\omega$ increases, the discontinuity in each Ekman spiral diminishes. For
 $\omega =1$, the discontinuity in the Ekman spiral is shown in an inset.

3.1.5. Physical significance of the Ekman spirals
We introduce the rotational parameter  $\omega$, defined as the ratio of the Reynolds number
 $Re$ to the Rossby number
 $Ro$. A small Rossby number
 $Ro$ indicates a strong Coriolis force. Given the relationship
 $\omega ={Re}/{Ro}$, the influence of the Coriolis force becomes more dominant compared to the viscous force of the fluid with the increasing values of
 $\omega$ in the regime
 $\omega >1$. Consequently, the Ekman spirals become more tightly confined and shrink in size with increasing
 $\omega$. Conversely,
 $\omega <1$ signifies a weaker Coriolis force, and in this regime, the viscous force predominates, resulting in disorganized and shifting spiral patterns. However, in the case of stable flow, where perturbations and disturbances have reduced impact, the Ekman spirals align almost perfectly, as depicted in figure 4.
The Ekman spiral curves obtained in both stable and unstable regions hold physical significance, as the curves arise due to the Coriolis effect. The distinction between ‘complete’ and ‘broken’ Ekman spirals reflects the persistence or decay of disturbances developed owing to the Coriolis force. In the unstable region, the closed curves of the Ekman spirals suggest that the disturbances developed by the Coriolis effect persist indefinitely and spiral along the closed curves. This implies that the influence of the Coriolis force continues to shape the flow patterns in the unstable region. In the stable region, it is observed from figure 4 that the Ekman spirals do not form closed curves and consist of a discontinuity or ‘cut’ near the origin. The extent of discontinuity, equivalently opening of the ‘cut’, reduces in size with the increasing value of  $\omega$, as illustrated in figures 4(a) and 4(b). This observation signifies that as the value of
 $\omega$ increases, the disturbance being developed also increases. Consequently, the ‘cut’ opening decreases, implying that the disturbances die out beyond a certain period of time.
3.2. Flow dynamics and stability in a bounded domain
Now we consider the flow through a microchannel of height  $2H$ bounded between two parallel plates. The electro-osmotic flow of electrolyte solutions is governed by (2.8) and (2.9), while (2.3) governs the electrical potential function. Here, we normalize the lengths by
 $H$ instead of
 $1/\kappa$. The dimensionless equation for EDL potential obtained from (2.2) is then given by
 \begin{equation} \frac{\partial^2 \psi}{\partial z^2}= \beta^* \sinh(\alpha^* \psi), \end{equation}
where  $\beta ^*=H^2 \kappa ^2/\alpha ^*$, and
 $\alpha ^*= ze\zeta /K_B T$. The term
 $\alpha ^*$ is called the ionic energy parameter. For electrolytic systems having low surface zeta potential
 $({\ll }25 \textrm {mV})$ at
 $25\,^\circ \textrm {C}$, we have
 $\alpha ^*<1$ (Mayur et al. Reference Mayur, Amiroudine, Lasseux and Chakraborty2014). In such a situation, the Debye–Hückel approximation is applicable, which reduces (3.24) to
 \begin{equation} \frac{\partial^{2}\psi}{\partial z^2}=K^{2}\psi , \end{equation}
where  $K=\kappa H$ is said to be dimensionless electrokinetic width, also known as the electro-osmotic parameter. The normalized momentum transport equations are
 $$\begin{gather} \frac{\partial^{2}u}{\partial z^2}-\frac{\partial u}{\partial t}+2\omega v ={-}\frac{\partial^{2}\psi}{\partial z^2} , \end{gather}$$
 $$\begin{gather}\frac{\partial^{2}v}{\partial z^2}-\frac{\partial v}{\partial t}-2\omega u =0, \end{gather}$$
where  $\omega = {Re}/{Ro}= \varOmega H^{2}\rho /\mu$, and
 $Re={\rho U_0 H}/{\mu }$,
 $Ro={U_0}/{\varOmega H}$. Here, we define
 $\omega$ as a dimensionless parameter known as the rotational Reynolds number (Murthy Reference Murthy1987). In this analysis,
 $\varOmega$ is not dependent on the EDL thickness but is a measure of fluid transport due to a rotation by virtue of the viscous effect.
For the analysis, we have assumed specific ranges of pertinent parameters:  $\omega = 0.1, 1.0, 10$, and
 $K = 1.5, 10, 20$. These values were chosen based on the physical properties of the electrolyte solution and dimension of the fluidic configuration, such as the channel half-height
 $H$, which is taken within the range
 $500\ \textrm {nm}\unicode{x2013} 10\ \mathrm {\mu } \textrm {m}$,
 $\lambda _D$ of the order of
 $10^2\ \textrm {nm}$ (Dutta & Beskok Reference Dutta and Beskok2001), and
 $\varOmega$ ranging from 100 to 1000 rps. For instance, when
 $H$ is set at
 $4\ \mathrm {\mu } \textrm {m}$,
 $\lambda _D$ is set at
 $200\ \textrm {nm}$, and
 $\varOmega$ varies from 100 to 1000 rps, the corresponding values are calculated as
 $K = 20$ and
 $\omega = 10$. Analogously, similar estimations were performed for the other parametric values. It may be mentioned here that for the bounded flow configuration, we consider channel half-height
 $H$ to define the electrokinetic parameter
 $K\ (=\kappa H={H}/{\lambda _D})$. Theoretically,
 $K=1$ is a case signifying the onset of EDL overlap for the present analysis. However, the minimum value of
 $K\ (=1.5)$, as considered in this analysis, suggests that the channel half-height is larger than the EDL thickness. Taking this into account, we opted not to consider the phenomenon of EDL overlapping in this work.
3.2.1. Linear stability analysis
We assume that the normal mode solutions to (3.25), (3.26) and (3.27) are taken in the form
 \begin{equation} \begin{bmatrix} u(z,t)\\ v(z,t)\\ \psi(z,t) \end{bmatrix} = \begin{bmatrix} \hat{u}(z) \\ \hat{v}(z) \\ \hat{\psi}(z) \end{bmatrix} \exp({{\rm i} \alpha z-\beta t}), \end{equation}
where  $\alpha$ is the wavenumber along the
 $z$-direction and
 $\beta$ is the growth rate (which can be a complex quantity). Substituting these modes into (3.25), (3.26) and (3.27), and considering
 $\chi = \hat {u}+\textrm {i} \hat {v}$, we obtain the equations
 \begin{equation} \chi'' +a\chi'+b\chi +K^{2}\psi=0 \end{equation}
and
 \begin{equation} \psi''+a\psi'-L\psi=0. \end{equation}
The corresponding boundary conditions are defined as
 \begin{equation} \chi(\pm1)=0\quad \mbox{and}\quad \psi(\pm1)=1, \end{equation}
where  $a=2\textrm {i}\alpha$,
 $b=\beta -\alpha ^2-2\textrm {i}\omega$ and
 $L=K^2+\alpha ^2$, and we rewrite
 $\hat {\psi }$ as
 $\psi$ by dropping the hat symbol.
The relevant equations (3.29) and (3.30), along with the boundary conditions (3.31a,b), are solved using a Galerkin approximation method as adopted in Reza & Gupta (Reference Reza and Gupta2012) and Shivakumara et al. (Reference Shivakumara, Lee, Vajravelu and Akkanagamma2012). The functions  $\chi (z)$ and
 $\psi (z)$ are approximated by a finite series obtained from a complete continuous set of linearly independent functions
 $\chi _n(z)$ and
 $\psi _n(z)$. We take the following approximate solutions for
 $\chi$ and
 $\psi$:
 \begin{equation} \left.\begin{gathered} \chi(z)= \sum_{n=1}^{n=N} a_{n}\,\chi_{n}(z), \\ \psi(z)= \sum_{n=1}^{n=N} b_{n}\,\psi_{n}(z), \end{gathered}\right\} \end{equation}
where  $a_n$ and
 $b_n$ are constants, and
 $\chi _n(z)$ and
 $\psi _n(z)$ denote the sets of basis functions satisfying the respective boundary conditions. We choose
 \begin{equation} \chi_{1}(z)= z(1-z^2), \quad \chi_{2}(z)=(1-z^2)^{2} \end{equation}
and
 \begin{equation} \psi_1(z)=z^4 , \quad \psi_2(z)=z^2. \end{equation}
On substituting the approximated solutions (3.33a,b) and (3.33a,b) into (3.29) and (3.30), residuals are obtained in each case. The sets of coefficients  $a_n$ and
 $b_n$ can be obtained by using the fact that each residual is orthogonal to the set of trial functions over the selected domain. The integral formulation of the Galerkin approximation for
 $\chi _n (z)$ and
 $\psi _n (z)$ can be written as
 \begin{equation} \int_{{-}1}^{1}\chi_{n}(z)\,R_1\,{\rm d}z=0, \quad n=1,2, \end{equation}
and
 \begin{equation} \int_{{-}1}^{1}\psi_{n}(z)\,R_2\,{\rm d}z=0 ,\quad n=1,2, \end{equation}
where  $R_1$ and
 $R_2$ are the respective residues.
Equations (3.35) and (3.36) lead to a homogeneous system of linear equations in four unknowns. The necessary condition for the existence of a non-trivial solution gives rise to
 \begin{equation} \begin{vmatrix} -1.6+0.152b & -0.609a & 0 & 0 \\ 0.609a & 0.812b-2.438 & 0.051K^2 & 0.152K^2 \\ 0 & 0 & 3.428-0.222L & -0.285L+0.8\\ 0 & 0 & 4.8-0.285L & 1.33-0.4L\\ \end{vmatrix} =0. \end{equation}
On expanding (3.37), we obtain the following approximated biquadratic equation in  $K$ as
 \begin{align} &L^2(0.0295+0.0028a^2-0.0126b+0.0009b^2)-L(0.2673+0.0249a^2-0.1123b+0.008b^2) \nonumber\\ &\quad +(2.76411+0.2628a^2-1.1832b+0.0874b^2)=0, \end{align}
where  $K$ is the dimensionless electrokinetic width,
 $a=2\textrm {i}\alpha$,
 $b=\beta -\alpha ^2-2\textrm {i}\omega$ and
 $L=K^2+\alpha ^2$. Equation (3.38) consists of both real and imaginary parts. However, the physical definition of
 $K$ requires that
 $K$ must be real. Hence the solution of (3.38) for a fixed value of
 $\omega$ is considered by taking the absolute value of
 $K$. This consideration is valid because in (3.29),
 $\chi =\hat {u}+\textrm {i} \hat {v}$ represents complex velocity potential. The plot of
 $|K|$ versus
 $\alpha$, as depicted in figure 5(a), illustrates the neutral stability curve with respect to the parameter
 $K$ for the complex velocity potential. As
 $\beta =\beta _{r}+\textrm {i}\beta _{i}$, we consider the case of direct bifurcation when
 $\beta _r=\beta _i=0$. In this situation, (3.38) can be solved to get the neutral curve with respect to the parameter
 $K$ for complex velocity potential with different values of
 $\omega$. From figure 5(a), we observe that with an increase in
 $\omega$, the regions of both stable and unstable zones change significantly. To ascertain the accuracy of our results, we conducted analyses using one, two and three basis functions within the Galerkin expansion framework. Our findings indicate that the outcomes derived from employing two and three basis functions are closely aligned. However, as witnessed in figure 5(b), there is a noticeable discrepancy in the results when considering only a singular term in the Galerkin approximation. A comparative illustration of these results is presented in figure 5(b). While the inclusion of three basis functions provides rigorous insights, the associated computational complexities prompted us to utilize a more streamlined approach with two basis functions for the present analysis.
(a) Neutral stability curve for  $K$ versus
 $\alpha$ with different values of
 $\omega$. The neutral stability curve separates the regions of stability and instability of fluid flow. In this illustration, the stable region exhibits on the lower side of each neutral stability curve, while the upper side corresponds to the unstable region. As the value of
 $\omega$ increases, the instability region increases. (b) Comparison of the numerical results by taking a singular-term Galerkin approximation, a two-point Galerkin approximation and a three-point Galerkin approximation when
 $\omega =10$.

Figures 6(a) and 6(b) plot the variation of real growth rate  $\beta _r$ versus wavenumber
 $\alpha$ for different values of
 $K$, obtained at
 $\omega =1$ and
 $10$, respectively. It is worth mentioning that pertaining to the case
 $\omega =1$, no instability is observed for
 $K=1.5$. This observed behaviour can be attributed to a relatively lower strength of rotational forcing for
 $\omega =1$ together with a significantly smaller electrokinetic parameter at
 $K=1.5$. However, as the value of
 $K$ increases, the channel width also increases, leading to the emergence of instabilities beyond a critical wavenumber. The critical wavenumber, which corresponds to a zero growth rate, can be calculated by identifying the value of
 $\alpha$ at which the growth rate becomes zero, as indicated by the curve. As witnessed in figures 6(a) and 6(b), for
 $\omega =1$ and higher values of
 $K$, the flow remains stable for smaller values of
 $\alpha$. However, instabilities start to manifest as the wavenumber increases. These inferences suggest that the stability of the underlying flow is influenced by the rotation parameter (
 $\omega$) and the electrokinetic width (
 $K$), leading to a wider range of wavenumbers implicating the onset of instabilities.
Variation of real growth rate  $\beta _r$ versus
 $\alpha$ and transition from stability to instability. (a) Different values of
 $K$ when
 $\omega =1$. When
 $K=1.5$ and
 $\omega =1$, the flow is always stable. This trend of stable flow for
 $K=1.5$ continues for a value of
 $\omega$ taken roughly up to 5.95. (b) Different values of
 $K$ when
 $\omega =10$. When
 $K$ is small, there is a transition towards stability from instability. However, as
 $K$ is increased, the flow gradually transits to an unstable flow from a stable flow.

In the analysis dealing with the transition to instability with a fixed value of  $K$ and for different values of
 $\omega$ as depicted in figures 6(a) and 6(b), we observe that for
 $K=1.5$, the flow remains stable for
 $\omega =1$. It can also be shown (as elaborated later) that for
 $K=1.5$, the flow remains stable for
 $\omega \approx 5.95$. This is also depicted in figure 7(a). However, instabilities start to emerge as
 $\omega$ increases beyond its critical value (
 $\omega \geq 6$). These instabilities gradually lead to stability as the wavenumber increases. This observation suggests a transition from stability to instability as
 $\omega$ exceeds a critical value. The exact critical value of
 $\omega$ depends specifically on the problem under consideration.
Variation of real growth rate  $\beta _r$ versus
 $\alpha$ and transition from stability to instability. (a) Different values of
 $\omega$ when
 $K=1.5$. For significantly small values of
 $K$, the flow gradually tends to be stable with increasing wavenumber. (b) Different values of
 $\omega$ when
 $K=10$. For large values of
 $K$, the flow is stable only for smaller wavenumbers, while the instabilities occur in the flow as the wavenumber increases.

Figure 7(b) shows different trends of the stability picture for the higher values of  $\omega$ considered. At a higher value of
 $\omega \ (=10)$, the flow is stable only for smaller wavenumber
 $\alpha$. Increasing the value of
 $\alpha$, the flow gradually becomes unstable, as witnessed by the growth rate curve for different values of
 $K$ in the figure.
We rewrite (3.38) in the form
 \begin{equation} AK^4-BK^2+C=0, \end{equation}
where  $A$,
 $B$ and
 $C$ are defined in Appendix A.
We seek to find the critical wavenumber above which instabilities appear in the flow corresponding to the different values of  $K$ and
 $\omega$. We put
 $\beta =0$ in (3.39), and perform an implicit derivative of
 $K$ with respect to
 $\alpha ^2$. Thus the rate of change of
 $K$ with respect to
 $\alpha ^2$ is obtained as
 \begin{equation} \frac{{\rm d}K}{{\rm d}\alpha^2}= \frac{\varLambda K^4+K^2(2\alpha^2\varLambda+2\delta-\varGamma)+(\alpha^4\varLambda+2\delta\alpha^2-\alpha^2\varGamma-\xi+\epsilon)}{4K^3\delta+2\tau K}, \end{equation}
where  $\tau,\delta,\varLambda, \varGamma, \xi,\varGamma$ are defined in Appendix A. In order to find the critical wavenumber
 $\alpha _c$,
 ${\textrm {d}K}/{\textrm {d}\alpha ^2}$ is set to zero. As a result, we obtain
 \begin{equation} \varLambda K^4+K^2(2\alpha_c^2\varLambda+2\delta-\varGamma)+(\alpha_c^4\varLambda+2\delta\alpha_c^2-\alpha_c^2\varGamma-\xi+\epsilon)=0. \end{equation}
This equation is solved numerically for different values of  $\omega$ after substituting the value of
 $K$ from (3.39). It is to be noted that since wavenumber is a real quantity, only the real part of
 $\alpha _c$ is to be considered from the solution obtained from (3.41). Finally, the critical wavenumber above which the instabilities appear in the flow can be obtained for different values of
 $K$ and
 $\omega$.
In order to study the variation of  $K_c$ (critical electro-osmotic parameter) with respect to wavenumber, the reciprocal of (3.40) is set to zero. The expression of
 $K_c$ for different values of
 $\omega$ as a function of
 $\alpha$ is thus obtained as
 \begin{equation} K_c= \sqrt{-\frac{\tau}{2\delta}}. \end{equation}
Figure 8(a) represents the variation of critical wavenumber ( $\alpha _c$) with
 $K$ for different values of
 $\omega$. It is seen that with increasing
 $\omega$, the range of
 $\alpha _c$ increases. This shows that the system under consideration tends to become stable as
 $\omega$ is increased.
(a) Variation of critical wavenumber  $\alpha _c$ with electro-osmotic parameter
 $K$, for different values of
 $\omega$. As
 $\omega$ increases, the critical value of
 $\alpha$ becomes gradually higher. (b) Variation of critical
 $K$ with wavenumber at different values of
 $\omega$.

The variation of critical electro-osmotic parameter  $K_c$ with wavenumber
 $\alpha$ for different
 $\omega$ is shown in figure 8(b). It can be seen that with increasing
 $\alpha$, the critical electro-osmotic parameter
 $K_c$ first decreases and then increases with increasing
 $\alpha$.
3.2.2. Analytical verification: employment of the modified Routh–Hurwitz criterion
Here, we make an effort to verify the stability threshold of the flow field, employing an analytical method consistent with the modified Routh–Hurwitz criterion. Using this method, we check the stability of the flow for  $K=1.5$ and in the neighbourhood of
 $\omega =5.9$. Additionally, we establish by using this method that the flow is always stable for
 $K=1.5$ and
 $\omega \approx 5.95$. The Routh–Hurwitz criterion is a method used to determine whether the real part of a root of an equation is positive or negative. This technique allows us to determine the sign of the real part of the root without solving the equation (D'Azzo & Houpis Reference D'Azzo and Houpis1960; Anagnost & Desoer Reference Anagnost and Desoer1991). However, when the equation contains complex coefficients, the standard Routh–Hurwitz criterion is not applicable directly. In such cases, the modified Routh–Hurwitz criterion is employed to analyse the stability of the system (Lung Reference Lung1966).
Equation (3.38) in terms of  $\beta$ can be expressed as
 \begin{equation} P(\beta)= p\beta^2 -\beta(q+{\rm i} r)+(x+{\rm i} y), \end{equation}
where the terms  $p,q,r, x,y$ are given in Appendix B. In order to apply the modified Routh–Hurwitz criterion, we introduce another polynomial
 ${\bar P}({\beta })$, which is the complex conjugate of the polynomial
 $P(\beta )$ defined in (3.43). Multiplying (3.43) by its conjugate
 ${\bar P}({\beta })$, we obtain the polynomial
 \begin{equation} F(\beta)=p^2\beta^4-2pq\beta^3+\beta^2\{2px+(q^2+r^2)\}-\beta(2qx+2ry)+(x^2+y^2). \end{equation}
As is evident from this equation, the zeros of the above biquadratic polynomial are complex. To determine the nature of the real part of  $\beta$, which determines the stability of the flow, we construct the Routhian table using (3.44).
The number of sign changes in the first column of the Routhian table corresponds to the number of roots with a positive real part. It is important to note that the number of roots having a positive real part in (3.43) is half the numbers obtained from (3.44).
Using the modified Routh–Hurwitz criterion, we now show that the flow is always stable for  $K=1.5$ and
 $\omega =5.9$. If we put
 $K=1.5$,
 $\omega =5.9$ in (3.43), then we obtain the polynomial
 \begin{equation} P_{1.5,5.9}(\beta)= 0.1105\beta^2-\beta(q_1+{\rm i}r_1)+(x_1+{\rm i}y_1), \end{equation}
where  $q_1=1.00028+0.211\alpha ^2$,
 $r_1=1.5445$,
 $x_1=-2.0301+2.1087\alpha ^2+0.1106\alpha ^4$ and
 $y_1= 11.8063+2.6091\alpha ^2$.
As mentioned earlier, we introduce another polynomial  $\overline {P_{1.5,5.9}}(\beta )$, which is the conjugate of
 ${P_{1.5,5.9}(\beta )}$, and multiply them to get the resultant biquadratic polynomial
 \begin{align} F_{1.5,5.9}(\beta)&=0.0122\beta^4-0.221q_1\beta^3+(0.221x+q_{1}^2+r_{1}^2)\beta^2 \nonumber\\ &\quad -(2y_1r_1+2q_1x_1)\beta +(x_{1}^2+y_{1}^2). \end{align}
Using (3.46), we construct the Routhian table (see table 1a) for  $F_{1.5,5.9}(\beta )$.
(a) Routhian table for  $F_{1.5,5.9}(\beta )$. (b) Estimation of
 $A_{1}$,
 $A_{2}$,
 $B_{1}$ and
 $C_{1}$.

The expressions  $A_1$,
 $A_2$,
 $B_1$ and
 $C_1$ in table 1(a) are defined in Appendix C.
Based on the analysis of data given in the Routhian table, the values of  $A_1, A_2, B_1, C_1$ are obtained for
 $\alpha =0$–
 $5$ as given in table 1(b).
By comparing table 1(b) with table 1(a), it is observed that in the Routhian table, there are four changes in sign along the first column. This indicates that the complex polynomial given in (3.46) will have four zeros with a positive real part. This feature, in turn, shows that the polynomial (3.45) will have two zeros whose real part is positive. Since a positive real  $\beta$ denotes a stable flow, it can be inferred that for
 $K=1.5$ and
 $\omega =6$, the flow is indeed stable.
Now we aim to show the instabilities in the flow when  $K=1.5$ and
 $\omega =6$. We put
 $K=1.5$ and
 $\omega =6$ in (3.43), yielding the polynomial
 \begin{equation} P_{1.5,6}(\beta)=0.1105\beta^2-\beta(g+{\rm i} h)+(m+{\rm i} n), \end{equation}
where  $g=1.00028+0.2211\alpha ^2$,
 $h=1.57065$,
 $m=-2.1793+2.2310\alpha ^2+0.1105\alpha ^4$ and
 $n=12+2.6533\alpha ^2$. By introducing the conjugate polynomial, as discussed earlier, and multiplying it with (3.47), we obtain the biquadratic polynomial
 \begin{align} F_{1.5,6}(\beta)= 0.0122\beta^4-0.221\beta^3g+(0.221m+g^2+h^2)\beta^2-(2gm+2hn)\beta+(m^2+n^2). \end{align}
In the Routhian table 2, the expressions for  $A_1, A_2, B_1, C_1$ are the same as defined in table 1.
Routhian table for  $F_{1.5,6}$(
 $\beta$).

By constructing a table similar to tables 1(a) and 1(b), and performing an analysis using tabulated data, it is observed that for  $\alpha$ in the range 0–0.235, there are two sign changes. This indicates that two zeros of the polynomial (3.48) with a negative real part exist. Consequently, the polynomial (3.47) has one zero whose real part is negative. Therefore, it can be concluded that for
 $K=1.5$ and
 $\omega =6$, instabilities start to appear in the flow field.
Similarly, using the modified Routh–Hurwitz criterion for different values of  $K$ and
 $\omega$, different ranges of wavenumbers can be obtained at which the flow is unstable.
3.2.3. Generalized flow analysis
Pertaining to the flow in a bounded configuration, we also attempt to demonstrate the flow field as described by the velocity variation in both stable and unstable scenarios. Using (3.25), (3.26) and (3.27), we obtain the differential equation in  $\chi$ as
 \begin{equation} \chi''+a\chi'+b\chi={-}\frac{K^{2}\cosh\{({\rm i}\alpha+K)z\}}{\cosh({\rm i}\alpha+K)}, \end{equation}
where  $a=2\textrm {i} \alpha$ and
 $b=\beta -\alpha ^{2}-2\textrm {i}\omega$. The right-hand side of (3.49) is obtained from the analytical solution of (3.25), subject to the boundary conditions of
 $\psi$ given in (3.31a,b).
The solution of (3.49) using the boundary condition (3.31a,b) takes the form
 \begin{equation} \chi(z)=\frac{{\rm e}^{{\rm i}\alpha}\,K^{2}}{K^{2}-aK+b}\left(\frac{\cosh(lz)}{\cosh l}-\frac{\cosh\{({\rm i}\alpha+K)z\}}{ \cosh ({\rm i}\alpha+K)}\right) , \end{equation}
where  $l=\sqrt {2\textrm {i}\omega -\beta }$. In particular, the solution for
 $\alpha =0$ and
 $\beta =0$ reproduces the steady-state solution given by
 \begin{equation}
\chi(z)=\frac{K^{2}}{K^{2}-2{\rm i}\omega}
\Bigg(\frac{\cosh(\sqrt{2i\omega}\,z)}{\cosh
\sqrt{2{\rm i}\omega}}-\frac{\cosh(Kz)}{\cosh K}\Bigg) .
\end{equation}
It is worth mentioning here that the solution described in (3.27) aligns with the findings presented in Chang & Wang (Reference Chang and Wang2011). Specifically, for small values of  $K$, the EDL potential reaches a minimum at the centre of the channel. When the value of
 $K$ is low, the velocity profile of
 $u$ is approximately parabolic in the absence of rotation, and decreases rapidly with rotation. These observations indicate the influence of rotation on the EDL potential and velocity distribution.
3.2.4. Flow characteristics at stable and unstable regions
The stability of the flow can be assessed by examining the growth rate  $\beta$. A positive value of
 $\beta$ indicates stability, while a negative value signifies flow instability. From figure 9, we observe that the flow is always stable for
 $K=1.5$,
 $\omega =1$, hence a fully developed parabolic nature of the velocity profile is obtained. It is also seen that as the wavenumber
 $\alpha$ and the corresponding growth rate increase, the absolute value of the complex velocity reduces. We have performed full-scale numerical simulations using the finite element framework of COMSOL Multiphysics by considering the Poisson–Boltzmann equation with Gouy–Chapman theory for the description of EDL potential, and the Navier–Stokes equations for a purely electro-osmotically driven flow in a rotating microchannel. The comparison analysis of our results, both analytical solutions and simulated data, with the reported results of Chang & Wang (Reference Chang and Wang2011) is presented in figure 10(a). As witnessed in figure 10(a), our analytical solutions agree well with both full-scale simulated and reported theoretical results for all the values of
 $K$ and
 $\omega$ considered. In figure 10(b), we compare our analytical solutions with the experimental results of Hsieh et al. (Reference Hsieh, Lin and Lin2006) in the limiting case of a non-rotating channel. It is worth mentioning here that the lack of experimental data pertaining to rotating electro-osmotic flows encouraged us to focus on this benchmarking analysis in the limiting case. The velocity profile in the stability regions is known to expose a fully developed parabolic or wave-like structure. Conversely, in the unstable region, the flow profile takes the form of a flattened parabolic profile as depicted in figure 11(a). Figure 11(a) illustrates the variation of the resultant velocity profile at different stability conditions when the other parameters are
 $K=1.5$ and
 $\omega =10$, while 11(b) illustrates the resultant velocity profile for
 $K=20$ and
 $\omega =1$ at different stability conditions. As the value of
 $\beta$ increases, the velocity profiles show a plateau-like structure. The disturbance of the flow field occurs near the central line of the channel. For a set of parametric values, i.e. for
 $K=1.5$,
 $\omega =10$, both least stable and unstable zones exist. The approximate highest negative value of
 $\beta$ represents the most unstable velocity profile, while the least stable corresponds to the least positive value of
 $\beta$. The most unstable, as well as least stable, growth rate and its corresponding wavenumbers can be determined from figures 7(a) and 7(b).
Stable velocity profile of the resultant velocity  $|\chi (z)|=\sqrt {(u^2+v^2)}$ at different wavenumbers and their corresponding growth rate: (I)
 $\alpha =0.08$,
 $\beta =2.8$; (II)
 $\alpha =1.51$,
 $\beta =6.37$; (III)
 $\alpha =2.48$,
 $\beta =10.59$, when
 $\omega =1$,
 $K=1.5$.

(a) Comparison of axial velocity profiles obtained from the analytical solution at the steady state (when  $\alpha =0$,
 $\beta =0$) with direct numerical simulation and previous theoretical investigation. (b) Comparison of the present dimensional axial electro-osmotic flow velocity for the limiting case of zero rotational speed with the experimental results of Hsieh, Lin & Lin (Reference Hsieh, Lin and Lin2006) when electro-osmotic mobility is
 $4.21\times 10^{-8}\ \textrm {m}^2\ (\textrm {V}-\textrm {s})^{-1}$
 $\textrm {m}^2/\textrm {V}/\textrm {s}$ and zeta potential is
 $-55.32\ \textrm {mV}$ for
 $10\ \textrm {mM}$ NaCl solution. The dimensional axial velocity is obtained by multiplying the electro-osmotic mobility and electric field into the present dimensionless axial velocity field for the limiting case of zero rotational speed.

(a) Velocity profile for the electro-osmotic flow  $|\chi |=\sqrt {(u^2+v^2)}$ for
 $K=1.5$,
 $\omega =10$ when the flow is: maximum unstable (
 $\alpha =0.005$,
 $\beta =-1.613$), least stable (
 $\alpha =0.934$,
 $\beta =0.0005$) and stable (
 $\alpha =2.768$,
 $\beta =12$). (b) Velocity profile for the electro-osmotic flow
 $|\chi |=\sqrt {(u^2+v^2)}$ for most stable, neutral and unstable regimes when
 $K=20$,
 $\omega =1$. Here, most stable is defined as a stability of flow with maximum positive growth rate.

These profiles bear significant information about the transition of the field for electro-osmotic flow. This flattening effect can be attributed to the destabilizing factors in the flowing fluid. In the case of instability, the flow velocity profile exhibits a depression or disturbance in the vicinity of the central line of the channel. This depression signifies the disruptive effects of instability on the behaviour of the electro-osmotic flow. This characteristic feature suggests that the flow becomes more turbulent or irregular, deviating from the expected parabolic or wavy shape as demonstrated in stable conditions.
4. Summary, conclusion and perspective
In this work, we present a comprehensive analysis focusing on the stability picture of the rotating electro-osmotic flow in unconfined (single infinite plate) and confined (channel bounded by two parallel plates) configurations. We investigate the transverse flow behaviour in a steady state, and aptly demonstrate its response to varying rotational speeds. Additionally, we perform stability analysis using the semi-analytical framework to explore the velocity profiles in both stable and unstable regions.
For the unconfined case, the present analysis witnesses the presence of closed orbits called Ekman spirals in the plots of axial velocity ( $u$) and lateral velocity (
 $v$). As shown in this paper, the size of the Ekman spirals decreases with rotational speed (
 $\omega$). This behaviour was observed in both steady-state and unstable cases. However, as seen for the unstable case, the spirals are not aligned and shift leftwards with increasing
 $\omega$. In the stable region, each Ekman spiral is accompanied by a discontinuity, realized by a diminishing cut, indicating the decay of disturbances over time.
Pertaining to the flow in a confined domain, we solve the linear stability equation using the Galerkin approximation method. We depict the neutral stability curves for different values of the electro-osmotic parameter ( $K$) and
 $\omega$. The results show that the stability of the flow decreased with increasing
 $\omega$. Applying the modified Routh–Hurwitz criterion, which is employed for the first time in the context of the stability analysis, we establish that the flow was always stable for
 $K=1.5$, and
 $\omega$ up to approximately 6. We also undertake an effort in this work to investigate steady-state flow profiles in both stable and unstable states.
The findings of this paper highlight the significance of both  $\omega$ and
 $K$ as crucial parameters in determining the stability of the system. The present modelling framework is deemed pertinent to reveal the effect of time-modulated external electric fields on the stability picture of rotational flows, offering a more practical approach to solve stability issues of the flows in state-of-the-art lab-on-a-chip systems. We believe that the insights gained from the stability analysis of the chosen flow configurations have potential implications in the design and development of various systems, used typically in drug delivery and mass transfer. Moreover, the analysis of the underlying flow, presented in this study, can serve as a basis for investigating solute mixing in annular channels using lateral transverse flow.
Acknowledgements
The authors sincerely thank the esteemed reviewers for their valuable comments and suggestions based on which the present work is improved. The authors would like to acknowledge Dr S.K. Mehta (Research Associate in Microfluidics and Microscale Transport Processes Laboratory, Department of Mechanical Engineering, IIT Guwahati, India) for his help pertaining to COMSOL simulations and graphics.
Funding
This work was supported financially by the Science and Engineering Research Board (SERB), New Delhi (G.C.S., MATRICS Project grant no. MTR/2021/000073) and the UGC, New Delhi for providing a Junior Research Fellowship to A.S.
Declaration of interests
The authors report no conflict of interest.
Data availability statement
The data that support the findings of this study are available within the paper.
Author contributions
G.C.S. and A.S. derived the theory and illustrated results graphically, and P.K.M. performed the simulations. All authors contributed equally to analysing data and reaching conclusions, and in writing the paper.
Appendix A
The terms  $A$,
 $B$ and
 $C$ appearing in (3.39) are given by
 \begin{equation} \left.\begin{array}{@{}c@{}}
A=0.0295+0.0028a^2-0.0126b+0.0009b^2,\\
B=2\alpha^2A-(0.2673-0.09\alpha^2-0.1123b+0.008b^2),\\
C=\alpha^4A-\alpha^2(0.2673-0.09\alpha^2-0.1123b+0.008b^2)\\
+(2.7611-1.05\alpha^2-1.1832b+0.0874b^2).
\end{array}\right\}\end{equation}
The terms  $\varLambda$,
 $\varGamma$,
 $\delta$,
 $\tau, \xi$ and
 $\epsilon$ in (3.40) and (3.41) are given by
 \begin{equation} \left.\begin{gathered} \varLambda={-}0.0994+0.0018\alpha^2+0.0036{\rm i}\omega,\\ \varGamma=0.022+0.016\alpha^2+0.032{\rm i}\omega,\\ \delta=0.0295-0.0112\alpha^2+0.0126(\alpha^2+2{\rm i}\omega)+0.0009(\alpha^4-4\omega^2+4{\rm i}\alpha^2\omega),\\ \tau=2\alpha^2\delta-\{0.2673-0.09\alpha^2+0.1123(\alpha^2+2{\rm i}\omega)+0.008(\alpha^4-4\omega^2+4{\rm i}\alpha^2\omega)\},\\ \xi=\{0.2673-0.09\alpha^2+0.1123(\alpha^2+2{\rm i}\omega)+0.008(\alpha^4-4\omega^2+4{\rm i}\alpha^2\omega)\},\\ \epsilon= 0.1332+0.1748\alpha^2+0.3496{\rm i}\omega. \end{gathered}\right\} \end{equation}
Appendix B
The expressions for  $p$,
 $q$,
 $r$,
 $x$ and
 $y$ appearing in (3.43) are defined as
 \begin{equation} \left.\begin{gathered}
p= 0.088+0.008K^2+0.0009K^4,\\
q=1.2+0.176\alpha^2-0.117K^2+0.016\alpha^2K^2+0.0126K^4+0.0018\alpha^2K^4,\\
r=0.352\omega-0.032\omega K^2-0.0036\omega K^4,\\
x=2.8056+0.136\alpha^2+0.088\alpha^4-0.0352\omega^2-0.274K^2+0.928\alpha^2K^2\\
+0.008\alpha^4 K^2-0.032 \omega^2
K^2+0.029K^4+0.0014\alpha^2K^4\hphantom{000000}\\
+0.0009\alpha^4 K^4-0.0036\omega^2K^4,\hphantom{000000000000000000000000} \\
y=2.4\omega+0.352\alpha^2 \omega-0.234\omega
K^2+0.032\omega \alpha^2 K^2 +0.0252\omega
K^4+0.0036\alpha^2 \omega K^4.
\end{gathered}\right\} \end{equation}
Appendix C
The expressions for  $A_1$,
 $A_2$,
 $B_1$ and
 $C_1$ used in table 1 are estimated as
 \begin{equation} \left.\begin{gathered} A_1= \frac{1}{- ({-}0.221q_1)}\begin{vmatrix} 0.0122 & 0.221x_1+q_{1}^2+r_{1}^2 \\ -0.221q_1 & -(2y_1r_1+2q_1x_1) \\ \end{vmatrix},\\ A_2=\frac{1}{{-({-}0.221q_1)}}\begin{vmatrix} 0.0122 & x_{1}^2+y_{1}^2 \\ -0.221q_1 & 0 \\ \end{vmatrix},\\ B_1= \frac{1}{- A_1}{\begin{vmatrix} -0.221q_1 & -(2y_1r_1+2q_1x_1) \\ A_1 & A_2 \\ \end{vmatrix}},\quad C_1=\frac{1}{-B_1}{\begin{vmatrix} A_1 & A_2 \\ B_1 & 0 \\ \end{vmatrix}}. \end{gathered}\right\} \end{equation}



