

Introduction
Pregnant women at risk of preterm birth are treated with synthetic glucocorticoids (GC) to promote fetal lung maturation.Reference Polyakov, Cohen and Marita1 Corticosteroids are potent modulators of fetal development and antenatal corticosteroids are routinely used to decrease morbidity and mortality after preterm birth.Reference Crowley2 However, concerns have arisen about possible deleterious perinatal and life-long consequences of fetal GC exposure in mid- to late-gestation. Studies in sheep have shown that maternal intramuscular injections of betamethasone (BET) in clinically relevant amounts enhanced fetal lung maturation, but were associated with altered developmental and functional physiology of the lamb after birth with potential long-term consequences for later health and disease risk.Reference Ikegami, Jobe and Newnham3–Reference Newnham8 In sheep,Reference Sloboda, Newnham and Challis5, Reference Sloboda, Challis, Moss and Newnham7, Reference Sloboda, Moss, Gurrin, Newnham and Challis9, Reference Sloboda, Moss and Li10 ratsReference Benediktsson, Lindsay, Noble, Seckl and Edwards11, Reference Cleasby, Livingstone, Nyirenda, Seckl and Walker12 and guinea pigsReference Owen and Matthews13, Reference Banjanin, Kapoor and Matthews14 elevated prenatal GC levels are associated with fetal growth restriction and sexually dimorphic alterations in hypothalamic–pituitary–adrenal (HPA) regulation in the offspring. The mechanisms responsible for these functional changes are poorly understood.
The fetal HPA axis plays a vital role in fetal maturation during late gestation. Fetal circulating cortisol concentrations increase before birth,Reference Fowden, Li and Forhead15 contributing to maturation of fetal organ systems and metabolic pathways in preparation for postnatal life. In sheep, late gestation increases in fetal plasma adrenocorticotropin (ACTH) and cortisol levels are associated with increased proopiomelanocortin (POMC) mRNA levels in the fetal anterior pituitary. POMC synthesis and ACTH output are stimulated by corticotrophin-releasing hormone (CRH) and arginine vasopressin (AVP), synthesized by neurons in the parvocellular and magnocellular regions of the hypothalamic paraventricular nucleus (PVN). Cortisol negative feedback inhibits ACTH synthesis and secretion through binding to glucocorticoid receptors (GR) at the level of both the paraventricular nucleus in the hypothalamus and at the pituitary corticotrophs,Reference McDonald16, Reference Akagi, Berdusco and Challis17 although during fetal life this activity appears to be diminished in part due to cortisol binding to circulating corticosteroid binding globulin (CBG).
We have shown previously that repeated maternal administration of synthetic GCs in amounts sufficient to induce lung maturationReference Moss, Harding and Newnham18, Reference Jobe, Moss and Nitsos19 reduced fetal growth and postnatal weight up to 3 months of age,Reference Moss, Sloboda and Gurrin4 significantly reduced the abundance of circulating insulin-like growth factor I (IGF-I) and total insulin-like growth factor binding protein (IGFBP) in fetal plasma and early postnatal lifeReference Gatford, Owens and Li20 and altered postnatal HPA responsiveness in basal and stimulated states.Reference Sloboda, Newnham and Challis5, Reference Sloboda, Moss, Gurrin, Newnham and Challis9, Reference Sloboda, Moss and Li10, Reference Sloboda, Moss and Li21, Reference Sloboda, Moss and Li22 In the present study, we set out to determine the effects of maternal intramuscular BET injections at discrete developmental time windows on fetal HPA development and on key enzymes in the HPA axis to determine the extent to which these were responsible for the previously observed changes in long-term HPA axis activity. We measured mRNA levels in HPA axis tissues from fetuses before maternal BET administration, and after one, two or three injections of maternal BET in fetal and postnatal animals. To eliminate potential confounding effects of sex, we confined our measures to male fetuses only.
Methods
Animal procedures
All experimental procedures were approved by the Animal Experimentation Ethics Committee of The University of Western Australia and/or the Western Australian Department of Agriculture.
Determination of fetal sex
Date-mated pregnant Merino ewes (Ovis aries) bearing singleton fetuses were examined by ultrasound imaging at 60 days of gestation (dG) and 10 ml amniotic fluid was collected under ultrasound guidance. To determine fetal sex, genomic DNA was extracted from amniotic fluid, and assayed by a duplex PCR that uses SCUcd043.FWD/SCUcd043.REV primers to amplify only samples with ovine Y-chromosome, together with P1-5EZ/P2-3EZ primers that amplify the ZFY/ZFX locus (Table 1).Reference Gutierrez-Adan, Cushwa, Anderson and Medrano23 P1-5EZ and P2-3EZ were used as internal controls. Amniocentesis data were available from all animals except those studied at 145 dG, where males were identified by ultrasound imaging of the genitalia at ~75 dG.
Primers used to determine fetal sex

Prenatal treatment
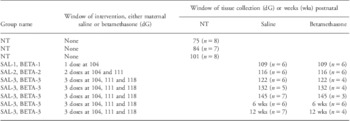
Control and treatment ewes all received an intramuscular injection of 150 mg medroxyprogesterone acetate (Depo-Ralovera, Kenral, Upjohn, Australia) at 100 dG as described previously, to reduce pregnancy losses associated with subsequent GC treatmentReference Moss, Sloboda and Gurrin4, Reference Sloboda, Moss, Gurrin, Newnham and Challis9 (Table 2). Pregnant ewes bearing singleton male fetuses were allocated randomly to receive either saline or BET intramuscular injections. Animals received single injections of either saline or BET at 104 dG (BET-1), or two injections at 104 and 111 dG (BET-2) or three injections at 104, 111 and 118 (BET-3) dG. Control animals (C) received 5 ml of intramuscular saline and treatment animals (T) received BET (0.5 mg/kg maternal body weight; 5.7 mg/ml; Celestone Chronodose, Schering-Plough, NSW, Australia).
Protocol for prenatal treatment and sample collection

SAL, saline; BETA, betamethasone; NT, non-treatment; dG, days of gestatio; wks, postnatal age.
Plasma and tissue collection
Plasma, hypothalamic, pituitary and adrenal tissues were collected from control and treated animals before, during and after BET treatment at: 75, 84, 101, 109, 116, 122, 132, 145 dG and at 6 and 12 weeks of postnatal age (Table 2). As shown in Table 2, animals receiving one injection of BET were killed on 109 dG, those receiving two injections of BET were killed on 116 dG and those animals receiving three injections of BET were sampled three additional times in gestation (122, 132 and 145) and postnatally at 6 and 12 weeks of age. Using previously described techniques,Reference Sloboda, Moss and Li10, Reference Sloboda, Moss and Li22, Reference Holloway, Howe and Chan24 pregnant ewes were euthanized by captive bolt and fetuses were delivered by Cesarean section, umbilical arterial blood was collected, and fetuses were weighed and then killed with a lethal amount of pentobarbitone. Maternal blood was collected by jugular venipuncture. In those animals allocated to postnatal collection, the pregnant ewes had all received three injections of BET or saline during pregnancy; those animals were permitted to deliver their lambs spontaneously at the research station. Body weight was recorded within 6 h after delivery and lambs were kept with the ewes and were not disturbed, but were observed several times each day. At 6 and 12 weeks of age the lambs were anaesthetized with ketamine (20 mg/kg, Troy Laboratories, Smithfield, NSW, Australia) and xylazine (0.5 mg/kg, Troy Laboratories, Smithfield, NSW, Australia) and then killed. Blood samples were centrifuged at 1800 g for 10 min at 4°C, and plasma collected and stored at −80°C until further analyses. Fetal and postnatal brains were removed. Hypothalamic blocks and pituitary tissue were dissected and slow-frozen on dry ice, and then stored at −80°C until cryosectionning and further analyses. Adrenal tissues were dissected, frozen in liquid nitrogen and stored at −80°C until further analyses.
Analytical measures
Determination of plasma ACTH, cortisol, estradiol and progesterone concentrations
Maternal and fetal plasma ACTH concentrations were determined using a commercial RIA kit (Diasorin, MN, USA) validated for use in sheep.Reference Sloboda, Moss, Gurrin, Newnham and Challis9, Reference Sloboda, Moss and Li10 The intra-assay coefficient of variation was 6.7%. The minimum detectable ACTH concentration was 5 pg/ml. The ACTH antibody cross-reacted <0.01% with α-melanocyte-stimulating hormone, β-melanocyte-stimulating hormone, β-endorphin and β-lipotrophin. Total plasma cortisol concentrations were determined using a commercial RIA kit (Diasorin, MN, USA) previously validated in sheep.Reference Sloboda, Moss and Li10 The intra-assay coefficient of variation was 7.6%. The minimum detectable cortisol concentration was 1 ng/ml. The cortisol antibody cross-reacted <0.4% with corticosterone, ⩽0.1% with aldosterone, progesterone and deoxycorticosterone. Maternal plasma 17β estradiol concentrations were measured using a commercially available ImmuChem™ double antibody 125I kit (ICN Biochmedicals Inc., CA, USA). The intra-assay coefficient of variation was 1.9%. The sensitivity of the assay was 8 pg/ml. The estradiol antibody cross-reacted <0.01 with ethinyl estradiol, androstenedione, progesterone and pregnenolone. Maternal plasma progesterone concentrations were measured using a commercial RIA kit (Coat-A-Count, Diagnostic Products Co., CA, USA) previously validated for use in sheep.Reference Zarkawi and Soukouti25 The progesterone cross-reacted <0.3% with 20α-dihydroprogesterone, medroxyprogesterone and pregnenolone. The intra-assay coefficient of variation was 2.6%.
Semi-quantification of key genes in hypothalamic and pituitary tissue
In situ hybridization
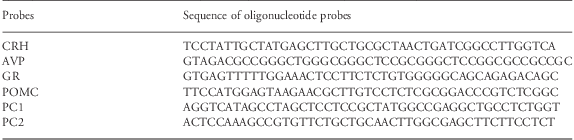
In situ hybridization was used to localize and quantify mRNA levels of hypothalamic CRH, AVP and GR and pituitary POMC, prohormone convertase 1 (PC1), prohormone convertase 2 (PC2) and GR. Briefly, sections (10 μm) of frozen hypothalamic and pituitary tissue were cut on a cryostat (CM 1900, Leica Instruments, Nussloch, Germany) at −23°C and thaw-mounted onto charged glass slides (Superfrost Plus; Lomb Scientific, NSW, Australia). The sections were fixed in 4% paraformaldehyde for 5 min, rinsed twice in 0.01 M PBS for 1 min each and dehydrated in 70% ethanol for 5 min followed by 95% ethanol for 1 min. The sections were stored at 4°C in 95% ethanol until hybridization. Oligonucleotide probes (1 ng/μl) for CRH, AVP, GR, POMC, PC1 and PC2 (Table 3) were radiolabeled using terminal deoxynucleotidyl transferase (Promega, NSW, Australia) and [35S]-deoxyadenosine 5′-(α-thio) triphosphate [1250Ci (46.2TBq)/mmol; PerkinElmer Pty Ltd, VIC, Australia] to an activity of ~120,000 cpm/μl. One μl of labeled probe in 200 μl of hybridization buffer was applied to each section. The sections were incubated overnight in a humidity chamber at 42°C. The sections were washed in 1 × SSC (saline-sodium citrate buffer) for 20 min at room temperature and 1 × SSC for 30 min at 55°C. The sections were rinsed twice with 1 × SSC and once with 0.1 × SSC for 10 s at room temperature, dehydrated in 70% and 95% ethanol, air-dried and exposed to autoradiographic film (Agfa, Mortsel, Belgium) with 14C standards (0.02mCi/slide, ARC Inc., MO, USA). Negative controls consisted of 45-mer antisense deoxyribonucleotide probes (GeneWorks, SA, Australia) as previously described.Reference Bloomfield, Oliver and Hawkins26, Reference McCabe, Marash, Li and Matthews27 The relative optical density (ROD) of the signal on the film of 8–18 sections per tissue per animal was quantified using computerized image analysis software ImageQuant TL 7.0 (GE Healthcare, NSW, Australia). Values represent an average density over the area measured after background values were subtracted and are presented as relative mRNA levels. Control and experimental sections were processed together to allow direct comparisons between groups. A separate analysis was carried out for AVP mRNA in parvocellular and magnocellular fields of the ovine PVN. The magnocellular and parvocellular values are only estimates as the magnocellular neurons are located at the extreme lateral fields of the PVN while the parvocellular neurons are located in the medial area without a complete separation of the two regions. POMC mRNA is distributed regionally within the pituitary; analysis of the superior region (region around the pars intermedia) and the inferior region (region at the base of the pars distalis) was performed separately in addition to analysis of the entire pars distalis.
Probes used in situ hybridization
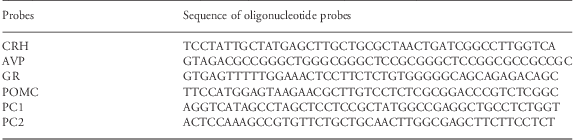
CRH, corticotrophin-releasing hormone; AVP, arginine vasopressin; GR, glucocorticoid receptors; POMC, proopiomelanocortin; PC1 and PC2, prohormone convertase 1 and 2.
Quantification of gene expression in adrenal tissue
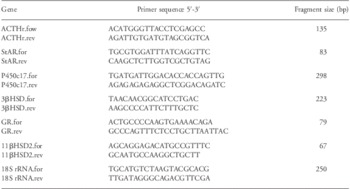
Total RNA was prepared from adrenal tissue using the RNeasy Mini kit (Qiagen Pty Ltd, VIC, Australia) as described previously.Reference Sloboda, Moss and Li10, Reference Sloboda, Moss and Li22 Genomic DNA contamination was minimized by treating each sample with RNase-Free DNase I kit (Qiagen Pty Ltd, VIC, Australia) during RNA purification. RNA was quantified by NanoDrop ND-1000 spectrophotometer (NanoDrop Thermo Scientific, DE, USA). Complementary DNA (cDNA) was synthesized from 1 μg of RNA in a total volume of 15 μl containing 200 ng random hexamers (Promega Corp., NSW, Australia), incubated at 70°C for 5 min and then 10 μl reverse transcription mixture [5 μl of 5× reaction buffer, 1.25 μl of 10 mM dNTP's (Promega Corp., NSW, Australia), 100 units of Moloney Murine Leukemia Virus reverse transcriptase (Promega Corp., NSW, Australia)] was added to the template and incubated at 22°C for 10 min, 55°C for 50 min. The reaction was inactivated by heating for 15 min at 70°C. cDNA was purified using MinElute PCR purification kit (Qiagen Pty Ltd, VIC, Australia). Quantitative real-time PCR was carried out using the Rotor-Gene 3000 centrifugal real-time cycler (Corbett Research, NSW, Australia). Reactions (10 μl) were set up using the following final concentrations: 1 μl of 10× Immo buffer (Bioline Pty Ltd, NSW, Australia), 3 mM MgCl2 (Bioline Pty Ltd, NSW, Australia), 2 mM dNTP's (Promega Corp., NSW, Australia), 0.5 μl SYBR Green (1:2000, Fisher Biotec, WA, Australia), 0.5 unit Immolase DNA polymerase (Bioline Pty Ltd, NSW, Australia) and 5 pmol each of sense and antisense primers (GeneWorks Pty Ltd, SA, Australia; Table 4) and 2 μl of cDNA. Primers were designed using Primer 3.0 software (adrenocorticotropin receptor (ACTHr), GeneBank accession number AF116874; steroidogenic acute regulatory (StAR), GeneBank accession number NM1009243; GR, GeneBank accession number S44554) or were previously validated (P450c17;Reference Sloboda, Moss and Li10 3β hydroxysteroid dehydrogenase (3β HSD);Reference Zhao, Simard, Labrie, Breton and Rheaume28 11β hydroxysteroid dehydrogenase type 2 (11β HSD2)Reference Dodic, Hantzis and Duncan29 and 18S rRNA).Reference Van Harmelen, Ariapart and Hoffstedt30 18S rRNA served as reference and was run with each target gene. For tissues collected from fetal and postnatal lambs cDNA was amplified using the following cycling conditions: 95°C for 2 s (ACTHr), 0 s (StAR and 3β HSD), 5 s (P450c17 and GR), 8 s (11β HSD2); 61°C for 15 s (ACTHr); 61°C for 10 s (StAR and 11β HSD2); 60°C for 15 s (P450c17 and 3β HSD); 59°C for 10 s (GR); and 72°C for 10 s extension. Amplification of products was achieved with 40 cycles for ACTHr and GR, 45 cycles for StAR, 38 cycles for P450c17 and 11β HSD2, 35 cycles for 3β HSD. All samples were run in triplicate. Amplification efficiencies were determined from the slope of a plot of Ct (defined as the threshold cycle with the lowest significant increase in fluorescence) against the log of the cDNA template concentration. Results were expressed as a ratio of target gene to the internal control (18S rRNA). The data were analyzed by 2−ΔΔCT relative quantitation method using the Rotor-Gene 6.0 analysis software (Corbett Research, NSW, Australia).
Primers used in quantitative RT-PCR

Statistical analysis
Data analysis was carried out using SigmaStat 3.5 statistical software. Results are presented as the mean ± s.e. of the mean (s.e.m.). The body weight, plasma and mRNA level measures were analyzed using a 2 factor ANOVA comparisons between ages and each of the four treatment groups. Post-hoc comparisons between group means were made using the Holm–Sidak method allowing for differences in the distribution of age between the groups. In all cases, data that were not normally distributed were log transformed to achieve normality. Statistical significance was accepted at P < 0.05.
Results
Body weight and gestational age at birth
Maternal BET administration significantly impaired fetal growth and resulted in reduced fetal body weight from 116 dG to term (all P < 0.05), consistent with our previously reported observationsReference Gatford, Owens and Li20, Reference Jobe, Wada, Berry, Ikegami and Ervin31, Reference Moss, Doherty and Nitsos32 (Table 5). At 6 and 12 weeks of postnatal age, body weights in the treatment group (BET injections) tended to be less than in controls but the differences were not significant (P ⩾ 0.065). The duration of gestation was significantly longer in the 3-BET treatment group than in controls (154 ± 0.5 v. 152 ± 0.6 dG, P = 0.03).
Fetal and postnatal sheep body weights

C, control; T, treatment; NT, non-treatment; BW, body weight; dG, days of gestation; wks, postnatal age.
*P < 0.05 v. control.
Endocrine measures
Maternal: ACTH, cortisol, progesterone and estradiol
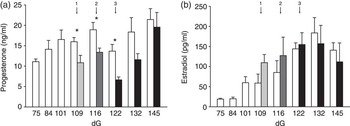
There was no significant effect of BET treatment on maternal plasma ACTH levels; however, maternal plasma cortisol levels were significantly lower in BET treated ewes at 145 dG compared with control ewes (Table 6). Overall, BET treatment reduced maternal plasma progesterone levels at all time-points and this difference was statistically significant at 109, 116 and 122 dG (Fig. 1a). There was no significant effect of BET on maternal estradiol levels at any time-point (Fig. 1b).
Maternal plasma ACTH and cortisol

ACTH, adrenocorticotropin; C, control; T, treatment; NT, non-treatment; dG, days of gestation.
*Denotes a significant difference between control and treatment group, P < 0.05.
Histogram representing (a) maternal plasma progesterone concentration and (b) maternal plasma estradiol concentration. Saline control  , received one dose betamethasone
 , received two doses betamethasone
 , received three doses betamethasone
 . 1: one dose, 2: two doses, 3: three doses. dG, days of gestation. *Denotes a significant difference, P < 0.05.

Fetal and early postnatal: ACTH and cortisol
Although fetal plasma ACTH levels were similar between groups before birth, BET treatment significantly reduced levels at 6 weeks but not at 12 weeks of postnatal age. Maternal BET treatment reduced fetal plasma cortisol concentrations at 145 dG but not at any other time-point. In treatment and control animals there was a modest increase in the cortisol:ACTH ratio between 122 and 132 dG, then a marked increase in this ratio between 132 and 145 dG that persisted through until 12 weeks postnatal age, consistent with a sustained increase in fetal adrenal sensitivity to circulating ACTH. The magnitude of this cortisol:ACTH ratio increase was lower at 145 dG in the treatment animals, but that difference was lost by 6 weeks postnatal age (Table 7).
Fetal plasma ACTH, cortisol concentrations and ratio

ACTH, adrenocorticotropin; C, control; T, treatment; NT, non–treatment; dG, days of gestation; wks, postnatal age.
aRatio calculation is cortisol concentration to the logarithm of ACTH concentration.
*Denotes a significant difference between treatment and control group, P < 0.05.
Hypothalamic CRH, AVP, GR mRNA levels
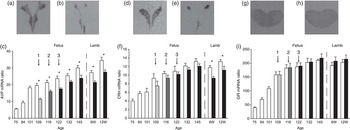
Levels of fetal hypothalamic AVP and CRH mRNA rose throughout pregnancy up to 145 dG and then from 6 to 12 weeks of postnatal age as reported previously.Reference Matthews and Challis33 One, two and three injections of maternal BET suppressed AVP mRNA levels at all time-point measures (Fig. 2a–2c); a response seen in both the magnocellular and parvocellular fields of the PVN. In marked contrast, none of the dosing regimens of maternal BET injection altered fetal hypothalamic CRH mRNA although CRH mRNA levels in the hypothalamus of postnatal lambs at 6 and 12 weeks of age were reduced in these BET-3 animals (Fig. 2d–2f). GR mRNA levels increased with advancing gestational age in both groups and levels were similar at all time-points before and after birth (Fig. 2g–2i).
Autoradiograms of hypothalamic sections after in situ hybridization using 35S-labelled oligonucleotide probe. AVP (a) control, (b) treatment at 6 weeks of postnatal age; CRH (d) control, (e) treatment at 6 weeks of postnatal age; GR (g) control, (h) treatment at 6 weeks of postnatal age. Representative graph of mRNA level (c) AVP, (f) CRH, (i) GR in hypothalamus exposed to prenatal maternal betamethasone injections. Saline control  , received one dose betamethasone
 , received two doses betamethasone
 , received three doses betamethasone
 . 1: one dose, 2: two doses, 3: three doses. AVP, arginine vasopressin; CRH, corticotrophin-releasing hormone; GR, glucocorticoid receptors. *Denotes a significant difference, P < 0.05.

Pituitary POMC, PC1, PC2, GR mRNA levels
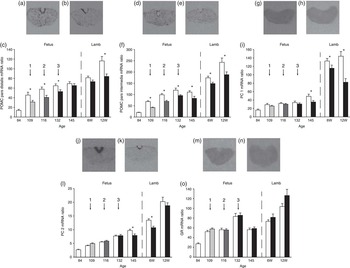
In both control and BET fetuses, POMC mRNA levels in the pars distalis and pars intermedia increased from 84 dG to 109 dG (P < 0.05), plateaued thereafter, and then rose in the lambs after birth. One, two and three injections of maternal BET suppressed POMC mRNA levels significantly in the pars distalis at 109, 116 and 132 dG then at 12 weeks of postnatal age (Fig. 3a–3c) and suppressed POMC mRNA levels in the pars intermedia at all time-point measures (Fig. 3d–3f). Levels of PC1 and PC2 mRNA were not altered in the BET-1 or BET-2 animals, but were significantly lower at 145 dG and in the postnatal period in BET-3 animals. Levels of pituitary PC1 and PC2 mRNA were higher in lambs at 6 and 12 weeks of age than in late gestation fetuses (Fig. 3g–3l). Pituitary GR mRNA levels were similar in control and BET exposed fetuses and postnatal lambs after one, two and three maternal treatments (Fig. 3m–3o).
Autoradiogram of pituitary sections after in situ hybridization using 35S-labelled oligonucleotide probe. POMC in pars distalis (a) control, (b) treatment at 132 dG; POMC in pars intermedia (d) control, (e) treatment at 132 dG; PC1 (g) control, (h) treatment at 6 weeks of postnatal age; PC2 (j) control, (k) treatment at 6 weeks of postnatal age; GR (m) control, (n) treatment at 132 dG. Representative graph of mRNA level (c) POMC in pars distalis, (f) POMC in pars intermedia, (i) PC1 and (l) PC2, (o) GR in pituitary exposed to prenatal maternal betamethasone injections. Saline control  , received one dose betamethasone
 , received two doses betamethasone
 , received three doses betamethasone
 . 1: one dose, 2: two doses, 3: three doses. POMC, proopiomelanocortin; PC, prohormone convertase; GR, glucocorticoid receptors; dG, days of gestation. *Denotes a significant difference, P < 0.05.

Adrenal ACTHr, StAR, P450c17, 3β HSD, 11β HSD2 and GR mRNA levels
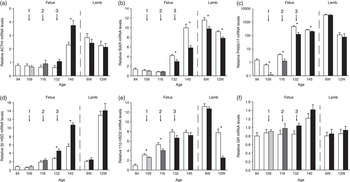
In general, control and BET fetuses showed low levels of adrenal ACTHr, StAR and 3β HSD mRNA at mid-gestation, but values rose dramatically after 132 dG and tended to remain higher in postnatal lambs (Fig. 4a, 4b and 4d). Levels of P450c17 mRNA decreased from 84 to 109 dG and then rose towards term (Fig. 4c), as reported previously.Reference Challis, Matthews, Gibb and Lye34, Reference Levidiotis, Wintour, McKinley and Oldfield35 These data are consistent with known increases in fetal adrenal responses and increased cortisol output with the approach of term gestation in the sheep. Responses to BET could be partitioned into three groups. Levels of ACTHr mRNA and 3β HSD mRNA were increased after BET, particularly at 145 dG (Fig. 4a and 4d). In contrast, StAR and P450C17 were reduced after BET; for P450c17 this effect was seen even in BET-1 animals at 109 dG (Fig. 4b and 4c). 11β HSD2 was also reduced, but only in BET-1 and BET-2 animals (Fig. 4e), and there were no significant changes in mRNA for GR after any regimen of BET treatment (Fig. 4f).
Histogram representing relative (a) ACTHr, (b) StAR, (c) P450c17 (logarithmic scale), (d) 3β HSD, (e) 11β HSD2, (f) GR mRNA levels in adrenal gland exposed to prenatal maternal betamethasone injections. Saline control  , received one dose betamethasone
 , received two doses betamethasone
 , received three doses betamethasone
 . 1: one dose, 2: two doses, 3: three doses. ACTHr, adrenocorticotropin receptor; StAR, steroidogenic acute regulatory; GR, glucocorticoid receptors. *Denotes a significant difference, P < 0.05.

Discussion
It is well established that the HPA axis of the fetal sheep undergoes maturational changes in late gestation. This results in increased systemic concentrations of both ACTH and cortisol in fetal plasma, increased expression of critical genes associated with enhanced activity of the HPA axis and dampened negative feedback responses, partly due to altered expression of GR across the HPA axis and partly due to increased peripheral capacity to bind circulating cortisol by CBG.Reference Berdusco, Hammond and Jacobs36 In fetal life, hepatic CBG gene expression is upregulated by cortisol administration.Reference Berdusco, Milne and Challis37 Our results in control animals of the present study are consistent with previous reports, but provide additional new information. The general similarity between gene expression changes in control animals of the present study with published reportsReference Sloboda, Moss and Li10, Reference Sloboda, Moss and Li22 provides a measure of validation for the techniques that we have used. The changes in plasma ACTH and cortisol into the newborn period provides new information suggesting that the increased sensitivity of the fetal adrenal persists into the newborn period, at least up to 12 weeks age. It is clear that this is associated with levels of expression of key steroidogenic enzymes that are much higher than during fetal life. In the human fetus, maternal GC treatment for conditions such as asthma upregulates placental 11β HSD2, allowing autonomous maturation of fetal and then neonatal HPA axis function, but preferentially in female newborns.Reference Clifton38 In the present study we have not sought sex differences in adrenal function. However, previously we showed that early pregnancy administration of synthetic GC increases adrenal activity in late gestation, in both male and female sheep fetuses. In female fetuses, the enhanced responsiveness was associated with increased P450C17 and 3β HSD expression, whereas the mechanism in the male proceeds through a different and currently unknown pathway.Reference Braun, Li and Sloboda39 A study of the effect of intrafetal cortisol administration between 109 and 116 dG, designed to precede the normal prepartum cortisol surge, resulted in suppression of adrenal 11β HSD2 but was not sufficient to enhance adrenal growth or alter steroidogenic gene expression.Reference Ross, McMillen, Adams and Coulter40 The effect in sheep of periconceptional undernutrition in early pregnancy was studied in singles and twins by MacLaughlin et al. An earlier prepartum activation of the pituitary–adrenal axis was observed in twins when compared with singles and this difference arose in early gestation. In twins, fetal adrenal weights, adrenal IGF-I, IGF-I receptor, IGF-II, IGF-II receptor and P450c17 mRNA levels were lower when compared with singleton fetuses.Reference MacLaughlin, Walker and Kleemann41
There are clearly reservations in interpretation of the current results. We have measured changes in steady-state levels of mRNA and the results do not give information about turnover rates and are in part semi-quantitative. We have assumed that changes in mRNA predict, at least in part, altered protein levels. Published data from our laboratory and others on control animals during the course of gestation support that general thesis,Reference Matthews, Han, Lu and Challis42–Reference Matthews and Challis44 but we have not measured post-translational protein products. Further, we do not have measurements of BET levels in the fetal circulation after maternal administration. This synthetic GC is a relatively poor substrate for the placental 11β HSD steroid metabolizing systemReference Seckl, Cleasby and Nyirenda45 and we have interpreted our data on the assumption of BET crossing the placenta to act on the fetal HPA. Of course, other placental hormones will be altered by this treatment. We have reported previously that placental lactogen is massively downregulated after maternal GCs in late pregnancy, placental weight is lowered and there is histological loss of binucleate cells that is indicative of actions on other hormones and metabolites.Reference Braun, Li and Moss46 Hence, it would be naive to suggest that all the effects seen on the fetal HPA axis are entirely attributable to the injected BET.
Administration of maternal BET decreased fetal and newborn weight, as we and others have reported previously in animal and in human studies.Reference Ikegami, Jobe and Newnham3, Reference Moss, Sloboda and Gurrin4, Reference Newnham8, Reference Newnham, Moss, Nitsos and Sloboda47 Although there were negligible changes in maternal ACTH, there was a clear lowering of maternal cortisol, particularly in late gestation. Maternal progesterone concentrations were reduced transiently after successive BET injections, consistent with effects on placental steroidogenesis.Reference Challis, Matthews, Gibb and Lye34 The amounts of BET given in this study may not have been sufficient to sustain upregulation of placental C17 hydroxylase; hence, there were no significant differences in maternal estrogen values between the control and treatment animals. However, pregnancy was prolonged significantly in BET treated animals, an outcome that is consistent with the lowered fetal plasma cortisol concentrations of animals in the BET-3 group at day 145 and thereafter. Fetal ACTH values were not altered significantly, which may imply direct effects of the BET on fetal adrenal function as we have reported for treatments earlier in pregnancy.Reference Braun, Li and Sloboda39
Despite the potential limitations raised earlier, we found consistent effects of exogenous BET on critical genes in the fetal HPA axis. At the level of the hypothalamus, AVP expression was markedly suppressed, but CRH was not. In fetal life, both of these neuropeptides can drive HPA axis activity.Reference Matthews and Challis33, Reference Matthews and Challis48 The present results suggest that there is differential sensitivity to feedback on these neuropeptides after exogenous GC, and the response persists well into the neonatal period in lambs at 12 weeks of age. The newborn animal requires AVP for physiologic responses other than HPA axis regulation and this new observation might herald concern, if the suppression were sustained for longer periods of time. The finding that levels of POMC in both pars distalis and pars intermedia were reduced in the BET treated animals is of interest and surprising. Regulation of POMC in the pars intermedia has generally been considered to be independent of GC negative feedback,Reference Matthews and Challis44 there are relatively few GR in this pituitary region, and the pattern is unchanged after BET treatment. We have reported upregulation of POMC in the pars intermedia of fetal sheep in other paradigms, for example after periconceptional undernutrition,Reference Bloomfield, Oliver and Hawkins26 a circumstance associated with increases in fetal plasma ACTH and cortisol and increased incidence of preterm birth,Reference Bloomfield, Oliver and Hawkins49 and have inferred that the interaction with exogenous GC must be at a higher level perhaps of dopaminergic regulation.Reference Matthews, Yang and Challis50 In the pars distalis, POMC mRNA was lowered after BET treatment, consistent with negative feedback through GR, and lack of inactivation of the synthetic GC by binding to CBG. The response was rather transient, and only observed in tissue samples collected within 4 days of BET administration. We did not find changes in circulating ACTH that reflected these modest changes in pituitary POMC mRNA, and perhaps that is not surprising. We did find that mRNA for PC1 and PC2 enzymes in the pituitary was reduced in fetuses at day 145, in newborns at 6 weeks, and for PC1, also at 12 weeks of age. It is possible that the same level of fetal circulating ACTH is achieved by altered rates of POMC processing by PC enzymes, but our studies were not designed to measure this possibility. Nor did we measure other peptides, potentially cleaved from POMC, with synergistic or antagonistic actions on the fetal adrenal; aspects that were beyond the scope of the present investigation.Reference Jones and Roebuck51, Reference Rousseau, Kauser and Pritchard52
Our results do not allow us to determine whether any effects on mRNA levels of fetal adrenal enzymes are attributable to exogenous BET, to relatively unaltered fetal ACTH or to changes in other hormones in the fetus, not measured here, that might have occurred in response to the administered GC. Basically we saw three different patterns of change in the fetal adrenal. Expression of ACTH receptor and of 3β HSD were increased at 145 dG in BET treated animals. At full term, these genes are also upregulated and appear positively responsive to GC treatment. In contrast, P450C17 and StAR were downregulated in BET treated animals. These genes are known to be responsive to ACTH stimulation;Reference Rainey, Carr, Wang and Parker53, Reference Mansfield, Carr and Faye-Petersen54 the present study raises the possibility that these genes may also respond to BET. One might conjecture that the upregulation of ACTH receptor and 3β HSD is offset by the downregulation of P450C17 and StAR, to explain the relative similarities in plasma cortisol between BET and control animals, at least until 145 dG when fetal cortisol concentrations are lower after BET, but the information at hand does not allow that conclusion other than as speculation. It is perhaps important that despite changes in mRNA levels for critical fetal adrenal genes in very late pregnancy, these effects have disappeared by 6 weeks of age, other than for StAR protein. Moritz et al.Reference Moritz, Butkus and Hantzis55 studied the short- and long-term effects of prolonged low dose dexamethasone infusion to the pregnant ewe from 25 to 45 dG. Examination at 45 dG showed reduced fetal adrenal weights and adrenal mRNA for P450scc. At 130 dG, when compared with controls, the fetuses were growth restricted, adrenal weights were similar and hippocampal expression of mineralocorticoid receptor (MR) and GR were decreased. By 2 months of postnatal age, there were no persisting differences in body weights, blood pressure or hippocampal MR or GR mRNA levels.
The present study shows that different regimens of BET administration to maternal sheep in late gestation affects expression of some key genes within the developing HPA axis, lowers cortisol in the fetus and produces a modest extension of the length of pregnancy. Some of the responses are transient, whereas others persist, at least to 12 weeks of age, and may be of importance in relation to early postnatal physiology. We have also reported that synthetic GC given early in gestation affects the activity of this axis and fetal adrenal expression of key steroidogenic enzymes.Reference Braun, Li and Sloboda39 We do not know the extent to which these results can be extrapolated to the human. However, they do continue to raise awareness of the potent and potential long-term effects of GC, changes in which must be taken into consideration in understanding the physiology of pregnancy and the development of the fetus and health after birth.
Acknowledgments
We thank Adrian Jonker, Amanda Meyer, Jennifer Henderson, Naeem Samnakay and Alana Mason for assistance in animal handling, injection and tissue collection and Margaret Blackberry for her assistance with the radioimmunoassay. Funding: This work was supported by the National Health and Medical Research Council of Australia (Grants 254502, 303261); the Canadian Institutes for Health Research Group in Fetal and Neonatal Health and Development; the Raine Medical Research Foundation of Western Australia; and the Women and Infants Research Foundation, WA, Australia.