INTRODUCTION
The radiocarbon laboratory in Trondheim has a long history starting in the 1950s with the construction of gas proportional counters (GPC) (Nydal Reference Nydal1959; Nydal Reference Nydal1962). Throughout the years, the laboratory has been active in many research fields such as atmospheric research (Nydal Reference Nydal1968), oceanography (Nydal et al. Reference Nydal, Gislefoss, Skjelvan, Skogseth, Jull and Donahue1992), and archaeology (Nordeide and Gulliksen Reference Nordeide and Gulliksen2007). With more sensitive measurement techniques requiring much less sample material becoming available, an accelerator mass spectrometer (AMS) was commissioned and officially accepted in May 2009 (Nadeau et al. Reference Nadeau, Vaernes, Svarva, Larsen, Gulliksen, Klein and Mous2015). Since then, the sample preparation protocols and systems were upgraded to match the increased sample throughput of the new system.
The most important requirement was the need for graphitization systems to convert CO2 samples into graphite. This included systems for handling samples in mg instead of g scale and also an increased sample throughput. Here, we present the status of ongoing development and optimization processes to fit the new needs. This covers the data handling within the laboratory as well as processes for chemical sample cleaning, reduction of CO2 to graphite, target pressing, 14C measurement, and data evaluation.
DATABASE
When processing large numbers of samples, the flow of information in the laboratory is of key importance to track the samples throughout the treatment and measurement. A relational database provides a powerful tool to collect and distribute information in many ways, including both manual handling as well as automated communication with instruments. Our database is constructed in two layers. The tables, presently included in a Microsoft Access file, could also be a hosted by a database server and accessed via ODBC (open database connectivity) or other communication protocols. Control programs constitute the second layer of the structure. These allow either the manual data entries or automatically write process data, e.g. from the reduction system, to be uploaded to the database.
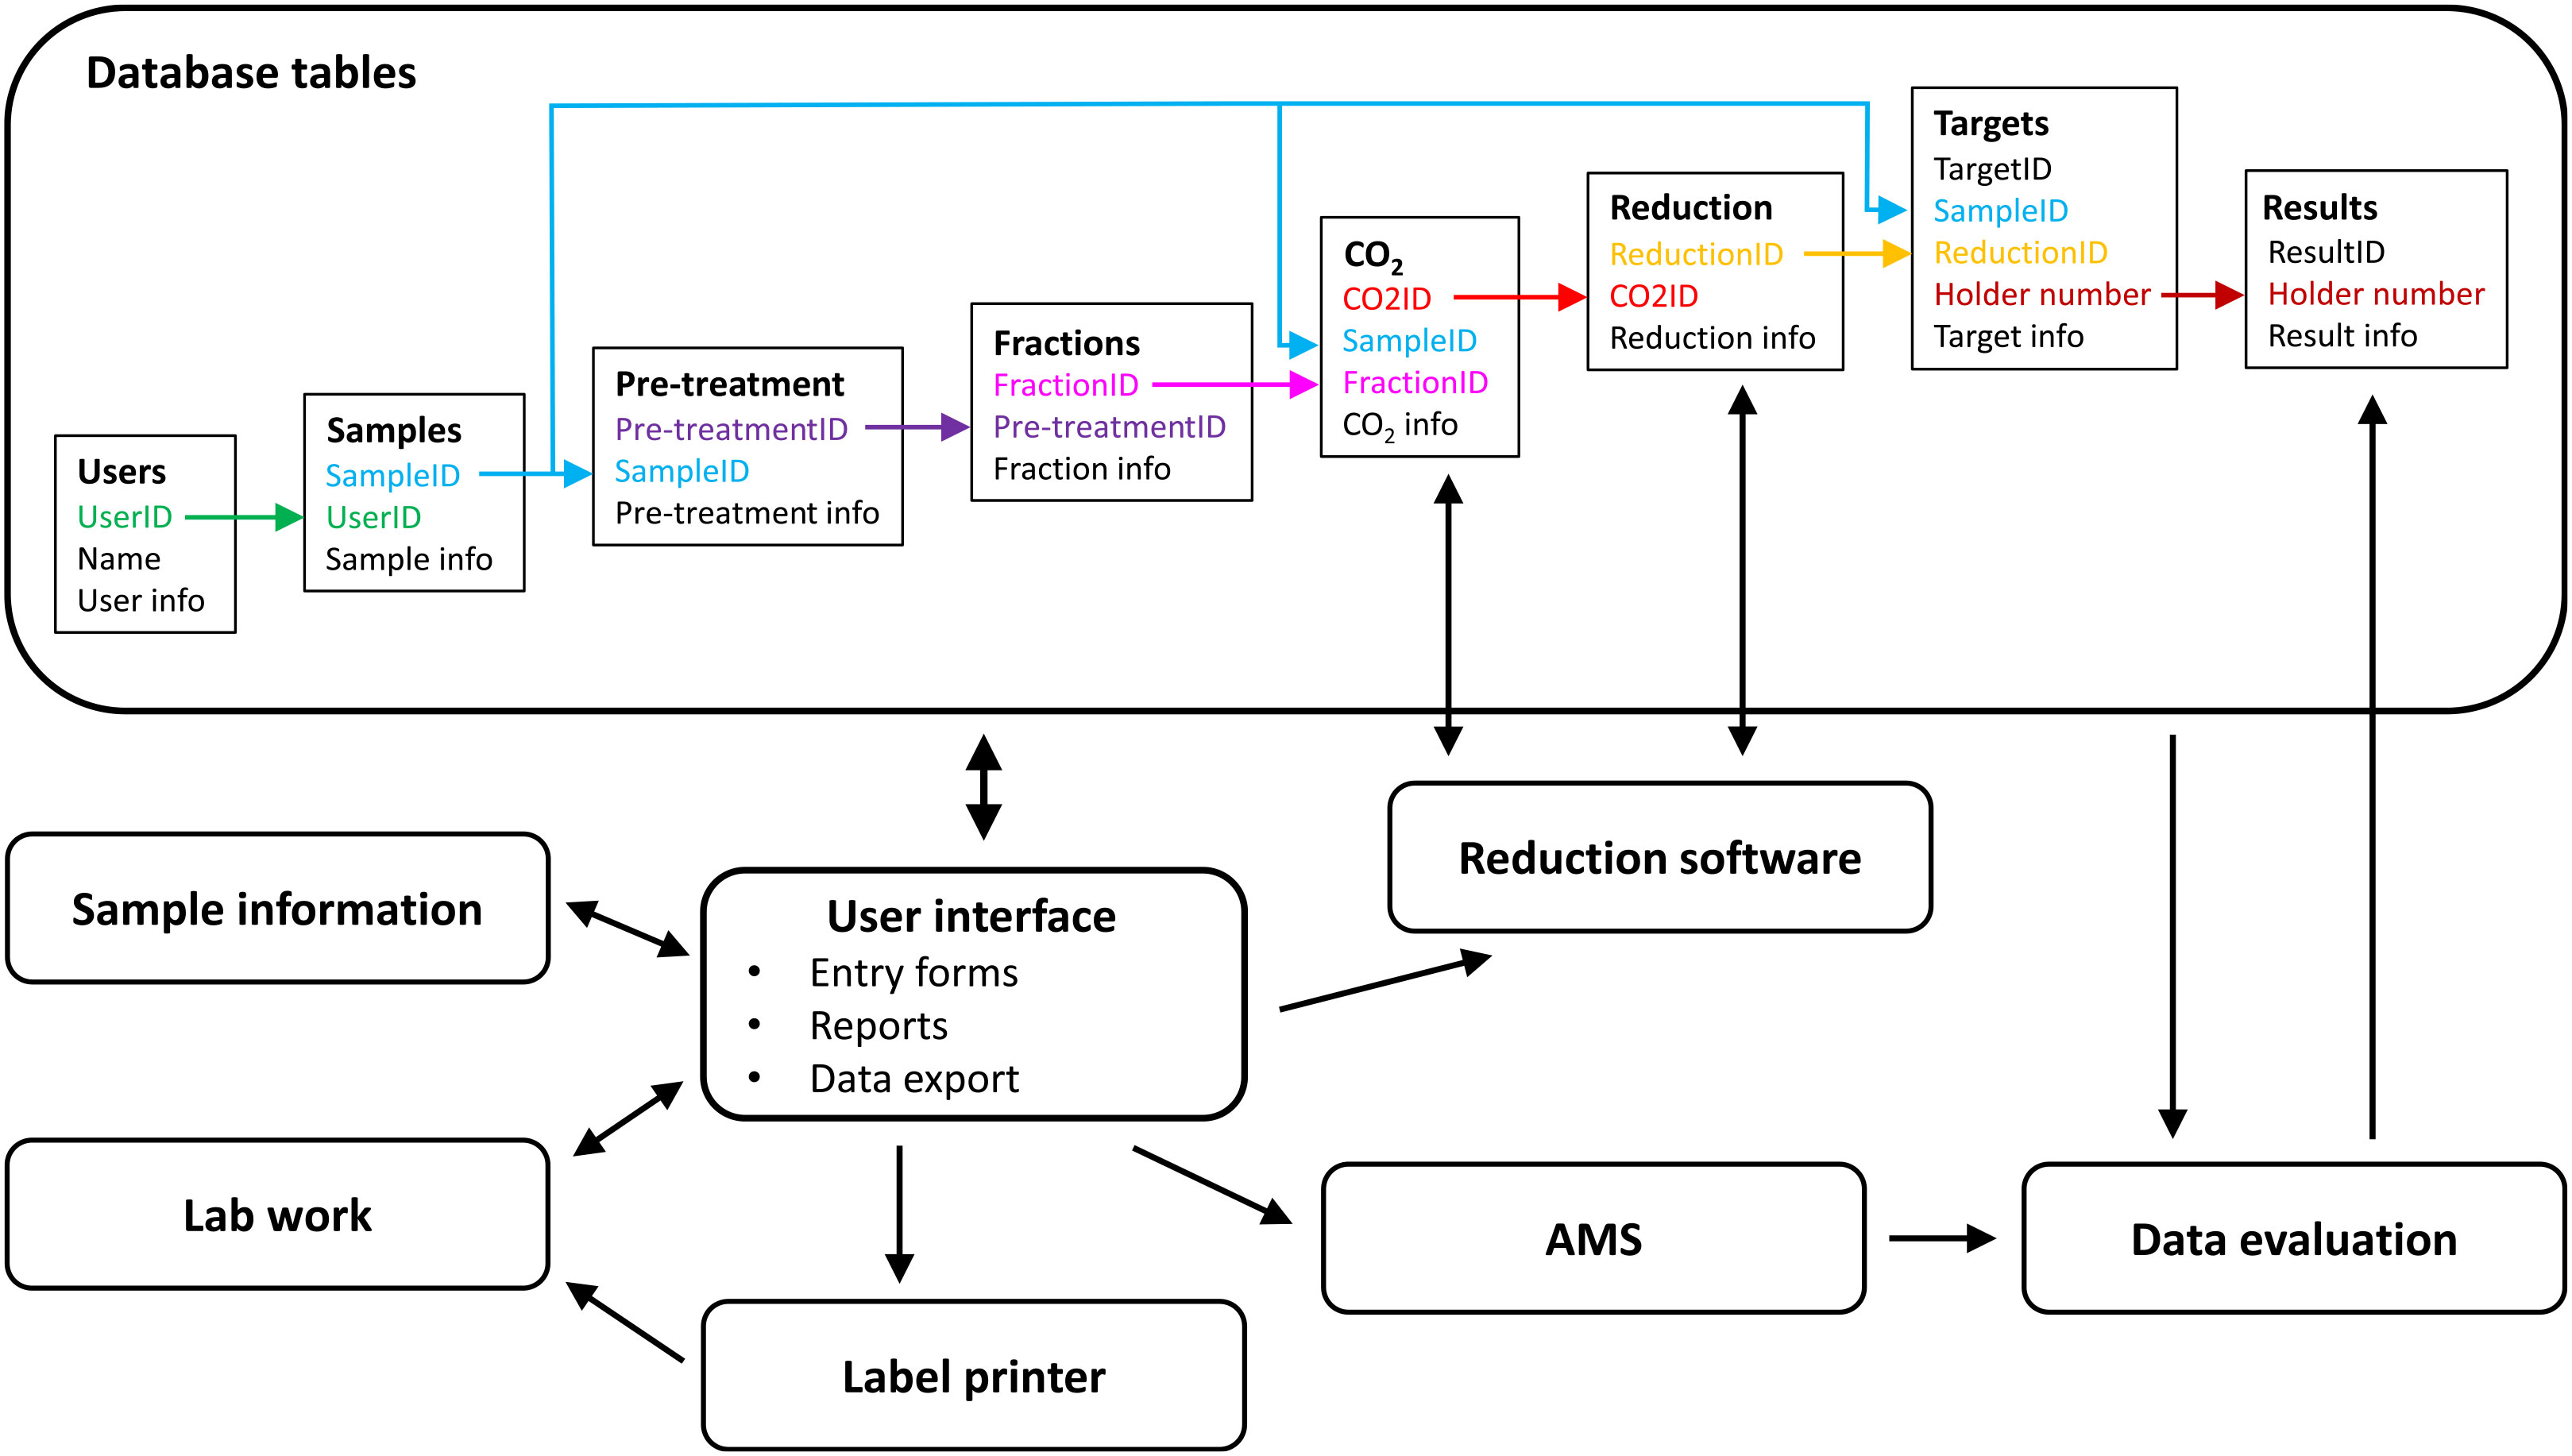
The database table structure reflects the processes to which a sample is subjected through the laboratory. There are tables for users, samples, pretreatments, resulting fractions, combustion (CO2), reduction, targets and results (Figure 1). The hierarchical structure of the tables (left to right in Figure 1) allows a one-to-many option at every step, e.g. several pretreatments for each sample. The data in the individual tables are linked by the key of the overlying table, e.g. CO2ID in the reduction table. The CO2 and target tables have direct links to the sample table that allows us to skip steps in the sample handling, e.g. no pretreatment for submitted CO2 samples.
Schematics of the database main tables and links. Minor tables, e.g. the operator table, which identifies the individuals working on samples in every step of the procedure, or the system table, which contains the reduction reactors, were omitted for better visibility.
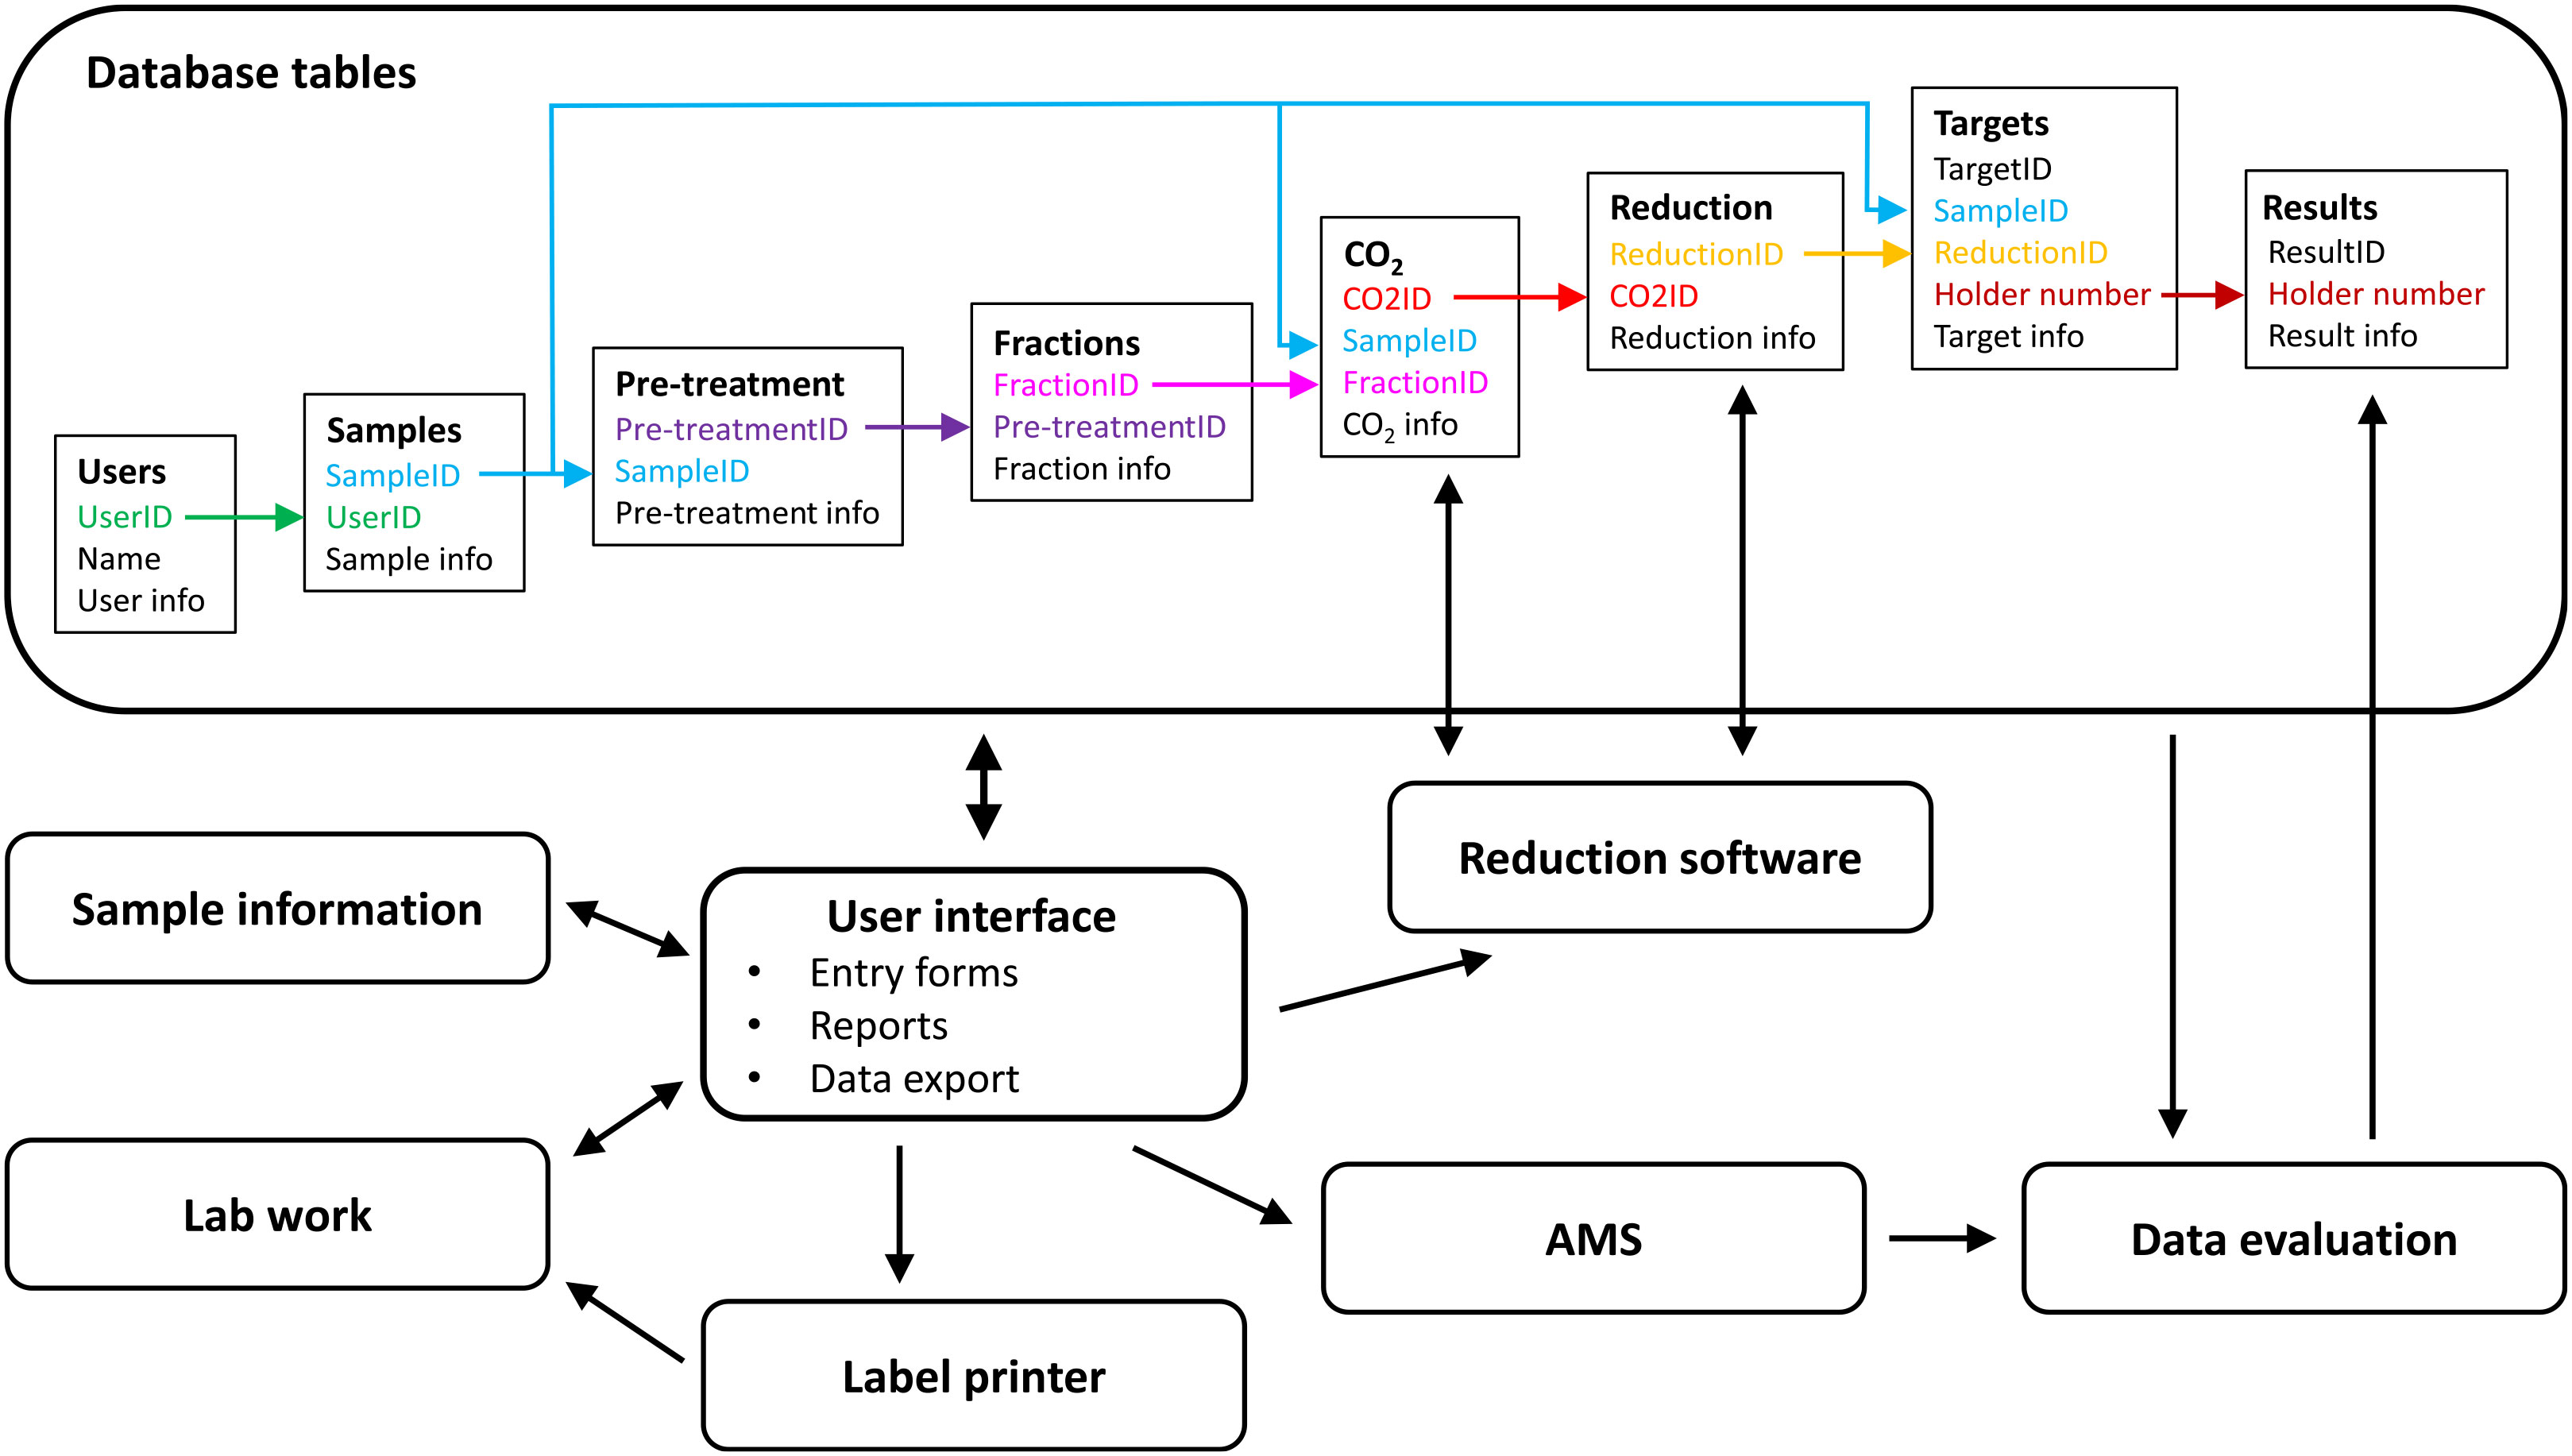
The table structure stays mainly hidden in the background during routine operation. The manual interaction occurs through a set of forms, queries and reports in a separate Access file. These are designed to handle processes such as sample registration, and documentation of the chemical sample pretreatment. A connected label printer allows fast printing of identification labels to keep track of the samples in the laboratory. The labels include barcodes, and future implementation of barcode readers is planned. It is also possible to export data to other systems, such as batch files for the AMS system, or to create result reports. Some programs, such as the control software of the reduction systems (see section Combustion and Reduction), automatically connect to the database to retrieve sample information and to upload process data, e.g. the carbon content of a sample from the elemental analyzer. The data-evaluation process uses a database connection to read sample information from the database, such as the sample material to apply the appropriate blank correction.
The information provided for all preparation steps is set so that it allows for the checking the data of the previous step. This is an important part of quality control, ensuring that samples are not exchanged during handling in the laboratory and that the results are finally assigned to the correct sample.
SAMPLE HANDLING
A sample submitted to our laboratory will first be registered under a TRa-number (TRa = Trondheim Radiocarbon AMS) to track the sample throughout the treatments in the laboratory. The cleaning procedures applied to a sample depend on the sample material, so the first step is always to identify which part or fraction of the sample should actually be dated. Charcoals from archaeological contexts such as cooking pits often consist of many pieces from various trees. We can identify short-lived species from such samples to get a better age constraint. After the selection process, the sample is chemically cleaned in the laboratory. The procedures are based on published methods, but have been slightly adapted to the needs of the laboratory.
All methods have been tested with known-age materials to verify their performance. However, the variety of samples cannot always be covered with known-age materials, so that some samples are pretreated multiple times. This is especially needed for conserved samples when it is unclear if the standard procedure will remove all of the contaminants. In such a case, the procedures may be slightly changed, e.g. more Soxhlet repetitions or different solvents, to address possible issues with it.
Acid-Alkali-Acid Preparation
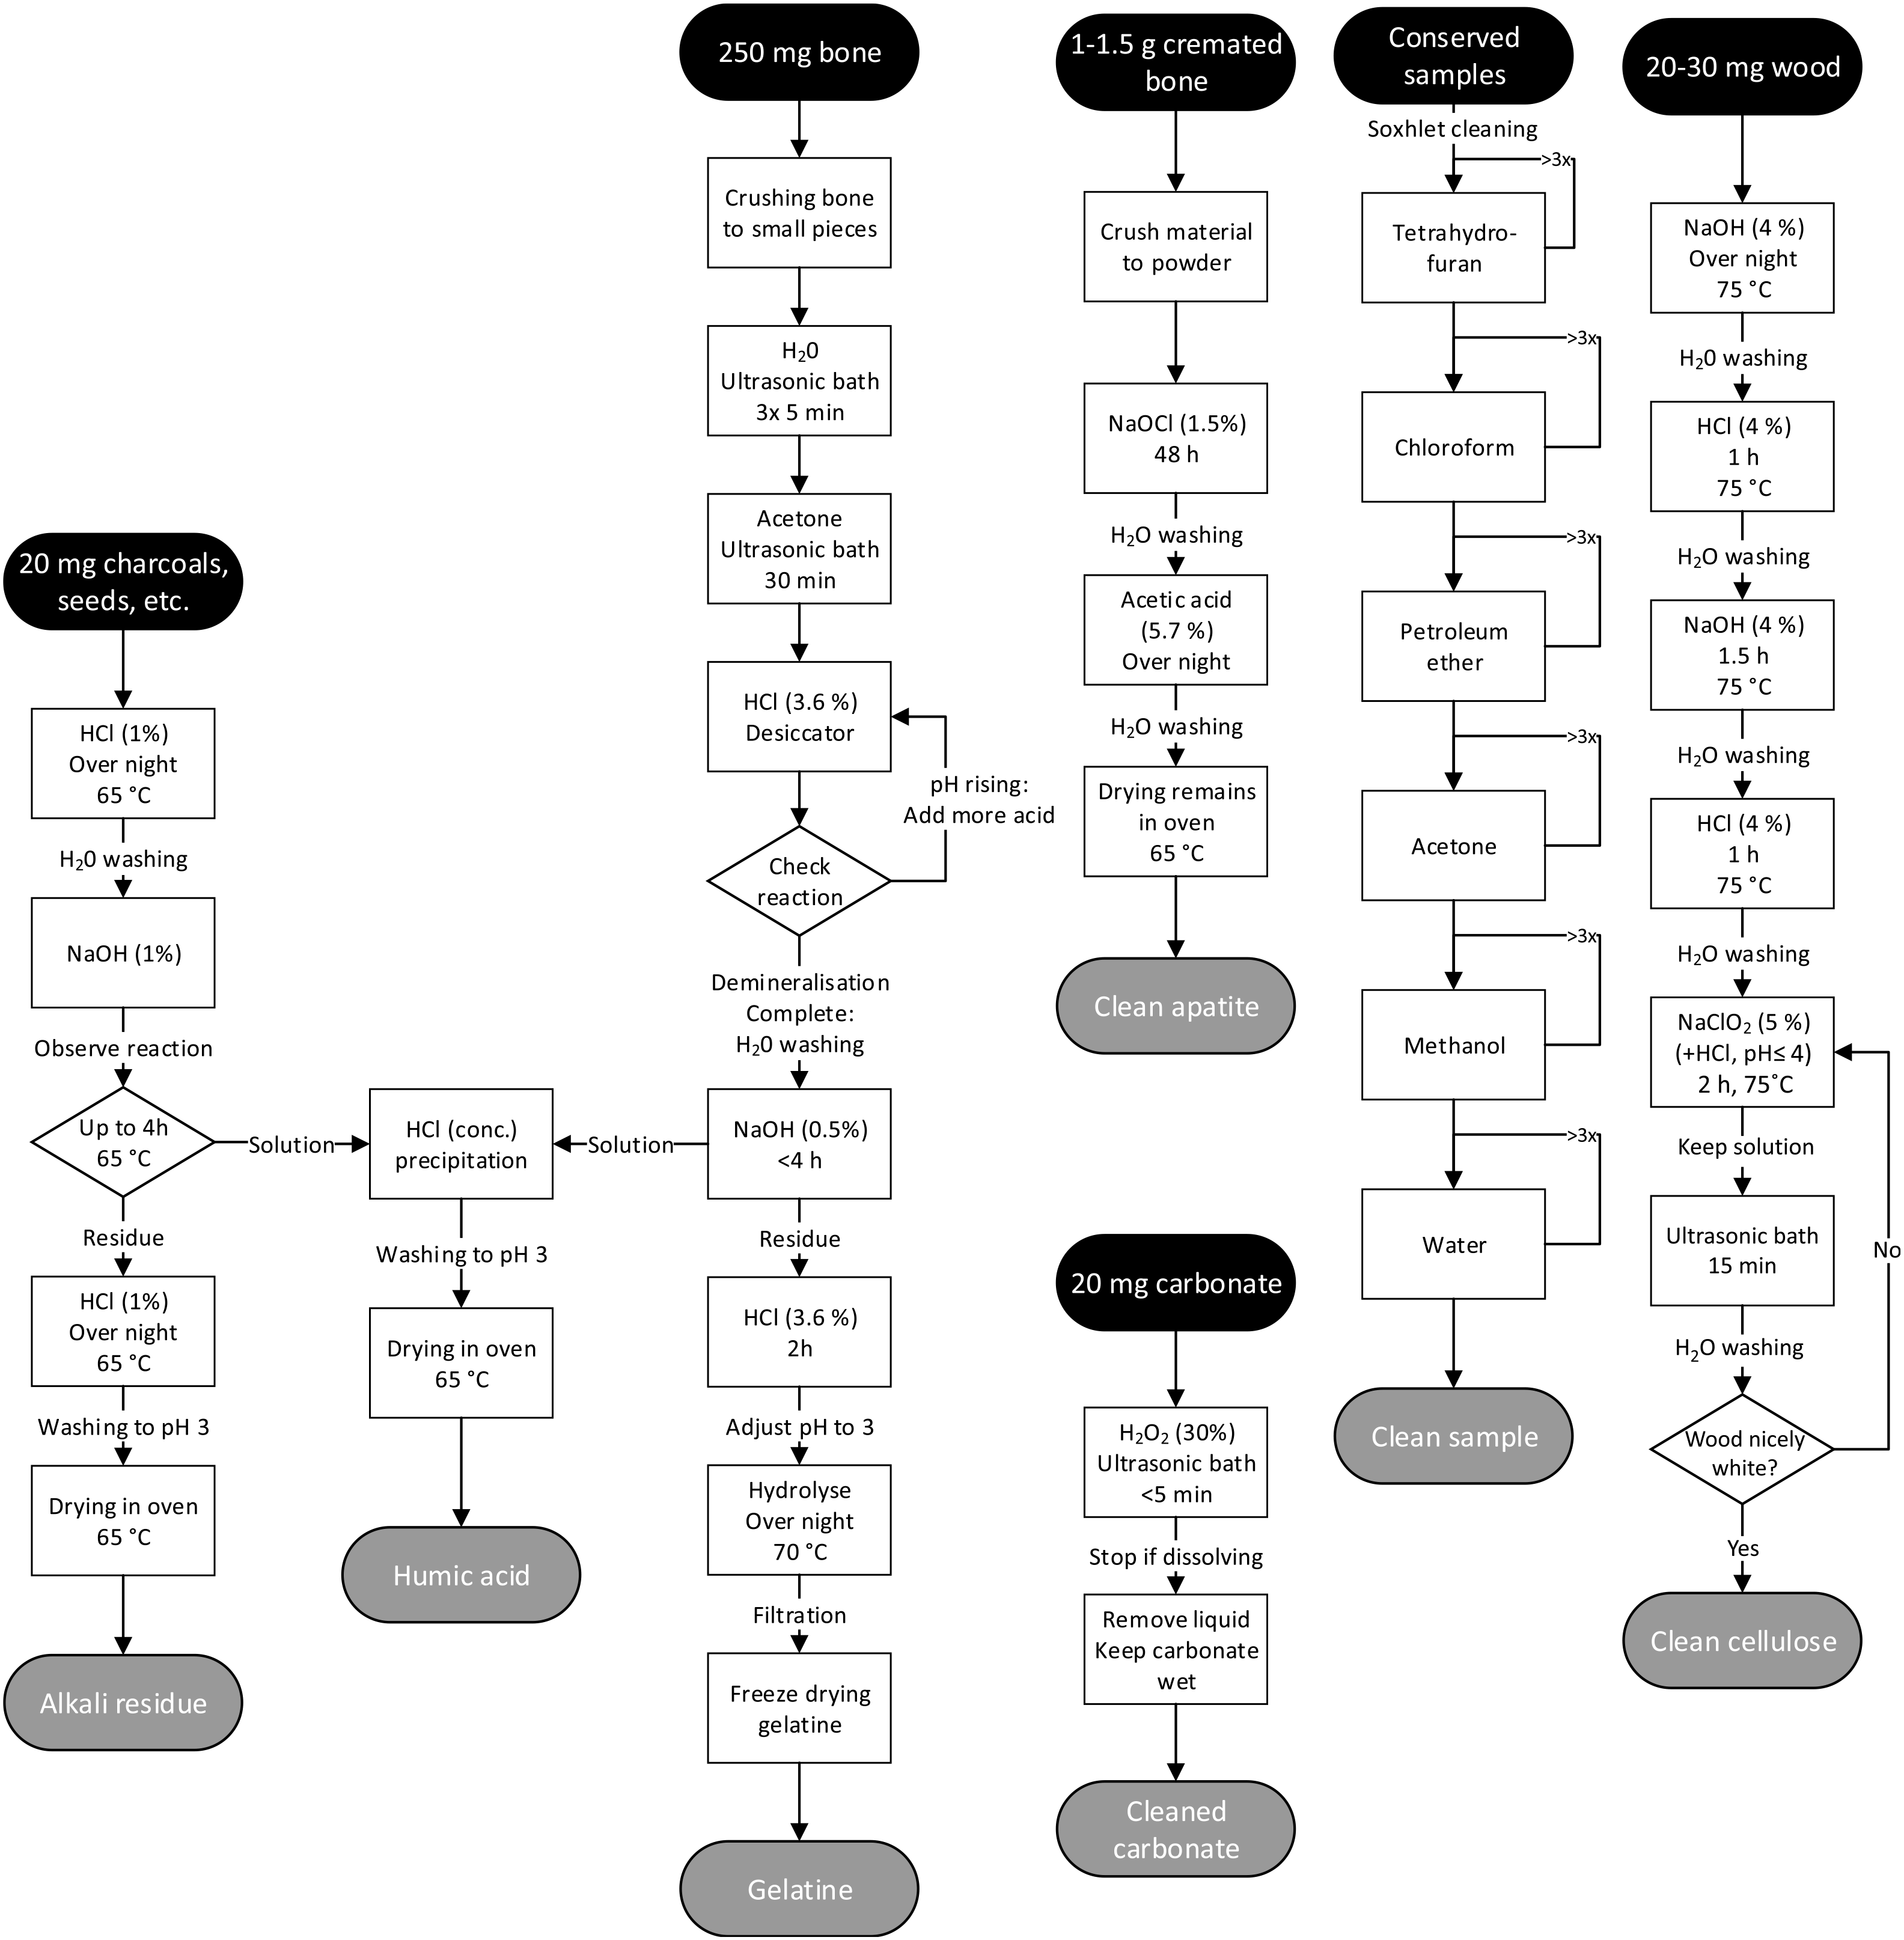
Most sample types, such as charcoals, seeds, plant remains, food residues, wood, hair, feathers and textiles undergo a traditional acid-alkali-acid (AAA) cleaning (de Vries and Barendsen Reference de Vries and Barendsen1954). The samples are first placed in 1% HCl over night to remove carbonates. This also removes acid-soluble organic compounds (“fulvic acid” fraction). After washing with deionized H2O until pH > 4, a 1% NaOH solution is added to dissolve alkali-soluble organic components, the so-called humic acids. The solution is separated from the residue by centrifugation and decanting. The residue is washed with deionized water until pH < 10, then acidified with 1% HCl to remove CO2 dissolved in NaOH, and washed again until pH > 3. This gives the alkali residue or “humin” fraction. The NaOH solution is acidified with concentrated HCl to pH < 1. This precipitates the alkali-soluble/acid-insoluble humic acid fraction that is then washed with deionized water until pH > 3. Both fractions are then dried in an oven at 60ºC. For most of the samples, the “humin” fraction is used for dating, while the humic acid fraction serves as backup material. Details of the process are shown in Figure 2.
Process flow of sample cleaning processes for different sample materials. The given amount of material for sample types might vary, e.g. depending on how degraded a sample is.

Base-Acid-Base-Acid-Bleach (BABAB) Preparation
For dating of single tree rings, e.g. for wiggle-matching, a cellulose extraction is performed following an adaptation of the BABAB (base-acid-base-acid-bleach) protocol (Nemec et al. Reference Nemec, Wacker, Hajdas and Gaggeler2010). First, the sample is treated with 4% NaOH which is followed by short steps of 4% HCl, 4% NaOH, and 4% HCl again at 75ºC. A bleaching step with a mixture of 5% NaClO2 and 4% HCl at 75ºC (pH ≤ 4) is done, with an ultrasonic bath at room temperature at the end. The last NaClO2 bleaching step is repeated until the sample material is white.
Bone Preparation
Collagen is extracted from materials such as bones or antlers using a modified Longin method (Longin Reference Longin1971). The samples are first crushed to small pieces to accelerate the later extraction process. The samples are cleaned in an ultrasonic bath with H2O and then acetone to remove fats. Following, the material is demineralized in 3.6% HCl at room temperature until pH remains <1. The sample is then washed with deionized H2O until pH > 3 and 0.5% NaOH is added for 4 hr at room temperature to dissolve humic acids. After washing until pH < 10, the residue is acidified again with 3.6% HCl to remove atmospheric CO2, washed until pH = 3 and hydrolyzed at 70ºC overnight. Finally, the gelatin is hot filtered though a pre-combusted quartz filter (Merck Millipore, AQFA04700) and freeze dried.
Calcined Bones and Carbonate Samples
Calcined bones are crushed to powder before the cleaning begins. Organic material is removed by reaction with 1.5% NaOCl for 48 hr at room temperature. Soluble carbonates are afterwards removed with 5.7% acetic acid and the sample is dried after washing with H2O (Lanting et al. Reference Lanting, Aerts-Bijma and van der Plicht2001).
Carbonate samples undergo a soft leaching with 30% H2O2 (instead of acid) to remove any organic surface coating and the top carbonate layer of the sample.
Organic Solvent Extraction
Samples that were conserved or are otherwise subject to significant hydrophobic pollutants are subjected to a Soxhlet type procedure with an elution sequence of solvents (Bruhn et al. Reference Bruhn, Duhr, Grootes, Mintrop and Nadeau2001), which can remove a large variety of contaminants. Yet it may not be successful in all cases. The samples are extracted (3 × 10 min each) in sequence in boiling tetrahydrofuran (THF), chloroform, petroleum ether, acetone, methanol, and water. The apparatus we use for this is a 4–fold Soxhlet type extractor “fexIKA 200” sold by LFH Laborfachhandel, Waldkirch, Germany. It is computer controlled and allows us to treat relatively small amounts of material.
COMBUSTION AND REDUCTION
When a sample has been cleaned and the datable material has been isolated, it is combusted and reduced to produce homogenous graphite for the AMS measurement. Two different reduction lines are used in Trondheim.
Trondheim Oxidation and Reduction System (TOR)
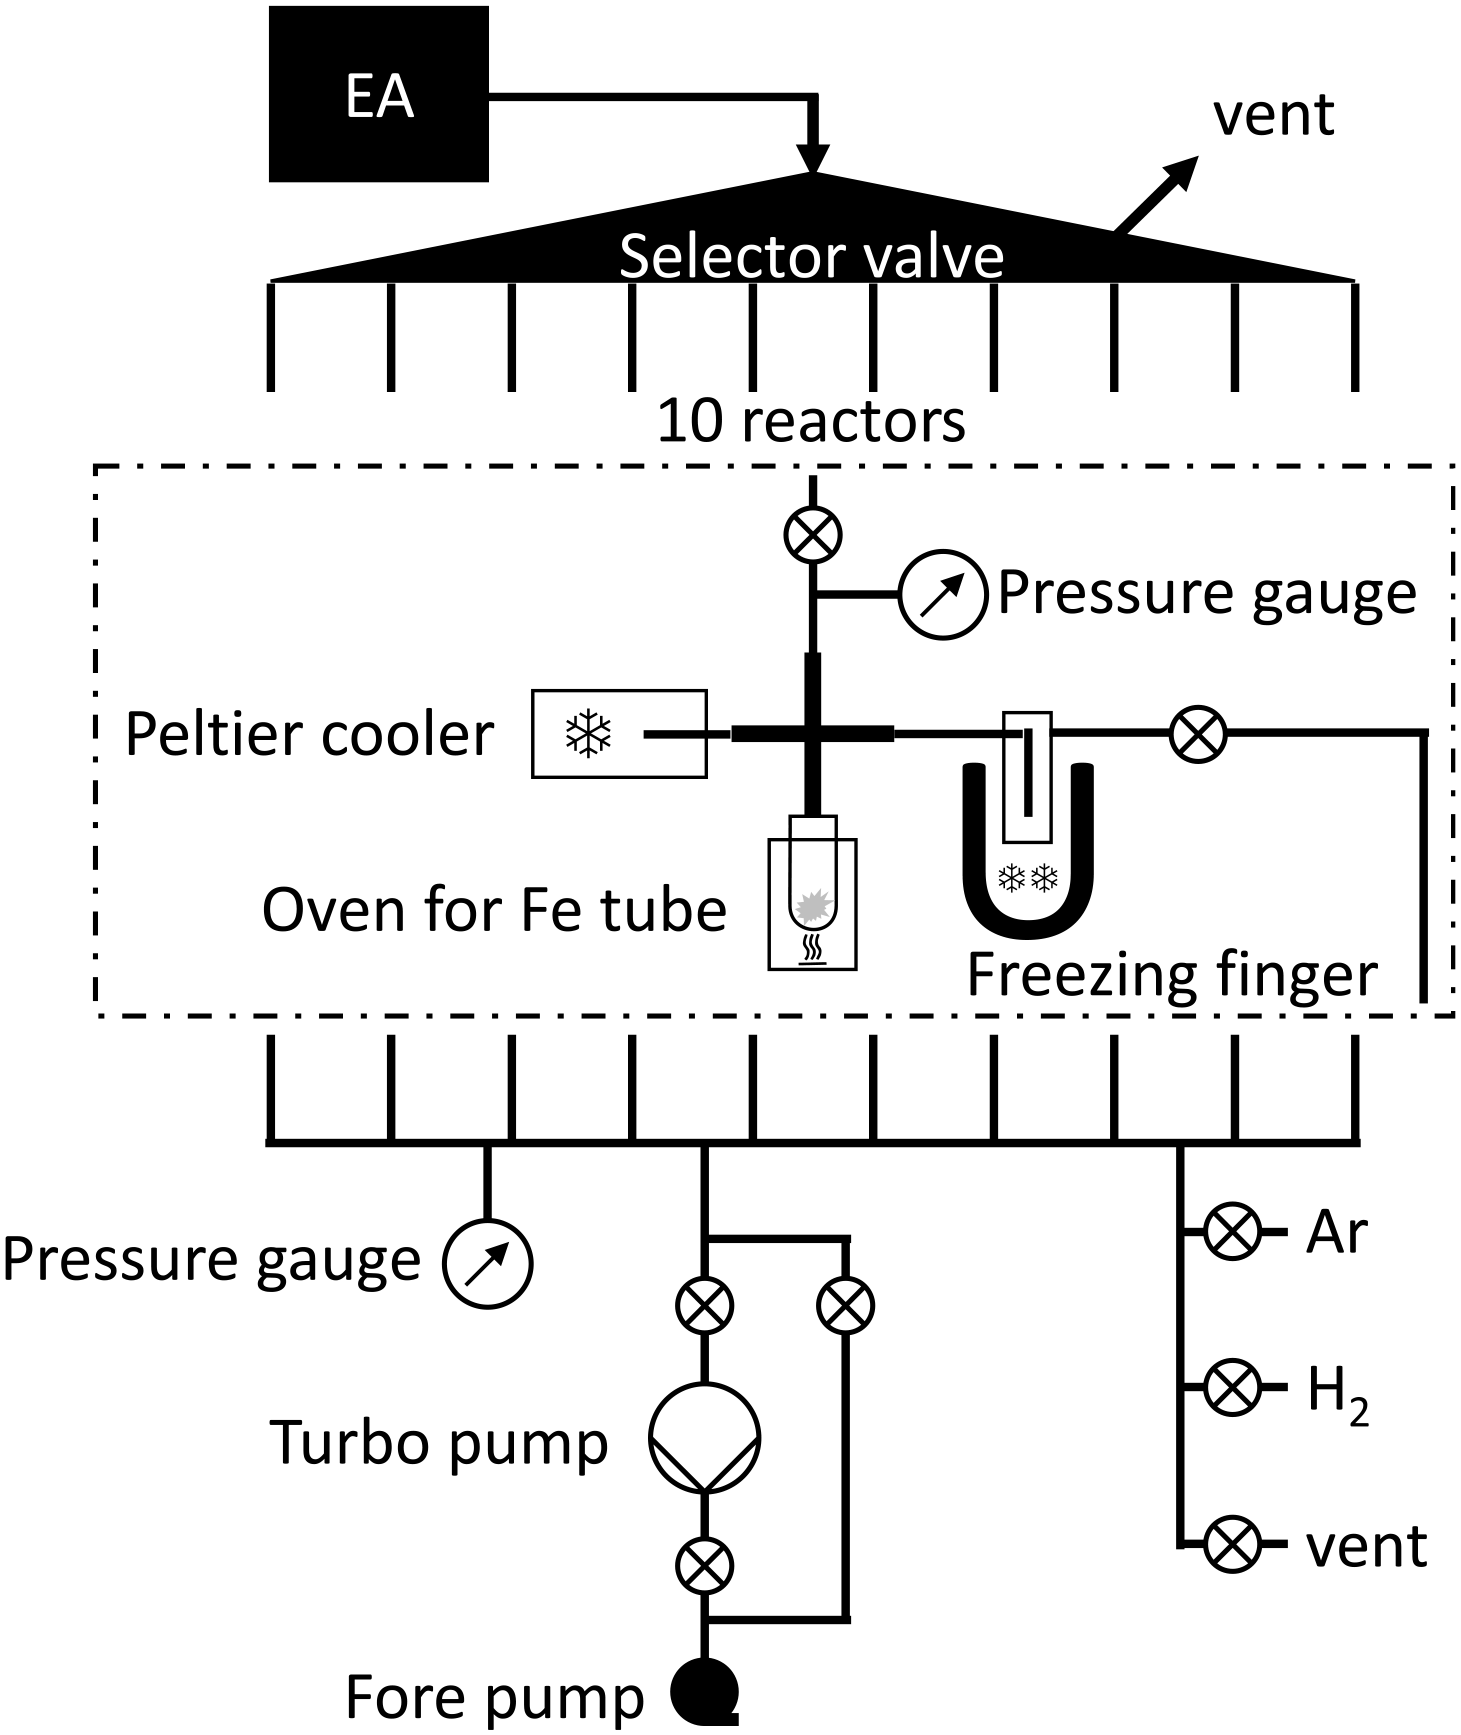
Most of the samples are reduced in the automated reduction system TOR (Trondheim Oxidation and Reduction-system). The system was originally built at the University of Erlangen (Ohneiser Reference Ohneiser2006). After the radiocarbon laboratory in Erlangen closed, the system was moved to Jena and finally installed in Trondheim. A new elemental analyzer (EA, Elementar microcube) suitable for samples smaller than 10 mg was coupled to it for sample combustion. A LabVIEW program (Elliott et al. Reference Elliott, Vijayakumar, Zink and Hansen2007) controls the hardware and the reduction process. The program was modified slightly to incorporate communication with the EA and our sample database. The hardware was mostly unchanged although some parts have been replaced to prevent ageing or to fix issues probably originating in transport and installation. The system performs the Fe-catalyzed hydrogen reduction of CO2 (Vogel et al. Reference Vogel, Southon, Nelson and Brown1984), freezing out the residual water with Peltier coolers similar to other automated reduction systems (Wacker et al. Reference Wacker, Nemec and Bourquin2010). Ten reactors are arranged in circular shape and are run in parallel. A selector valve sends the gas coming from the EA to one of the reactors (Figure 3). The reactors are isolated by two valves: the inlet connected to the selector valve and the outlet valve connected to the pumping system. A vertical freezing finger allows for freezing the CO2 gas with liquid nitrogen. A cross-piece is connecting to a tube in the Peltier cooler, which is cooled down to about –30ºC, as well as a removable reduction tube where the reduction oven is mounted manually, and a pressure transducer (Mouser Electronics, 1240-015A-3L).
Schematic of the TOR system.

Once the system has been readied by manually replacing the reduction tubes (Kimble, 6 × 50 mm, borosilicate glass) that have been prefilled with 3 mg Fe powder (VWR, 24088.232, ≥99.5% powder, reduced by hydrogen), mounting the ovens, and placing the samples in the EA wheel, the software controls the automated processes of Fe cleaning, sample combustion, and reduction. A manual mode can be used to accommodate special procedures. The Fe catalyst (for all reactors) is first cleaned by heating it to about 350ºC in hydrogen gas for 40 min after which the system is pumped and filled with Ar gas. Each sample is combusted in the EA, the sample CO2 is directed to the desired reactor by the selector valve and captured in reactors by freezing. Liquid nitrogen is filled in a Dewar and moved to the freezing finger of the reactor being prepared for reduction to freeze CO2 during sample loading and the addition of hydrogen. Once the CO2 peak from the EA has passed, the inlet is closed and the remaining He carrier gas is pumped. The loading procedure takes about 10 min per reactor. The CO2 pressure in the reactor is used to determine the sample size and adjust the amount of hydrogen that is needed to obtain a ∼10% hydrogen excess, while the CO2 is frozen again. We aim for 1.0–1.5 mgC, but samples down to 200 µgC have been reduced reliably, yet they show some fractionation, which can be dealt with using similarly sized standards. Once the hydrogen has been added, the Peltier coolers are activated followed by the ovens (550ºC) after a short delay. The program logs the pressure data of the reactors and checks the end pressure and rate of change in order to suggest the end of the reaction. A typical reduction takes about 4 hr, while larger samples may need more time. This procedure allows us to prepare two batches per day.
Fe-Zn Manual Reduction System
The other reduction system is a manually operated, in-house built system which uses a Zn-Fe reduction process (Jull et al. Reference Jull, Donahue, Hatheway, Linick and Toolin1986; Slota et al. Reference Slota, Jull, Linick and Toolin1987). The design of the system is based on the reduction system at Scottish Universities Environmental Research Centre (SUERC) (P. Naysmith, G. Cook, personal communication, March 4, 2013).
As this system does not include means to produce CO2, sample CO2 is prepared on separate systems. Challenging samples, such as liquids or sediments which require a large volume of material, are flame sealed in quartz tubes (diameter: 9 mm, length: 180 mm, made by Multi-lab Ltd, Newcastle upon Tyne, England) with 500 mg CuO pellets (VWR, Copper(II)oxide wire, 11005CK) and a piece (ca. 100 mg) of Ag foil (Alfa Aesar, 00501 silver foil) for combustion in a muffle oven running at 850ºC for 6 hr. Carbonate samples or calcined bones are hydrolyzed in borosilicate glass H-shaped tubes made of two Louwers glass valves (12-mm diameter). The samples are placed in one of the two interconnected tubes while 85% phosphoric acid is placed in the other. Both combustion quartz tubes and the carbonate H-tubes, are evacuated on a 19–port glass manifold (made by the university glassblower), which can be outfitted with various adapters to fit different tube diameters. The system is connected to an Edwards “T-station 75” pump station and has a custom-made cryogenic trap to protect the pump from acid released in the sample tubes.
Sample CO2 from both types of reactions is transferred to sealable glass tubes using a 6–fold dedicated system for multi-step cryogenic gas cleaning to remove water and non-condensable gases. This system allows for the partitioning of the gas as well as its distribution to multiple gas tubes for transfer to the reduction system. There are several types of glass tubes in use, with diameters of 6 or 9 mm and different types of O-ring sealed valves.
Each reduction cell is made of two 125 mm long tubes (6 mm diameter, borosilicate glass, manufactured by the university glass blower), which are connected to adjacent ports of a union cross (Swagelok, SS-4-UT-4) for both the Fe and Zn reagents. This construction ensures a good separation of both Fe and Zn reagents which is necessary for a complete reduction of the CO2 without fractionation. As for the automated system, we use 3 mg Fe (VWR, 24088.232, ≥99.5%) in addition to 70 mg Zn (Merck, <45 µm, 1.08789.0500). Seven of these reduction reactors are connected to a glass vacuum manifold by O-ring sealed glass valves.
Initially, the Fe and Zn reagents are cleaned by heating them to about 380ºC and 260ºC respectively while pumping. Gas-transfer vials are also connected to the reactors and the sample CO2 is transferred to the reactors by freezing with liquid nitrogen freezing. Two large ovens are moved to cover the reduction tubes during the reaction. The temperatures are set to 560ºC (Fe) and 430ºC (Zn) and the oven for tubes containing the Fe is applied 1 hr after the Zn oven. The temperature in the ovens is not perfectly homogenous and shows a decrease of about 10% towards the outer reactors. The graphitization process is quite slow and takes 10–15 hr so that the system can only be run once per day. While the system was originally planned for samples sizes of 1 mgC, it also performs well for samples down to 0.3 mgC, although this may require increased oven temperatures to start the reaction.
Target Pressing
Sample graphite is pressed into the target holders which have been laser engraved with a unique number (holder number) to identify the sample afterward. The target holder is fixed in a threaded tool with its front facing a ceramic ball (diameter: 5 mm, ZrO2/YPSZ) blocking one side of the graphite cavity (diameter: 1 mm). On the other side, a funnel is screwed into the target holder which facilitates the sample transfer into the cavity. Once the graphite has been transferred into the target holder, the graphite is manually pressed through the funnel for about 3 sec at a pressure of 5–6 bar. A Cu pin is added in back to seal the graphite cavity and the target is pressed again deforming the pin. Finished targets are stored in Eppendorf vials until they are measured.
MEASUREMENT
The 14C measurements are done at our 1 MV AMS system made by High Voltage Engineering Europa B.V. A detailed description of the system can be found in several publications (Klein et al. Reference Klein, Mous and Gottdang2006, Reference Klein, van Staveren, Mous and Gottdang2007; Nadeau et al. Reference Nadeau, Vaernes, Svarva, Larsen, Gulliksen, Klein and Mous2015) and only a short overview is given here. The main elements before the accelerator are the SO-110 Cs sputter source and a 90º magnet, including the capability to apply a voltage to the magnet chamber for “bouncing” between different masses. We usually operate the Cs ion source at about 40 µA 12C current. The source has a 50-position wheel. The terminal voltage is usually set to 1 MV for routine measurements, which provides an ion transmission of 49% in the 2+ charge state. Another 90º magnet is used for mass separation in the high-energy beam line of the machine. The stable isotopes are injected into off-axis Faraday cups for current measurement, which is used for normalization of the 14C signal. The 14C ions are injected into a 120º electrostatic analyzer, which provides an energy filter and redirects the ion beam into the gas ionization chamber where the single ions are identified by a two-anode energy spectrum.
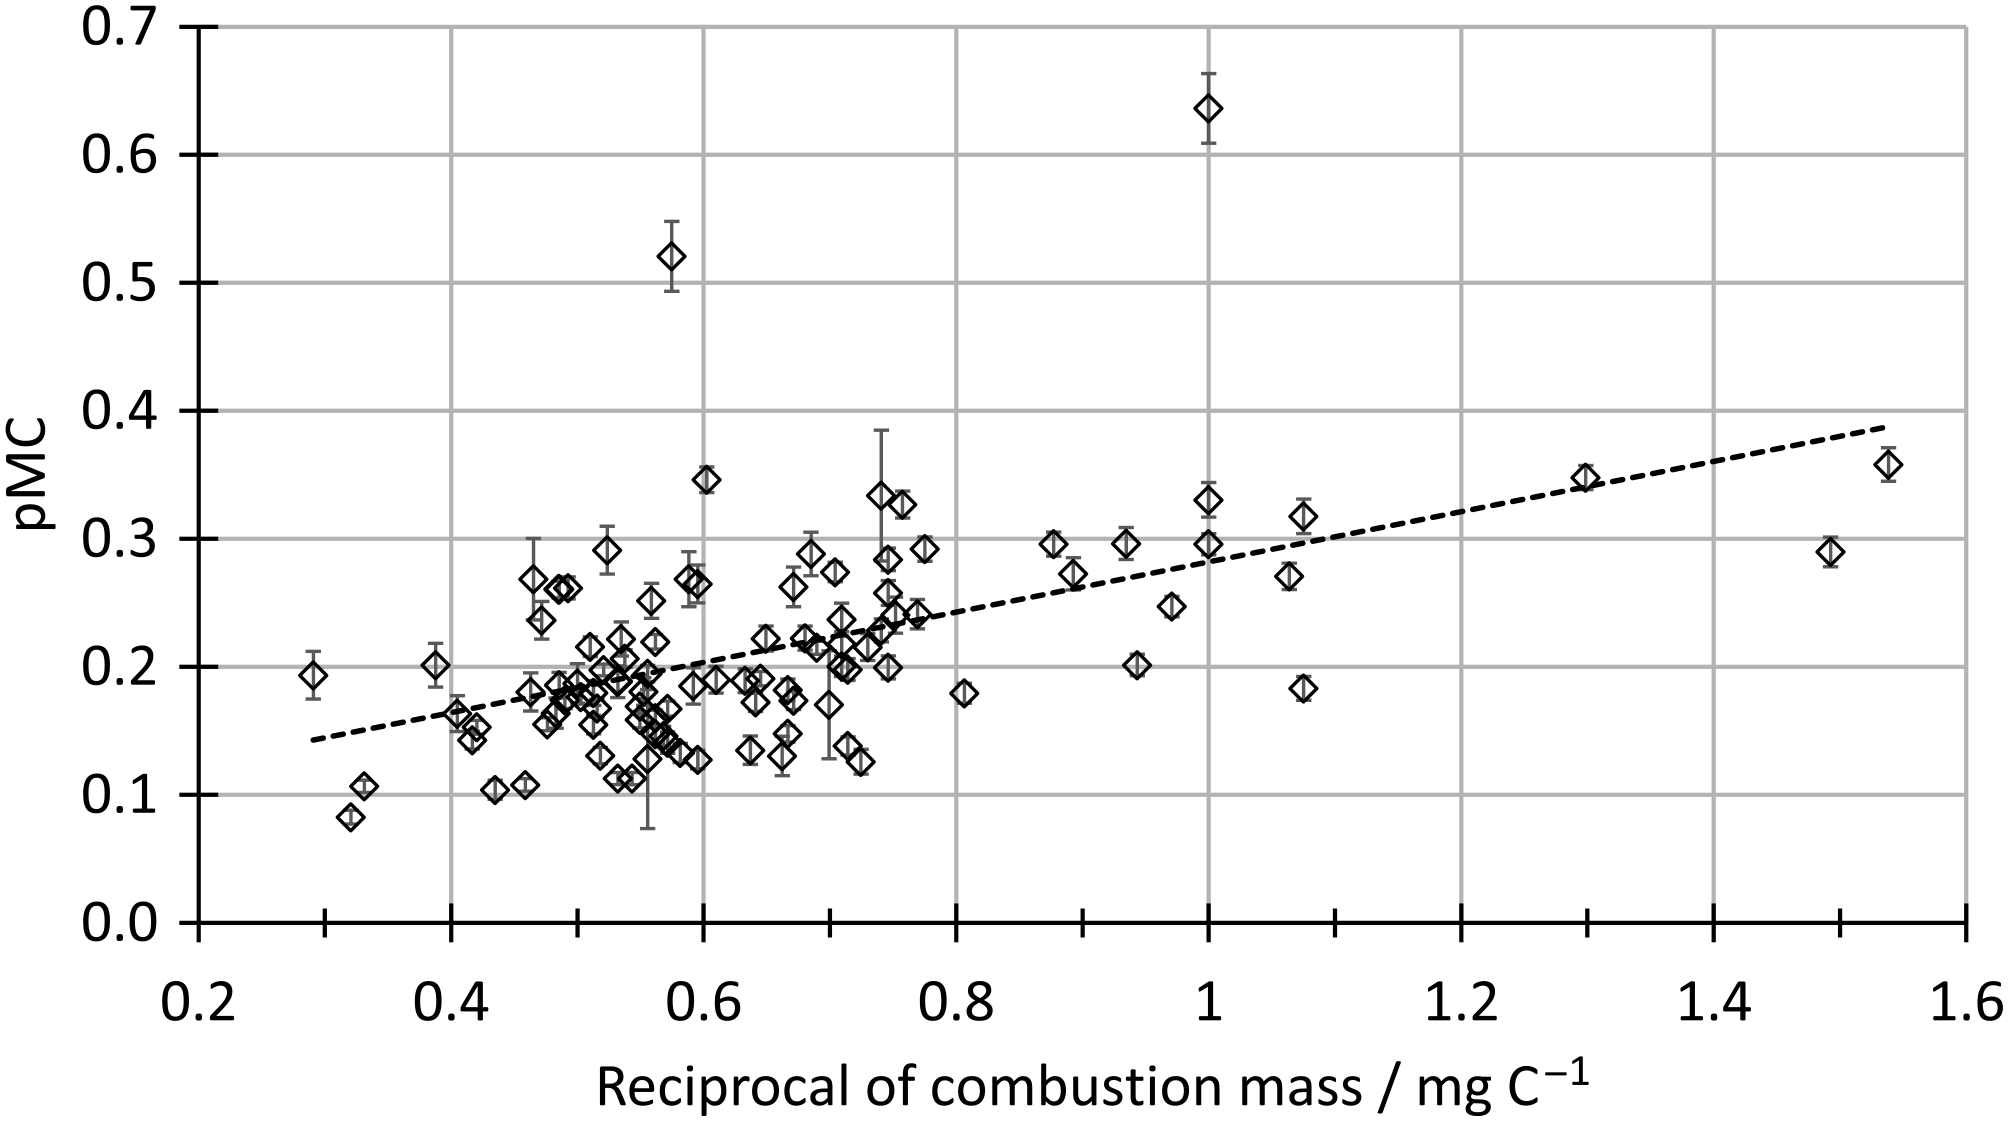
A typical sample wheel consists of 10 oxalic acids 2 (NIST SRM-4990c) reference samples (Mann Reference Mann1983), 5 secondary standards with different nominal values and 5 process and machine blanks. The remaining 30 positions of the wheel are filled with unknown samples. After an initial burn–in time of 5 min for every sample, all the samples are sequentially measured for 8 min. The sequence is repeated to achieve a measurement time of 80–90 min for each sample so that a pace of 2 wheels per week can be sustained. The recorded data is saved in separate measurement files for each measurement. The whole dataset is combined in an Excel spreadsheet, which is used for data evaluation. The data evaluation follows the general principles of radiocarbon dating (Mook and van der Plicht Reference Mook and van der Plicht1999). The first step in the evaluation is determination of the normalization ratios for 13C and 14C by using the reference samples. A current or time-dependent correction can be applied at this stage if needed. A background correction to the initial data is not done because the machine background, determined with unprocessed natural graphite (Alfa Aesar, graphite powder, natural, briquetting grade, –200 mesh, 99.9995% (metals basis)), is measured at a level corresponding to a radiocarbon age of >60 kA, which is significantly lower than the process blanks. The individual measurements of each sample are then normalized and fractionation-corrected to calculate the F14C value. The mean result is then corrected for a process blank depending on mass and material of the sample for the final result. The correction is scaled with the 14C content of the sample assuming the contaminating material is modern (Donahue et al. Reference Donahue, Linick and Jull1990). The size dependence of the blank is determined by a set of measurements with different sample size. For the AAA treatment, a piece of coal from Svalbard is used as test material. The blank material undergoes the same cleaning, combustion, and reduction steps as a regular sample and is regularly repeated. The 14C blank results show an inverse proportionality with the combustion mass (Figure 4) which is interpolated to estimate the blank correction (Schleicher et al. Reference Schleicher, Grootes, Nadeau and Schoon1998; Ruff et al. Reference Ruff, Fahrni, Gäggeler, Hajdas, Suter, Synal, Szidat and Wacker2010).
Size dependence of the process blank for AAA treatment with reduction at the automated reduction system.

The secondary standards are chosen to be similar to the unknown samples in size, material, and age. Most of the samples measured in our laboratory are charcoals, wood, and bones from archaeological sites with ages of about 2000 years. A sample well-suited for these conditions is sample H from the FIRI intercomparison (Scott Reference Scott2003). Since the laboratory was still running the GPC when the FIRI intercomparison was conducted, the amount of material supplied is enough for many AMS measurements. In 2017 and up to March 2018, the FIRI H sample has been measured a total of 90 times from 11 different pretreatments. The mean value of all measurements F14C = 0.75755 ± 0.00017 (radiocarbon age: 2230.5 ± 1.8 yr BP) is in good agreement with the consensus value of 2232 ± 5 yr BP. The FIRI D sample was also measured several times during this period (n = 19, from 5 different pretreatments) and its mean value F14C = 0.57088 ± 0.00029 (radiocarbon age: 4503 ± 4 yr BP) is statistically consistent with the consensus value of 4508 ± 3 yr BP. From this agreement, we conclude that we do not have an offset in our results and that the uncertainties of the measurement and the blank correction describes the overall uncertainty well, and an additional system component or multiplier is not needed (Nadeau and Grootes Reference Nadeau and Grootes2013).
CONCLUSION
In the past years, the National Laboratory for Age Determination in Trondheim completed the transition from traditional decay counting to AMS measurements. This included testing adapted procedures for handling, cleaning, and measuring for mg size samples. New systems allow a higher sample throughput with a limited need of manpower. The infrastructure and systems for handling sample information and results were designed for an efficient and well documented work flow. The addition of an IRMS also extends the capabilities of the lab, both for checking 14C related procedures and for independent research.
ACKNOWLEDGMENTS
We thank Gordon Cook and Philip Naysmith from SUERC for the possibility to visit their laboratory, which played a key role in developing our Zn reduction system. We also want to thank Axel Steinhof and Martin Göbel from MPI Jena for their support in transporting and commissioning the reduction system from Erlangen.