Size effects in plasticity have been documented through many experiments over the past two decades.[Reference Fleck, Muller, Ashby and Hutchinson1–Reference Stolken and Evans3] Shearing of a well-bonded metal layer sandwiched between two substrates which do not deform plastically has been one of the canonical cases studied in the development of non-local plasticity theories.[Reference Fleck and Hutchinson4–Reference Lele and Anand8] In many respects, it captures in the simplest manner the essence of plastic strain gradients associated with geometrically necessary dislocations generated when plastic flow is blocked at the metal/substrate interfaces. Analytically, shear of confined layers is one of the simplest problems to solve.[Reference Fleck and Hutchinson4–Reference Lele and Anand8] Previous experiments performed in the configuration of shear loading of thin Al layers diffusion bonded between Al2O3 adherents were inconclusive.[Reference Tagarielli and Fleck9] Until now, experimental data for the confined shear problem have not been available to confront theoretical predictions.
Shear plastic flow in confined thin layers, in addition to its scientific interest, is of significant technological interest. Over the past two decades, vapor phase deposition of thin ceramic coatings has become an important means for engineering surfaces of mechanical components[Reference Eckels, Kotzalas and Doll10] and manufacturing tools.[Reference Cao and Meng11] Satisfactory adhesion of coatings to substrates is critical to the lifetime of coated systems and often the deciding factor for their implementation. To improve adhesion, interfacial layers, often consisting of elemental metals, are deposited between the ceramic coating and the substrate. When coated components are subjected to external load, shear strength of the interface region can be the limiting factor on how mechanical load is transmitted from the substrate to the top coating.[Reference Agrawal and Raj12] Measurements of shear plastic flow in confined thin layers and correlation of flow stress to their structure and composition are therefore important for engineering improved coating/adhesion-layer/substrate systems.
The dominant experimental means for determining yield strength of thin metal films at present is instrumented nanoindentation. However, mechanical property evaluation by indenting films on substrates encounters difficulties at small film thicknesses due to substrate influence.[Reference Saha and Nix13] A new experimental protocol for evaluating the mechanical integrity of interfaces between hard coatings and substrates was demonstrated recently.[Reference Chen, Mu and Meng14] Vapor-deposited specimens in the configuration of coating/interlayer/substrate were fabricated via scripted focused ion beam (FIB) milling into microscale cylindrical pillars.[Reference Shade, Wheeler, Choi, Uchic, Dimiduk and Fraser15] Specimens were oriented such that the coating/interlayer/substrate interface is inclined with respect to the pillar axis. Interfacial failures were then achieved through compression loading of the pillars in the axial direction.[Reference Chen, Mu and Meng14] When the coating and the substrate are both elastic-brittle materials, axial compression of pillars with inclined interfaces results in a combination of compression and shear loading on the interlayer, in which the compression loading is not expected to significantly alter the shear plastic flow behavior of the interlayer. This test configuration therefore presents a suitable geometry for experimental evaluation of shear plastic flow of confined layers. We report here the results of compression testing on CrN/Cu/Si(100) micropillars containing 45°-inclined interfaces with varying Cu interlayer thickness t and micropillar diameter D, tested to different indenter displacements h.
Deposition of CrN coatings was carried out in a vapor deposition tool, which housed a 13.56 MHz inductively coupled plasma (ICP) and four balanced magnetron sputter guns.[Reference Meng, Curtis, Rehn and Baldo16] All guns faced the center of the deposition chamber, with a base pressure of <5 × 10⁻⁹ Torr. Cleaned Si(100) substrates, 50.8 mm in diameter, were placed into a load lock, evacuated to ≤2 × 10⁻⁶ Torr, and then transferred to a specimen holder placed at the center of the deposition chamber. No intentional substrate heating was applied during deposition. Three guns were fitted with pure Cr (99.95%) targets and one gun was fitted with pure Cu (99.95%). The entire deposition sequence occurred in ~10 mTorr of Ar (99.999%+). The Si substrate was first subjected to an Ar ICP etch for ~10 min at a bias voltage of −50 V, with a total of 1000 W input into the ICP. Immediately after etching, an elemental Cu layer was deposited onto the Si substrate at a bias voltage of −50 V by sputtering the Cu target in Ar ICP at the same total input power. Deposition of the CrN top coating layer, ~5 µm in thickness, occurred immediately after Cu deposition at a bias voltage of −100 V in an Ar/N2 (99.999%+) ICP at the same total input power. During CrN deposition, the Ar/N2 input flow rates were adjusted to a nitrogen-rich condition past the pressure hysteresis point. Five CrN/Cu/Si specimens were deposited, with nominally the same CrN layer thickness and varying Cu interlayer thickness t.
Structural characterization by X-ray diffraction (XRD) was carried out on a PANalytical Empyrean system with CuKα radiation. Diffraction patterns obtained from Cu thin films deposited on Si(100) in the θ–2θ geometry showed peaks which can be indexed to an face-centered cubic (fcc) structure with a lattice parameter of ~3.617 Å, close to the bulk Cu lattice parameter of 3.615 Å. Deposited Cu films have a strong fiber texture with a predominant orientation of Cu〈111〉//Si[100], consistent with low-temperature sputtered fcc metal films. Glancing incidence XRD patterns obtained from CrN/Cu/Si(100) specimens, with a fixed incidence angle of 2.5°, showed diffraction peaks which can be indexed to a cubic structure with lattice parameters of 4.17–4.20 Å, close to the bulk B1–CrN lattice parameter of 4.149 Å.[Reference Toth17] Using the sin2ψ method, residual stresses within the CrN films were obtained to be ~− 0.8 GPa. Such low compressive residual stress levels are beneficial for depositing CrN films of higher thicknesses. Additional XRD patterns in the θ–2θ geometry showed a lesser degree of texture within CrN as compared with Cu, with CrN〈111〉 and CrN〈200〉 being the main crystallographic directions parallel to Si[100].
Compositional analysis by X-ray photoelectron spectroscopy (XPS) was carried out on a Kratos AXIS165 system with monochromatic AlKα excitation. Prior to spectrum acquisition, specimen surfaces were etched with a 5 kV 15 mA Ar+ ion beam for ~25 min. Survey spectra obtained from typical Cu films showed that all observed spectral features can be assigned to various Cu core level transitions and Auger transitions. At binding energies corresponding respectively to O1s and C1s levels, ~532 and 284 eV, no signals were observed above background, indicating that oxygen and carbon contaminations within the Cu film were below the instrumental detection limit of ~1 at.%. Survey spectra obtained from the top layer of typical CrN/Cu/Si specimens showed that all observed spectral features can be assigned to various Cr core level transitions and the N1s transition. Using factory supplied sensitivity factors, the N-to-Cr ratio was determined to be ~49:51, indicating close to stoichiometric CrN. XPS data again showed oxygen and carbon contamination within the CrN layers to be <1 at.%.
Focused Ga+ ion milling and specimen examination by electron- or ion-induced secondary electron (SE/ISE) imaging were carried out on an FEI Quanta3D FEG dual-beam instrument, which combines a field-emission electron source, a high-current Ga+ ion source, and an X-ray energy-dispersive spectroscopy (EDS) attachment. Typical sizes of Cu grains within sputtered Cu films were estimated from ISE images of FIB cross-sections, where channeling of primary Ga+ ions enhances contrast between neighboring grains with differing orientations. Lateral dimensions of Cu grains ranged from ~60 to 130 nm with no obvious dependence on film thickness, as expected from low-temperature depositions.
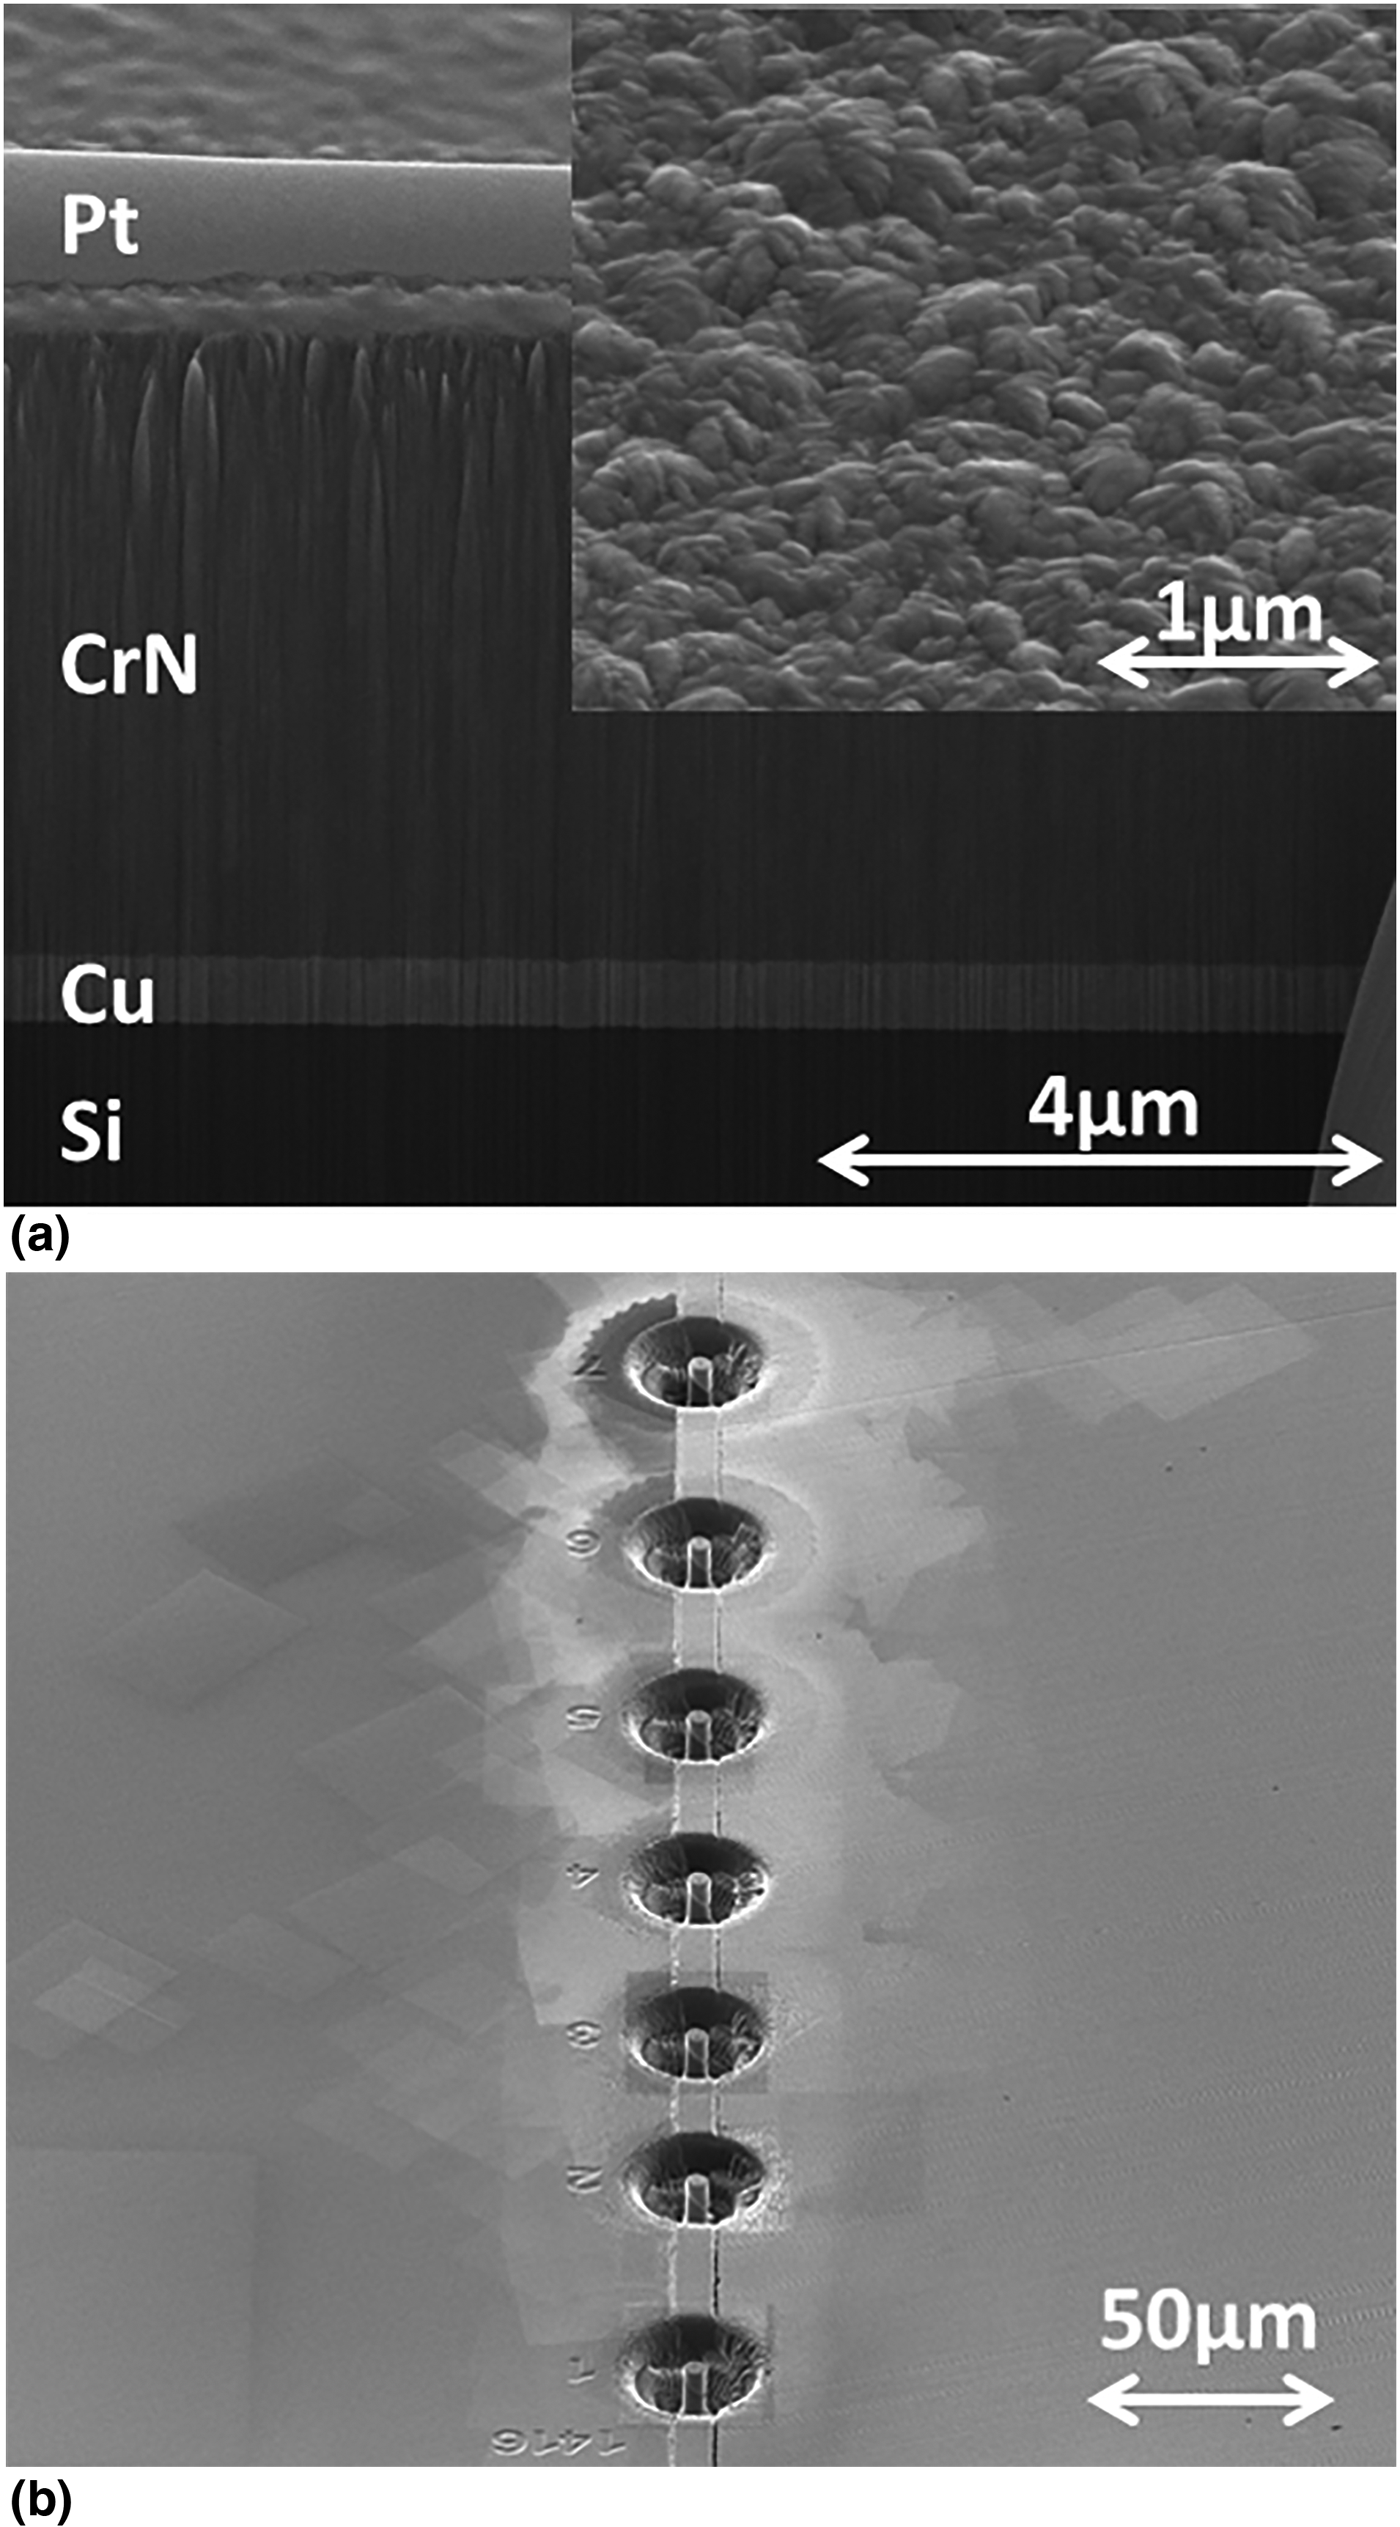
Figure 1(a) shows an FIB cross-section of a typical CrN/Cu/Si(100) specimen. A Pt protection layer was deposited onto the CrN top surface by Ga+ catalyzed Pt metal-organic gas source deposition before Ga+ milling perpendicular to the specimen top surface at successively reduced Ga+ currents, from 30 to 1 nA. In Fig. 1(a), the Pt protection layer, the CrN top layer, the Cu interlayer, and the Si substrate are clearly visible. The thickness of the Cu interlayer was measured to be ~550 nm, with an estimated error of ~5% based on repeat measurements. The cross-section reveals a dense and columnar structure of the CrN layer. The inset of Fig. 1(a) shows a tilted plan-view SE image of an as-deposited CrN top surface. The inset shows surface roughness consistent with the columnar structure of CrN as well as the absence of any perceptible voids, indicative of a fully dense film. Similar FIB cross-sections were used to measure t values in all CrN/Cu/Si(100) specimens. Combining results of XRD, XPS, and FIB cross-sectioning, it is concluded that deposited CrN/Cu/Si(100) specimens consist of a fully dense polycrystalline B1–CrN top layer, a Si(100) substrate, and a polycrystalline Cu interlayer with oxygen and carbon contamination <1at.%. The Cu interlayers have a strong fiber texture with Cu〈111〉//Si[100], and lateral sizes of grains from 60 to 130 nm with no obvious dependence on thickness.
(a) An SE image of the FIB cross-section of one CrN/Cu/Si(100) specimen. The inset shows a titled plan-view SE image of the CrN top surface. (b) An ISE image of an array of CrN/Cu/Si(100) micropillars after FIB lathe-milling.

As-deposited CrN/Cu/Si(100) specimens were cut to pieces of smaller size. A stainless steel sheet, ~750 µm in thickness, was cut to a similar size and bonded face-to-face to a CrN/Cu/Si(100) piece with M-Bond 610 adhesive. The bonded assembly was then embedded in epoxy, with the CrN/Cu/Si interface pre-aligned with a 45° inclination to the epoxy top surface. After epoxy curing, its top surface was then polished by SiC abrasives and finished with ~1 µm diamond suspension. Scripted Ga+ milling was then used to fabricate an array of micropillars containing the CrN/Cu/Si interface at a 45° inclination. Figure 1(b) shows an array of 7 CrN/Cu/Si micropillars fabricated from one CrN/Cu/Si(100) specimen. All seven pillars have similar diameters D of ~4.6 µm and the same interface inclination of 45°.[Reference Chen, Mu and Meng14] Micropillars were fabricated out of CrN/Cu/Si(100) specimens with different t values. In all cases, the minimum distance between the CrN/Cu/Si interface and the pillar top surface was ≥2 µm, and the ratio t/D was <0.26.
Compression loading of CrN/Cu/Si micropillars was carried out on a NanoIndenter XP with a custom-made, ~10 × ~10 µm2, flat-ended diamond punch. An increasing load was applied to the pillar top surface in the displacement-controlled mode, with raw indenter load L and total indenter displacement h monitored continuously. A constant loading time of 180 s to a preset h value was specified, and the loading was stopped when the specified h was reached, followed by load removal. Figure 2 shows a collection of raw L–h curves measured from five groups of micropillar specimens, with t values of ~150, 340, 550, 810, and 1180 nm, respectively. Within each specimen group, repeat measurements on four to six separate micropillars were conducted. Several features are evident. First, all L–h curves exhibit a rapid, approximately linear, increase in L with increasing h until a critical L value, L c, is reached. Further increase in h then occurs with little further increase in L. Second, the L–h curves fall into five succinct groups, separated from each other according to the t value. The smaller the t, the higher the L c. Third, once L c is reached, further increase in h does not continue without bound. An eventual catastrophic failure point was reached as h continued to increase, manifested in large and discontinuous displacement excursions to h values of several microns. The smaller the t value, the earlier this catastrophic failure point is reached.
Raw L–h curves obtained from compression loading of CrN/Cu/Si(100) micropillars with 45°-inclined interfaces. Five groups of data were obtained from pillars with five t values, indicated in the figure.
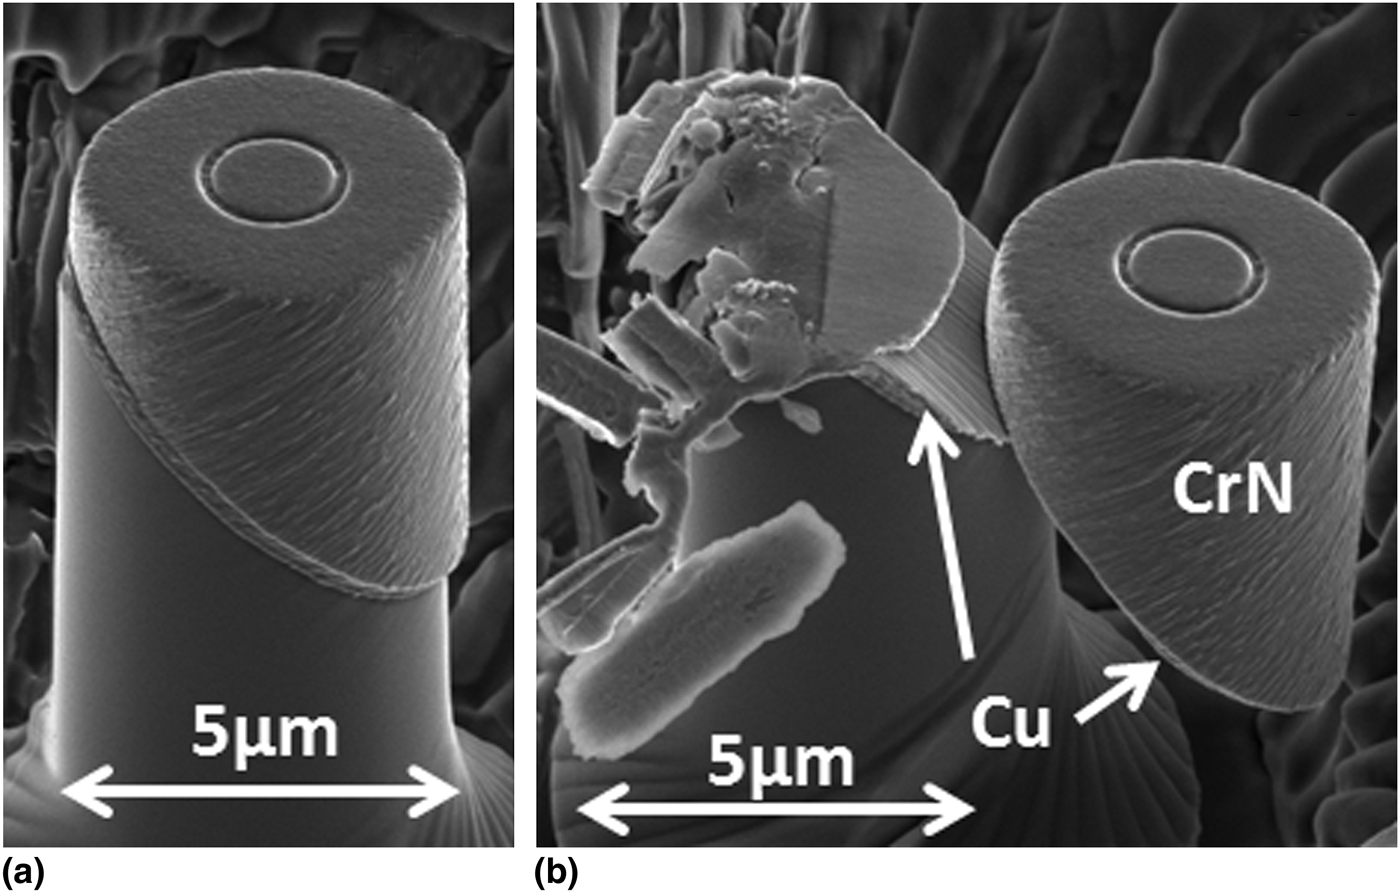
Figure 3 shows a sequence of events occurring at different stages of compression loading on one CrN/Cu/Si micropillar with a t value of ~340 nm. Figure 3(a) shows one pillar after compression loading to h ~400 nm. It is evident from Fig. 3(a) that a small but clear shear displacement of the top CrN portion occurred as a whole with respect to the bottom Si portion, along the original CrN/Cu/Si interface direction. Figure 3(b) shows another pillar with the same t, with an h value >4000 nm. In this case, the catastrophic failure point was reached shortly after h exceeded 400 nm, with the next recorded h >4000 nm and well separated from a continuous group of progressively increasing h values. Such data indicate a large and abrupt indenter displacement after reaching the failure point. In agreement, Fig. 3(b) shows the diamond punch impacted the top of the bottom Si portion of the micropillar, causing a part of it to fracture. Examination of the part of the pillar not damaged by the indenter impact shows clear evidence that pillar failure was a result of continued shear displacement of the top CrN portion as a whole with respect to the bottom Si portion, along the original CrN/Cu/Si interface direction. The shear displacement occurred with the bottom Si and top CrN portions undeformed. In Fig. 3(b), Cu is present on the top Si surface as well as the bottom CrN surface, both exposed as the result of the extensive shear displacement, as confirmed by spot mode EDS. Clear sliding marks are evident on the exposed top Si surface. Results shown in Figs. 2 and 3, combined, show unequivocal evidence of the occurrence of shear plastic flow within the Cu interlayer. Similar results, both in terms of the L–h curves and the image features, have been observed at all five t values.
ISE images of micropillars at different stages of compression loading: (a) one pillar after the compression load was removed when h = 400 nm was reached; (b) one pillar after h > 4000 nm. The t value was ~340 nm.
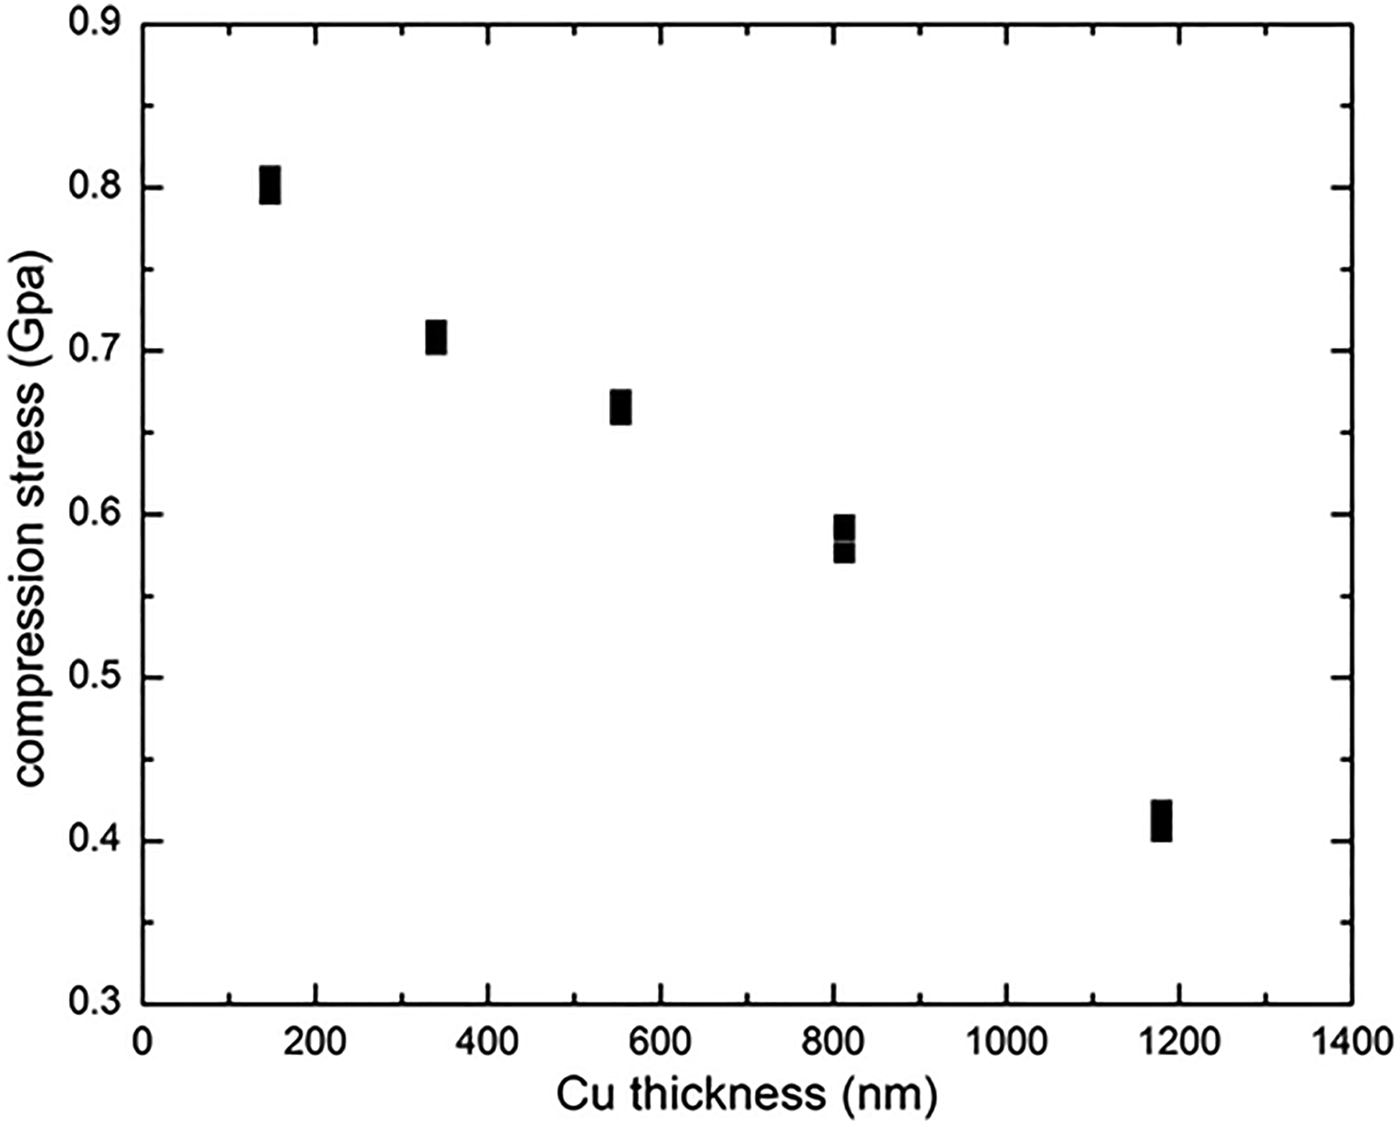
The raw L c values were therefore converted to nominal shear flow stresses, τ, for the Cu interlayers. With the Cu interlayer at a 45° inclination, τ = σ/2, where σ = 4L c/πD 2, i.e. σ is the critical compression stress. Figure 4 shows the values of τ plotted as a function of t. Each data point in Fig. 4 represents an independent test on a separate pillar. The data points, 4–6 at each t value, fall on top of each other in Fig. 4. For the data group with the largest scatter, at t ~1180 nm, τ was measured as 0.41 ± 0.01 GPa. This measured flow stress value of 0.41 GPa is close to a previously reported room temperature flow stress for nanocrystalline Cu.[Reference Kunimine, Takata, Tsuji, Fujii, Kato and Onaka18] As t decreases, the value of τ increases to ~0.80 GPa at t = ~150 nm. The measured τ increase lies significantly outside the range of data scatter, showing a clear dependence of τ on t in confined shear plastic flow. To our knowledge, this is the first time such dependence has been measured unequivocally. Separate measurements showed that σ did not exhibit a strong dependence on the pillar diameter. For a given Cu interlayer thickness, the difference in σ was measured to be <10% as D varied between ~5 and 2 µm.
Values of the nominal shear flow stress of Cu interlayers as a function of the interlayer thickness.
Ideal shear strength of single-crystal Si has been reported to be ~7 GPa.[Reference Roundy and Cohen19] The hardness of CrN has been measured to be >20 GPa.[Reference Toth17] Given that σ values presently measured were <2 GPa, the fact that both Si and CrN remained underformed during compression loading is expected. Direct comparison between the data presented in Fig. 4 and non-local plasticity theories[Reference Fleck and Hutchinson4–Reference Lele and Anand8] are complicated by several factors. The Cu interlayers presently studied are polycrystalline with small grain sizes. Even though the predominance of Cu grains are oriented with the {111} slip plane parallel to the shear direction, the presence of numerous grain boundaries within the shear plane presents a more complicated situation as compared with previous simulations.[Reference Fleck and Hutchinson4–Reference Lele and Anand8] In addition, instead of being perfectly flat, the CrN/Cu interface contains roughness resulting from the polycrystalline nature of Cu and CrN layers. However, this nanoscale roughness, as evidenced in Fig. 1(a), is significantly less than the Cu layer thickness at all t values. Experimental efforts to better control such complications, e.g., by controlling the grain size of the metal interlayer, are ongoing.
In summary, compression loading of CrN/Cu/Si(100) micropillars containing 45°-inclined interfaces yielded unequivocal evidence of shear plastic flow within polycrystalline Cu thin films confined between undeforming single-crystal Si(100) and polycrystalline CrN. A clear and significant dependence of the shear flow stress on Cu layer thickness was demonstrated. The present results give a new and independent measure of the size effects in confined shear plastic flow. It is hoped that the presently described shear test will just be the beginning of experimental efforts to generate more data on this fundamental problem.
Acknowledgments
Partial project supports from NSF and LA BoR through grant CMMI-0900167 and contract LEQSF(2013-16)-RD-B-01 are gratefully acknowledged. W.J.M. acknowledges helpful discussion with Professor J.W. Hutchinson. K.C. and W.J.M. thank Dr. P. Shade for instructions with respect to the FIB lathe-milling program.