


Introduction: Light Buyers and Henry Poole
Evidence collected from the sales ledgers of Henry Poole & Co, a leading bespoke tailor on London’s iconic Savile Row, between 1890 and 1899 shows that light buyers were more important than might be expected from most marketing theory. The generally accepted view in marketing, as well as marketing history, is that brands should focus on heavy buyers through a process of segmentation, targeting, and positioning (STP).Footnote 1 This is supported by the aphoristic Pareto Law applied to marketing, according to which 80 percent of a brand’s sales come from only 20 percent of its customers, the “vital few.”Footnote 2 But in the sample of 665 customers from the ledgers held by Henry Poole & Co, known as Poole’s, 22 percent of the heaviest buyers, measured by the number of years in which they made a purchase, accounted for 44 percent of the total purchase years. The 20 percent of heaviest buyers, measured by the amount they spent, accounted for 61 percent of total sales by value. These historical findings confirm repeated contemporary studies from an evidence-based marketing (EBM) perspective in which only 50 to 60 percent of sales come from the top 20 percent of buyers.Footnote 3 This article considers the implications for marketing history if it is accepted that there is a “law-like” 60/20 pattern of purchasing that “applies across brands and categories,” and in all historical periods.Footnote 4
Poole’s was established in 1806 and became a mainstay of Savile Row after opening a shop on the street in 1828. The extensive collection of sales ledgers held in the company’s archive has previously been used to study fashion history. Most notably, Fiona Anderson gives an account of what Poole’s “elite male customers” were wearing during the second half of the nineteenth century. She found that the dinner jacket, or Tuxedo, which Poole’s claims to have invented in 1865 for the Prince of Wales, and future King Edward VII (1841–1910), “was initially only worn in male company,” but by 1900 it was also “worn at informal mixed dinners.”Footnote 5
Because Poole’s sales ledgers are so detailed and comprehensive, they can also be used to replicate contemporary quantitative marketing studies which use longitudinal data, where individual consumer purchases are recorded across time. By explicitly challenging the Pareto principle using historical sources, the research presented here poses the question of whether marketing historians have uncritically accepted the STP theory of brand competition as if it is synonymous with “modern marketing theory.”Footnote 6 In addition, the research replicates and extends previous studies of contemporary buyer behavior by covering an exclusive luxury consumer brand in a historical context. The research also offers an insight into the history of Poole’s and the behavior of customers that is probably unexpected by the purveyors of luxury brands.
The article starts with an outline of the EBM perspective, which has consistently contradicted the widely accepted 80/20 Pareto Law. Instead of trying to find distinct segments of customers who can be targeted with a unique product, as suggested by STP theory, EBM proposes that brands need to build broad “physical and mental availability” to attract light buyers as much as heavy buyers.Footnote 7 The second section outlines how a commitment to STP has informed the interpretation of marketing history, but the case is made that the implications of EBM for marketing history should be considered. The third section gives a brief history of Henry Poole & Co, the first bespoke tailor on London’s Savile Row. This leads on to a description of Poole’s ledgers in the fourth section, as well as the procedure used for extracting a ten-year data set, and the methods of data analysis. The fifth section sets out the findings from Poole’s customer records, which conform to the 60/20 law in line with the expectations of EBM. The conclusion considers how the findings on Poole’s along with the 60/20 law of purchasing patterns from EBM could be incorporated into the historiography of marketing theory and practice.
Evidence-Based Marketing
The proponents of EBM see themselves as “revolutionaries” taking on “the establishment” in marketing. They claim to be advancing a scientific “data first” approach, searching for “law-like patterns in many sets of data,” as opposed to the “typical theoretical confirmationist approach” which pervades research in marketing and social science in general.Footnote 8 The scientific approach is reflected in a proclivity for analyzing actual behavior, namely the number or value of purchases by individual customers, rather than attitudes inferred from consumer questionnaires or interviews. What consumers say they do in surveys may diverge from what they actually do when making purchases. Furthermore, from the EBM perspective, attitudes are deemed to follow behavior. In other words, if a consumer buys more of a particular brand, for whatever reason, then that consumer will be more likely to express a positive attitude toward that brand.Footnote 9
According to advocates of EBM, the “establishment” in marketing adheres to “the dominant Segmentation, Targeting, Positioning (STP) theory of brand competitiveness,”Footnote 10 as promoted by most marketing textbooks, especially successive editions of Philip Kotler’s Marketing Management. STP developed as an extension of the four Ps of marketing: product, price, place, and promotion.Footnote 11 It is comprised of three steps: first, segment the market into relatively homogeneous exclusive groups based on variables such as demographics, psychographics, behavior, or geography; second, target the segment or segments that are likely to be most profitable; and finally, position the brand by differentiating it from competitors in order to secure customer loyalty.
STP theory implies that potential heavy buyers can be distinguished from light buyers and that heavy buyers are of much greater value. The simple rationale is that a customer who buys ten times per year is worth ten times as much as one who makes a single purchase. Acquiring and retaining a big customer is therefore seen as a more efficient use of resources that offers higher payback per buyer in comparison to light buyers, and leads marketing managers to pursue strategies such as loyalty programs to tie in heavy buyers. The importance of heavy buyers is often expressed in terms of the Pareto Law that “80% of results stem from 20% of their causes.”Footnote 12 According to one of the many popular books on The 80/20 Principle, one of the “golden rules” for marketing is that:
Marketing, and the whole firm, should devote extraordinary endeavor towards delighting, keeping forever and expanding the sales to the 20 per cent of customers who provide 80 per cent of the firm’s sales and/or profits.Footnote 13
This practical self-help style book is surprisingly widely cited as an authority, even in academic marketing articles that use quantitative analysis of survey data.Footnote 14 While observance of the 80/20 rule has sometimes been seen as self-defeating if taken to excess, it is clearly widely accepted in marketing.Footnote 15
A central theme in the EBM critique of STP is that in most studies of actual purchases the top 20 percent of customers only account for between 50 and 60 percent of sales.Footnote 16 Therefore, the 80/20 rule exaggerates the importance of heavy buyers and distorts the efforts of marketing managers.Footnote 17 More careful observation reveals that customers are not so tidily either light or heavy brand buyers; some buy seven or eight times a year, others buy two or three times, and some who bought many times in one year may not buy at all the next year. In short, customers vary a lot in how much and how often they buy, and therefore a better description of the customer base is as a continuum stretching from non-buyers and one-time buyers to those that buy very often.
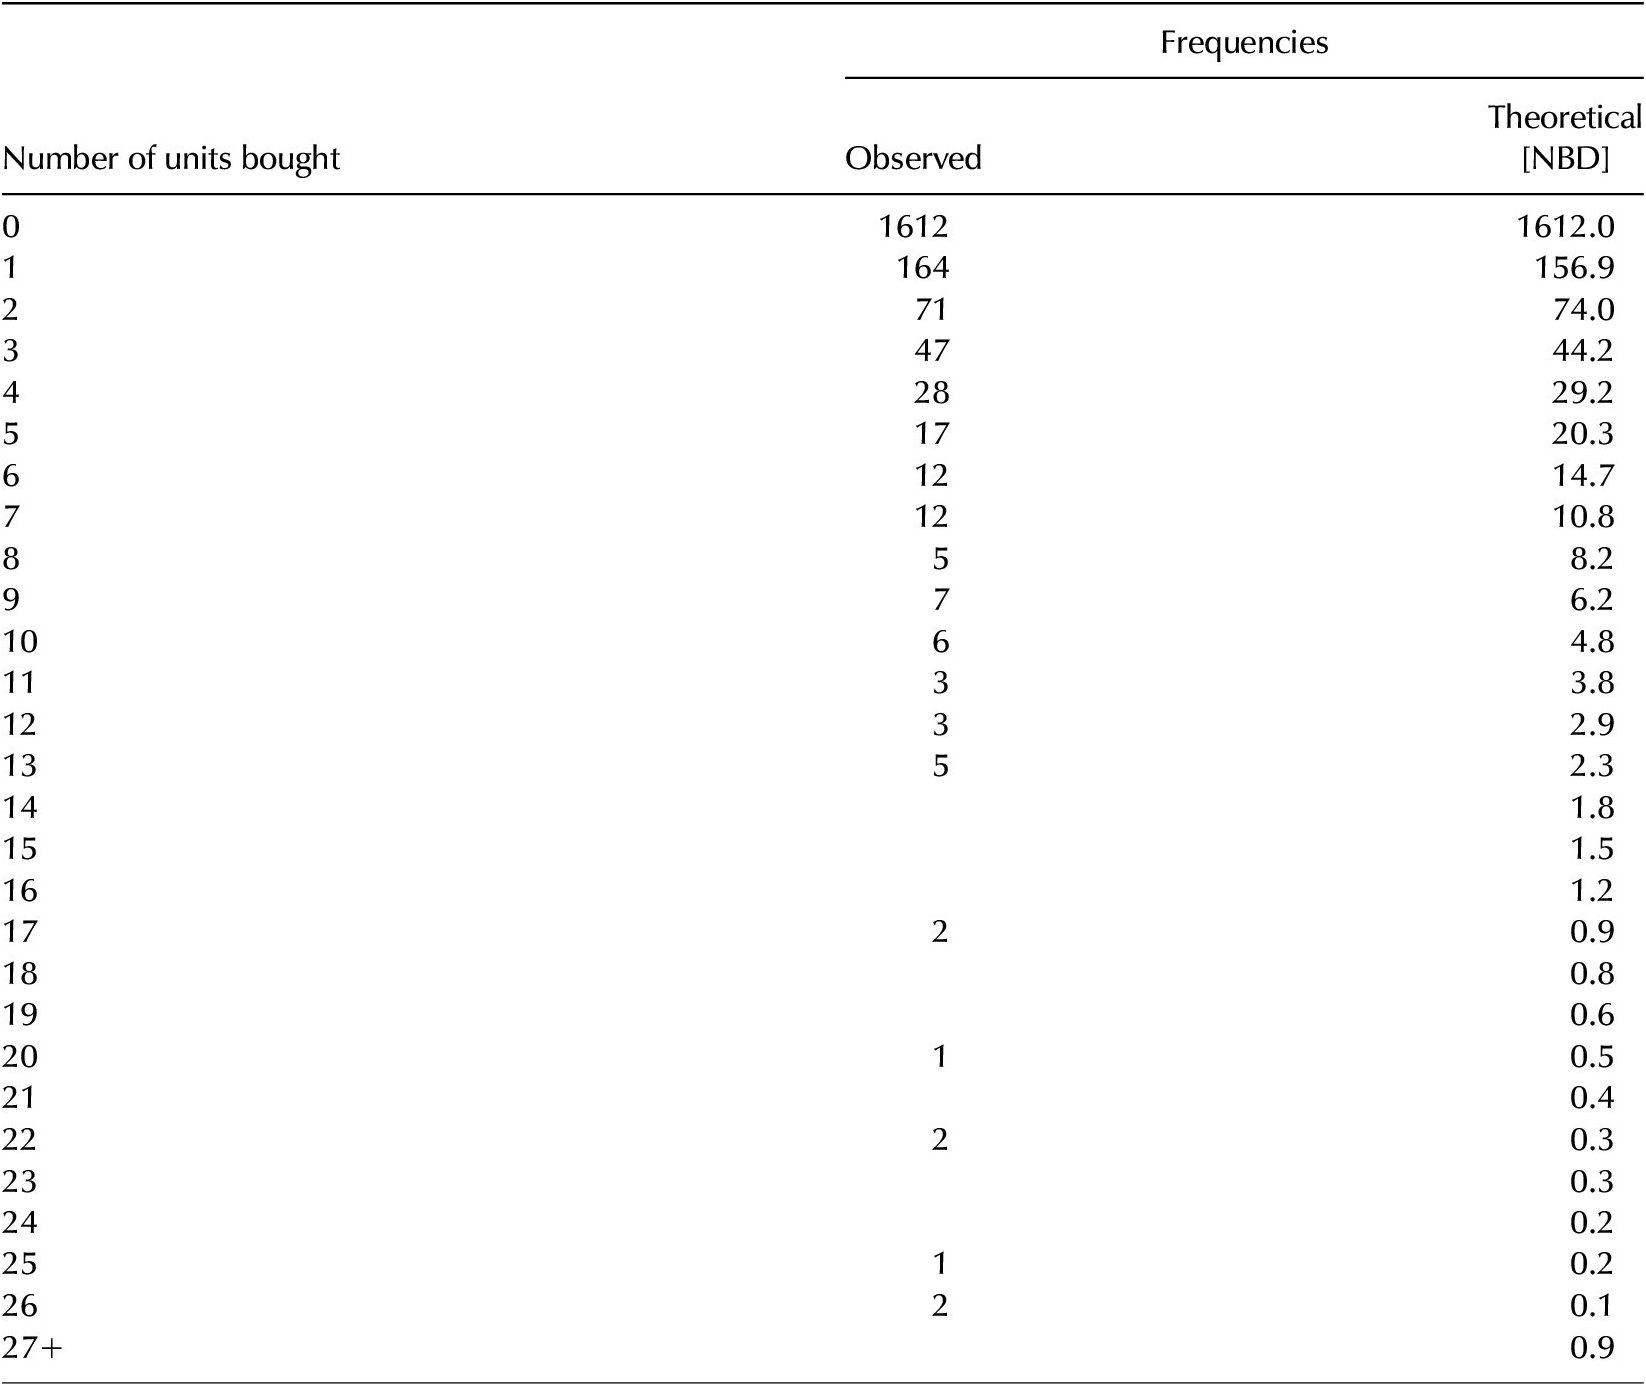
The insight into the frequency of purchases by consumers originates from the work of Andrew Ehrenberg (1926–2010), a statistician who moved into marketing and became Chair of Marketing Communication at London Business School in 1970 and Professor of Marketing at London South Bank University in 1993. Ehrenberg’s groundbreaking article on marketing, published in 1959, examined purchasing patterns in consumer data that tracked routine household purchases made in supermarkets, specifically the purchases by two thousand households of an unspecified prepackaged non-durable supermarket product over a six-month period. As a statistician, Ehrenberg realized that the empirical data corresponded closely to a negative binomial distribution (NBD), which takes the shape of a smooth convex downward sloping curve. Ehrenberg’s empirical data and the theoretical frequencies of purchases for an NBD are shown in Table 1.Footnote 18
A typical example of the fit of a negative binomial distribution (26-weekly data for a 2000-household sample)

Table 1. Long description
The table consists of three columns: Number of purchases (x), Observed percentage of households, and Theoretical percentage of households.
* Row 1: 0 purchases; Observed 64; Theoretical 64.
* Row 2: 1 purchase; Observed 13; Theoretical 14.
* Row 3: 2 purchases; Observed 7; Theoretical 7.
* Row 4: 3 purchases; Observed 4; Theoretical 4.
* Row 5: 4 purchases; Observed 3; Theoretical 3.
* Row 6: 5 purchases; Observed 2; Theoretical 2.
* Row 7: 6 purchases; Observed 2; Theoretical 1.
* Row 8: 7 purchases; Observed 1; Theoretical 1.
* Row 9: 8 purchases; Observed 1; Theoretical 1.
* Row 10: 9 purchases; Observed 1; Theoretical 1.
* Row 11: 10 to 15 purchases; Observed 2; Theoretical 2.
* Row 12: 16 or more purchases; Observed 0; Theoretical 0.
The final row shows the Mean: Observed 1.1; Theoretical 1.1. The data demonstrates a very close fit between the observed consumer behavior and the negative binomial distribution model.
Source: Ehrenberg “The pattern of consumer purchases” 29.
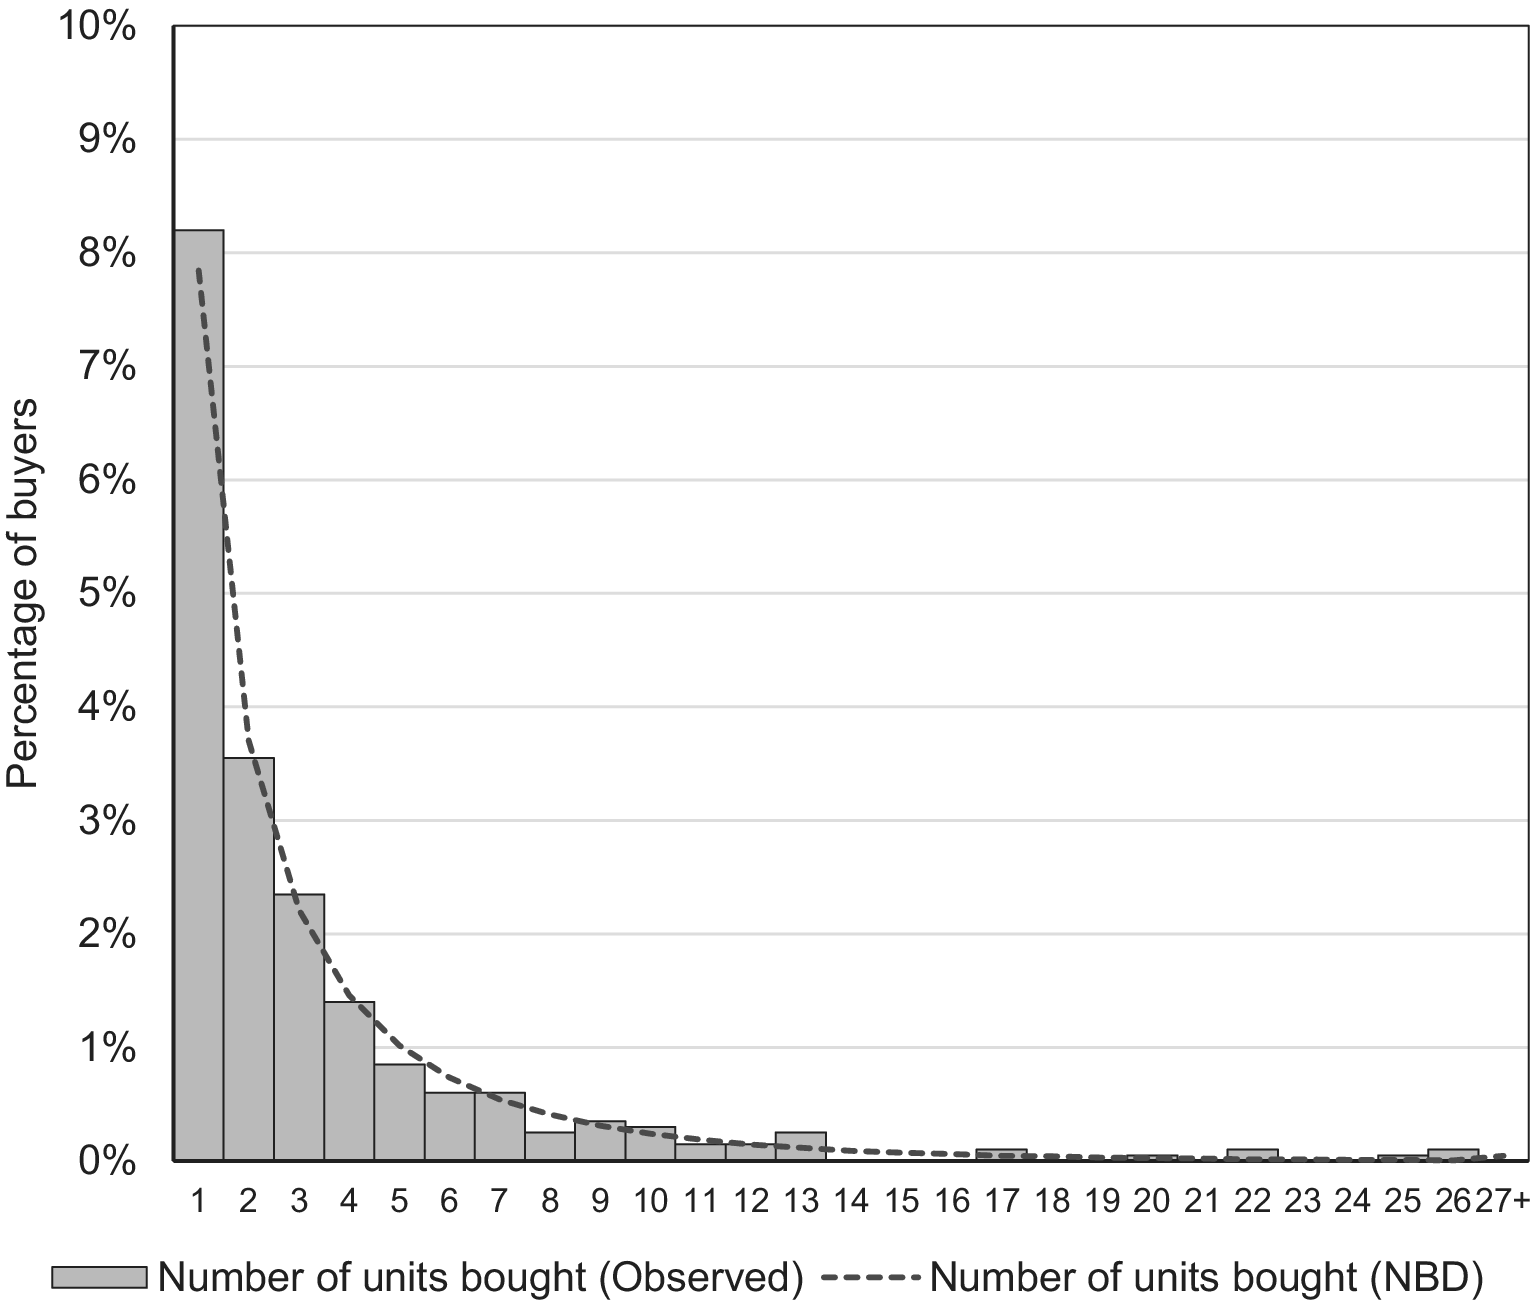
In Ehrenberg’s example, when the number of households making different numbers of purchases was compared with the NBD predictions, there was an excellent fit (correlation r = .99).Footnote 19 Note that 1,612 households did not buy in the time period, while 164 bought once, 71 bought twice, and so on—i.e., most households in the survey did not buy in the time period. Note also that the number of buyers making more than one purchase is small and falls off rapidly. The shape of the resulting distribution is shown graphically in Figure 1. As Ehrenberg remarked nearly fifty years after his groundbreaking article was published, “That should have been the end of marketing’s pipedreams of just recruiting heavybuying buyers, but of course wasn’t.”Footnote 20 The NBD has been found to describe consumer purchasing for most product categories or brands and shows that over time, consumers tend to have steady long-run purchase rates, e.g., buying four times in a year, but not a regular purchase pattern, i.e., purchases occur randomly during the year, not once every quarter.
Percentage of 2000 sample households purchasing a consumer product once or more during 26 weeks.
Source: Derived from Ehrenberg “The pattern of consumer purchases” 29.

Figure 1. Long description
The vertical Y axis is labeled Percentage of buyers and ranges from 0 percent to 10 percent in increments of 1 percent. The horizontal X axis represents the number of units bought, ranging from 1 to 27 plus.
Two data series are presented:
* Number of units bought Observed is shown as gray vertical bars. The first bar at 1 unit is the highest at approximately 8.2 percent. The bars show a steep exponential decay, dropping to roughly 3.5 percent at 2 units, 2.3 percent at 3 units, and continuing to decrease until they level off near 0 percent from 14 units onward.
* Number of units bought N B D is shown as a dashed curved line. It starts slightly below the first bar at approximately 7.8 percent and follows a smooth asymptotic curve downward. The line closely tracks the tops of the bars, showing a strong correlation between the theoretical N B D model and the observed data.
Minor fluctuations in the observed bars occur at higher unit counts, such as small peaks at 13, 17, 22, and 26 units, while the N B D line remains a smooth curve approaching the X axis.
The leading proponents of EBM, Byron Sharp, Jenni Romaniuk, and their associates,Footnote 21 have presented reams of data to show that “for dozens of brands, across product categories,” over a period of a year, the percentage of purchases by the top 20% of buyers, for a “fast moving consumer good” is “usually not far over 50% and rarely anything like the proverbial 80%.”Footnote 22 They acknowledge that a few researchers have produced results where the purchases of the top 20 percent of buyers “is not far from 80%.” However, these researchers “had to use very long windows (5-6 years) of analysis to make this point, which is atypical in brand management.”Footnote 23
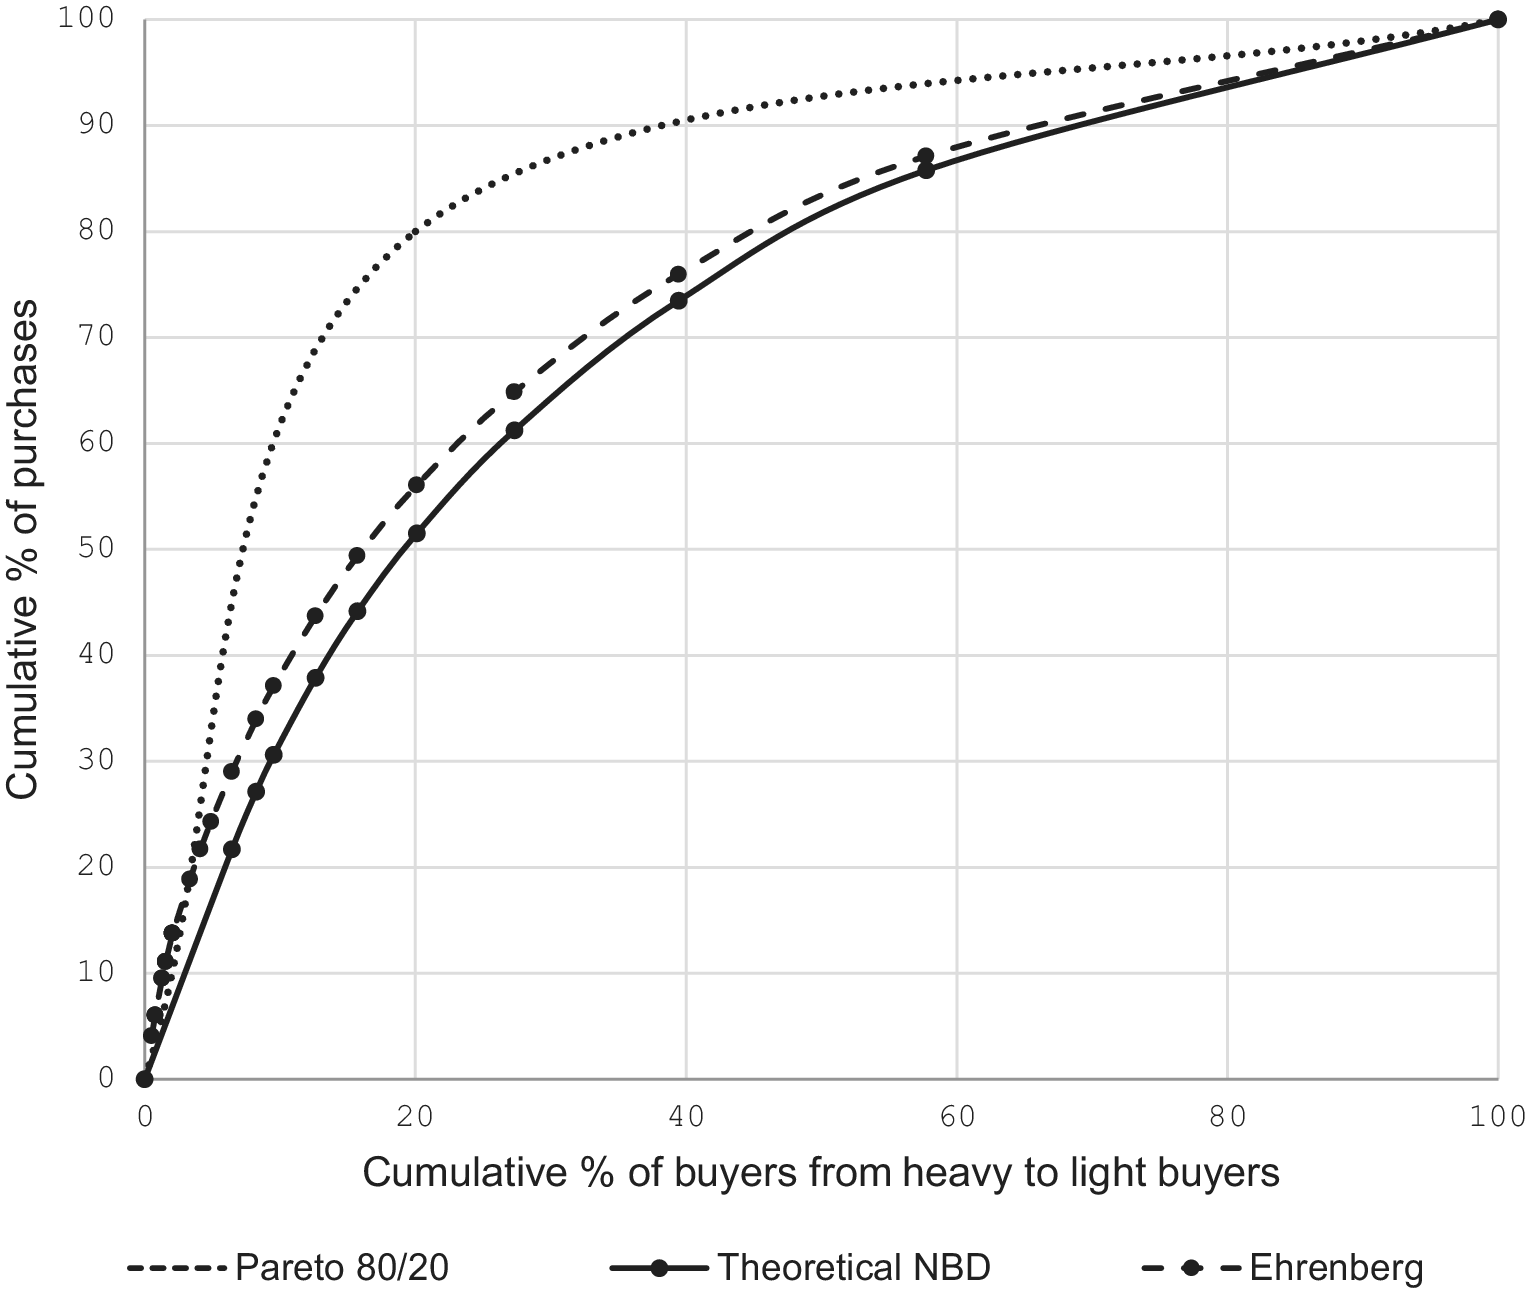
The contrast between the NBD with about 50 percent of purchases by the top 20 percent of buyers and the 80/20 Pareto distribution can be illustrated graphically for Ehrenberg’s original data. Figure 2 shows the cumulative percentage of actual purchases in Ehrenberg’s data. Ehrenberg’s data closely fits the curve for the theoretical NBD, but differs widely from the 80/20 Pareto distribution. The imaginary Pareto line is useful for highlighting just how gargantuan the heavy buyers or how long the tail of light buyers would have to be to produce an 80/20 Pareto distribution. EBM researchers have possibly resisted offering a graphical representation of an 80/20 Pareto distribution as a cumulative concentration curve lest they lend credence to such an impossible pattern of purchasing behavior.
Cumulative percentage of buyers making cumulative percentage of purchases: comparing observed data from Ehrenberg with the predicted negative binomial distribution and Pareto 80/20 distribution.
Note the Pareto 80/20 cumulative curve is generated by Excel from three data points: 0:0, 80:20, and 100:100.

Figure 2. Long description
A line graph on a grid background. The horizontal X axis is labeled Cumulative percent of buyers from heavy to light buyers with increments of 20 from 0 to 100. The vertical Y axis is labeled Cumulative percent of purchases with increments of 10 from 0 to 100. Three curves originate at 0,0 and terminate at 100,100.
* The Pareto 80/20 curve is a dotted line that rises most steeply, reaching approximately 80 percent of purchases at only 20 percent of buyers, then leveling off toward the top-right.
* The Ehrenberg curve is a dashed line with circular data points. It follows a more gradual concave path, sitting below the Pareto curve. At 20 percent of buyers, it reaches approximately 56 percent of purchases.
* The Theoretical N B D curve is a solid line with circular data points. It is the lowest of the three curves, showing the most gradual increase. At 20 percent of buyers, it reaches approximately 52 percent of purchases.
The Ehrenberg and Theoretical N B D curves remain closely aligned throughout the distribution, while the Pareto curve represents a significantly higher concentration of purchases among fewer buyers.
Ehrenberg did his pioneering work with consumer panel data that were available at the time, but since then the growing number of appropriate datasets has enabled the NBD to be tested for a wide variety of products in different categories and national contexts, including: medical prescriptions; consumer durables (PCs and cars); frequent flying by business travelers; industrial purchasing of chemical additives; paper and packaging; and ready-mix concrete.Footnote 24 A key finding from these studies is that in general, most customers do not buy a specific brand in a specified time frame, and the vast majority of a brand’s buyers buy it infrequently. Moreover, this is true for both the largest and smallest brands. These patterns are revealed by analyzing large data sets, which are typically produced by commercial marketing research firms that create panels with many participants who record every purchase they make as a household. The vast majority of such studies use relatively recent data, and there was no research of this nature before the advent of panels. However, other types of data can be used for such analysis, including individual company sales records, making it possible to explore new categories that are not served by panel data providers. EBM researchers have tried to identify markets where, for one reason or another, the NBD might not apply. For example, the “anecdotal claims” noted by Sharp et al “that in (some) business-to-business categories the Pareto share is extremely high (e.g., 90/20),”Footnote 25 appear to be refuted in studies of aircraft and ship purchasing patterns which conform to the NBD.Footnote 26
Luxury goods may also be an exception where reliance on relatively few wealthy buyers means that purchasing patterns might not fit the NBD. Not surprisingly, there is an extensive research literature on luxury brands in marketing. There are numerous research papers based on extensive surveys of consumers’ attitudes toward luxury brands; watches and sunglasses appear to be popular product categories with researchers.Footnote 27 The difficulty of defining luxury goods is clear from reviews of the literature such as “What is a luxury brand?” where it is noted that, “Unfortunately for researchers, there is not a widely accepted definition of what constitutes a luxury brand.” On the one hand, reviewers try to distill the definition of a luxury brand from multiple definitions in previous research, but on the other hand, they acknowledge that “whether or not a brand is considered luxury ultimately depends on consumer evaluations of that brand.”Footnote 28 It seems clear from these reviews and perusing the literature on luxury brands that almost all the research is concerned with consumer perceptions. There do not appear to be any studies of actual purchasing as would be expected for EBM.
From the EBM perspective, there is skepticism toward the notion that luxury brands need to be defined separately. It is argued that “the widely held beliefs that luxury brands are fundamentally different” turn out to be “myths”; the only “obvious difference about luxury brands is that they are very expensive, very high quality and beautiful.”Footnote 29 Of course it might still be argued that even within luxury categories, there is an exception for clothing that is constructed by hand from start to finish, made from high-quality, expensive, unusual fabric, cut for a perfect fit, sewn with extreme attention to detail and finished by the most experienced and capable tailors—using time-consuming, hand-stitching techniques. If there were a luxury exception to the NBD to be found among the buyers of exclusive brands where the custom-made tradition continues, such as tailors, shirt makers and boot makers, then the records from Henry Poole & Co. in the 1890s would be an ideal case study to test such a proposition. That was the original motivation for the research reported in this article. Notwithstanding the importance of customer perceptions in the definition of luxury, it seems safe to say that Poole’s is self-evidently a luxury brand.
Suitable contemporary data may not be available for the most exclusive luxury products, such as bespoke men’s suits. However, the detailed historical records of purchases from each and every customer kept by Poole’s are sufficient for statistical analysis. From an EBM perspective, the expectation would be that the pattern of buying by Poole’s customers would conform to the NBD, replicating findings from previous research. This would probably contradict the expectations of most luxury brand owners such as Poole’s. Furthermore, it would refute the notion, widely held by marketing managers for luxury brands, that even if customers for soap powder might behave in a way that readily conforms to the NBD, it is unlikely that the customers for exclusive high involvement luxury goods will do so.Footnote 30
The implications of EBM have been set out in a series of accessible books aimed at marketing practitioners and students.Footnote 31 The main point is that a purchasing pattern with an 80/20 Pareto distribution suggests an STP strategy that concentrates on a brand’s heaviest buyers. By contrast, a purchasing pattern that is closer to the 60/20 NBD highlights the importance of light buyers. The scientific agenda of EBM might be off-putting for historians. Advocates of EBM have occasionally disparaged other fields of research in marketing as unscientific,Footnote 32 and as quantitative researchers tend to do, dismissed insights from qualitative research that is seen as unrepresentative.Footnote 33 There is little or no engagement with history in EBM, which is more focused on differentiated replication in research and building relevant knowledge for practitioners. Even so, the contrast between assuming brands face a purchasing pattern that is either an 80/20 Pareto distribution or a 60/20 NBD, and a choice between securing loyalty from a segment of heavy buyers, or ensuring availability for light buyers, provides a prompt for reconsidering the history of marketing.
Marketing History
A useful starting point for considering marketing history is Richard Tedlow’s influential outline of how marketing developed in the United States. Drawing on a series of in-depth case studies of competition in soft drinks (Coke vs Pepsi), automobiles (GM vs Ford), and retail (Sears vs Montgomery Ward, and A&P), Tedlow set out three phases of marketing. In Phase I, fragmentation, up until the 1880s, there were fragmented local markets. Transport and communication costs inhibited the development of national consumer products. In Phase II, from the 1880s to the 1950s, unification, new technologies in manufacturing, as well as the railroads and telegraph, facilitated the founding of companies that made branded products to be marketed across the nation. Finally, in Phase III from the 1950s to the present or recent past, radio and especially television advertising paved the way for segmentation. While there had always been segmentation by price, from the 1950s markets were increasingly segmented along “both demographic and psychographic lines.” This is symbolized by “One of the most successful marketing communications campaigns in history,” whereby:
Pepsi-Cola attacked Coca-Cola by targeting a demographic and psychographic segment, what it labelled the ‘Pepsi generation’.Footnote 34
Several reviews of the field have made the point that “the periodization of marketing history is fiercely contested.”Footnote 35 Roy Church compares various periodizations, including Tedlow’s, and considers whether Kotler’s description of different “orientations towards the marketplace,” in the leading textbook Marketing Management,Footnote 36 can be used to map a series of chronological stages in marketing, for individual companies or for the general history of marketing. These chronological stages culminate in the “marketing concept.” Segmentation is seen as central to the marketing concept, especially segmentation using demographics, psychographics, and lifestyle.Footnote 37 Mark Tadajewski and Brian Jones rehearse “a lively debate about the origins of market segmentation.” The question seems to be whether finding individual companies that implemented something like a segmentation strategy long before the 1950s without reference to any theoretical marketing concept refutes periodizations such as Tedlow’s three phases. According to a classic article in the Journal of Marketing from 1956, not long before Ehrenberg’s landmark paper, segmentation may have always occurred through a process of “trial and error,” but “formal recognition of market segmentation as a strategy” only emerged in the 1950s.Footnote 38 While marketing historians may disagree about periodization and the finer points of defining what constitutes segmentation, there seems to be a consensus that, as Tadajewski and Jones put it:
The foundation of successful marketing strategy is the ability of a marketing manager to understand customers (markets) better than any competitor does and to allocate scarce resources (through market segmentation, targeting and positioning) to markets where the firm has superior strategic fit.Footnote 39
Thus, whatever the periodization, marketing history is presented as a teleological realization of STP theory and any alternative interpretation informed by EBM is overlooked.
Marketing historians seem to agree that STP was not widely needed nor implemented for consumer goods during the era of “mass production and mass marketing,” Tedlow’s Phase II. Tedlow quotes a Coca-Cola advertisement from 1905 and remarks ironically, “There is nothing in this text which suggests a modern segmentation scheme.”Footnote 40 Similarly, Daniel Robinson asserts that Wrigley’s “commercial prowess” in the United States derived from the company’s mass-marketing of chewing gum in early twentieth century. Robinson notes that for Wrigley’s, “Market segmentation was not a guiding principle,” and concludes that Wrigley’s “marketing strategy strayed from convention” so much that its “all-embracing marketing approach was unusual even during the so-called mass marketing era.”Footnote 41 Andrew Godley also finds that in selling sewing machines in the late nineteenth and early twentieth centuries Singer neglected at least two of the “four Ps” in the sacred “marketing mix,” namely price competition and product differentiation. Instead Godley attributes “Singer’s success in promotion” to “its direct selling organization knocking on people’s doors all around the world.”Footnote 42 From an EBM perspective, the history of Coca-Cola, Wrigley’s, and Singer would not be surprising, merely confirming that:
it was mass marketing (not CRM [customer relationship management], relationship marketing, or loyalty programs) that built the majority of today’s leading brands.Footnote 43
There is a rare and fleeting discussion that could just about be described as historical from an EBM perspective, although there is no actual periodization. This sets out the supposedly “typical view,” which EBM vehemently objects to, even though no actual sources are cited, “that marketing has passed through three stages”:
-
1 Mass marketing—when firms mass produce, mass distribute, and mass promote their single product to buyers.
-
2 Product-variety marketing—when firms produce two or more products that have different features, styles, quality, sizes, and so on.
-
3 Target marketing—when firms identify market segments, select one or more of them, and develop products and marketing mixes tailored to the people in each.Footnote 44
According to the adherents of EBM, there is no evidence to support the taken-for-granted argument that target marketing is superior to product-variety marketing. Furthermore, most examples of target marketing could easily be characterized as an extension of product-variety marketing.Footnote 45 In effect, the EBM position is that no historical periodization is possible, which is why no alternative to the “typical view” is offered. In all markets examined so far, purchasing patterns conform more or less to an NBD with 50 to 60 percent of purchases coming from the top 20 percent of buyers. There is no reason to think this would have changed in different historical contexts. Under such conditions, the only scope is for brands to offer greater product variety, or possibly less, and to ensure that the brand is memorable and readily available. The increasing profusion of products, facilitated by information technology in the twenty-first century, is seen by Tedlow as a fourth phase of marketing, with “hyper-segmentation” and marketers envisioning “every customer constituting a segment of one.”Footnote 46 From an EBM stance, this is merely a logical extension of product-variety marketing.
For marketing history, it could be helpful to have the terminology of product-variety marketing and NBD as alternatives to STP and the Pareto 80/20 law. This is illustrated by Denise Sutton’s research on the “innovative marketing strategies” that helped Mills & Boon become the world’s leading publisher of romance fiction. M&B targeted a particular market segment, namely “women who read the mass-produced and mass-consumed popular romance novels.” The publisher then “successfully offered a wide variety of options in terms of romance novel content, with a variety of story lines, and availability—the novels could be found in drugstores and grocery stores and ordered by mail.” Beyond noting that the targeted segment, women, turned out to be more diverse than was first thought, Sutton does not discuss segmentation. Instead, she focuses on M&B’s innovations in the production of romance novels, developing a network of women writers, and their distribution through direct marketing.Footnote 47 It could be said that M&B’s success derived from product variety and availability more than segmentation.
The search for precursors of segmentation can lead to misreading historical sources. Josh Lauer provides an interesting account of how handwritten ledgers were unwieldy for both marketing and credit control in retail.Footnote 48 The “filing revolution” in the late nineteenth century, with increasing use of card indexes and filing cabinets,Footnote 49 enabled retailers to keep systematic records of customers, especially those who bought on credit. In the 1930s, credit managers at retailers started using their files “to study the buying behaviour of customers already on their books.” This practice came to be known as “customer control.” According to Lauer:
Credit managers thus searched their files for inactive accounts and sent these customers letters urging them to return to the store.Footnote 50
On the face of it, this was almost the antithesis of the sort of market segmentation Lauer is looking for. The only thing these customers appear to have had in common was that they were inactive, and as such they were by definition light buyers, even if the letters they received were personalized.
Later on Lauer describes how in 1930 a survey was conducted in the USA:
of more than 10 department, specialty, and men’s clothing stores and reported that 40 percent of a store’s customers purchased 77 percent of its merchandise. Several years later, another study indicated that 16 percent of charge customers bought 49 percent of a store’s merchandise. These stunning findings not only reinforced the importance of courting one’s existing customers but also suggested that whole segments of the buying public were not worth the expense of engaging at all. Indeed [according to the survey] a full 60 percent of a store’s patrons produced little or no profit.
Lauer credits those conducting the survey with an intuition of what,
would become known as the Pareto principle, or 80/20 rule, famously codified by management consultant Joseph Juran a decade later. Applied to retailing, Juran’s concept of “the vital few and the trivial many” suggested that 20 percent of a store’s customers produced 80 percent of its sales. By this logic, a retailer was wise to direct his promotional effort to the small but profitable segment of regular customers rather than the “trivial many.”
Even so, Lauer reports that another clothing company “sought to revive a list of some 2,000 inactive customers by appealing directly to their superior credit status.”Footnote 51
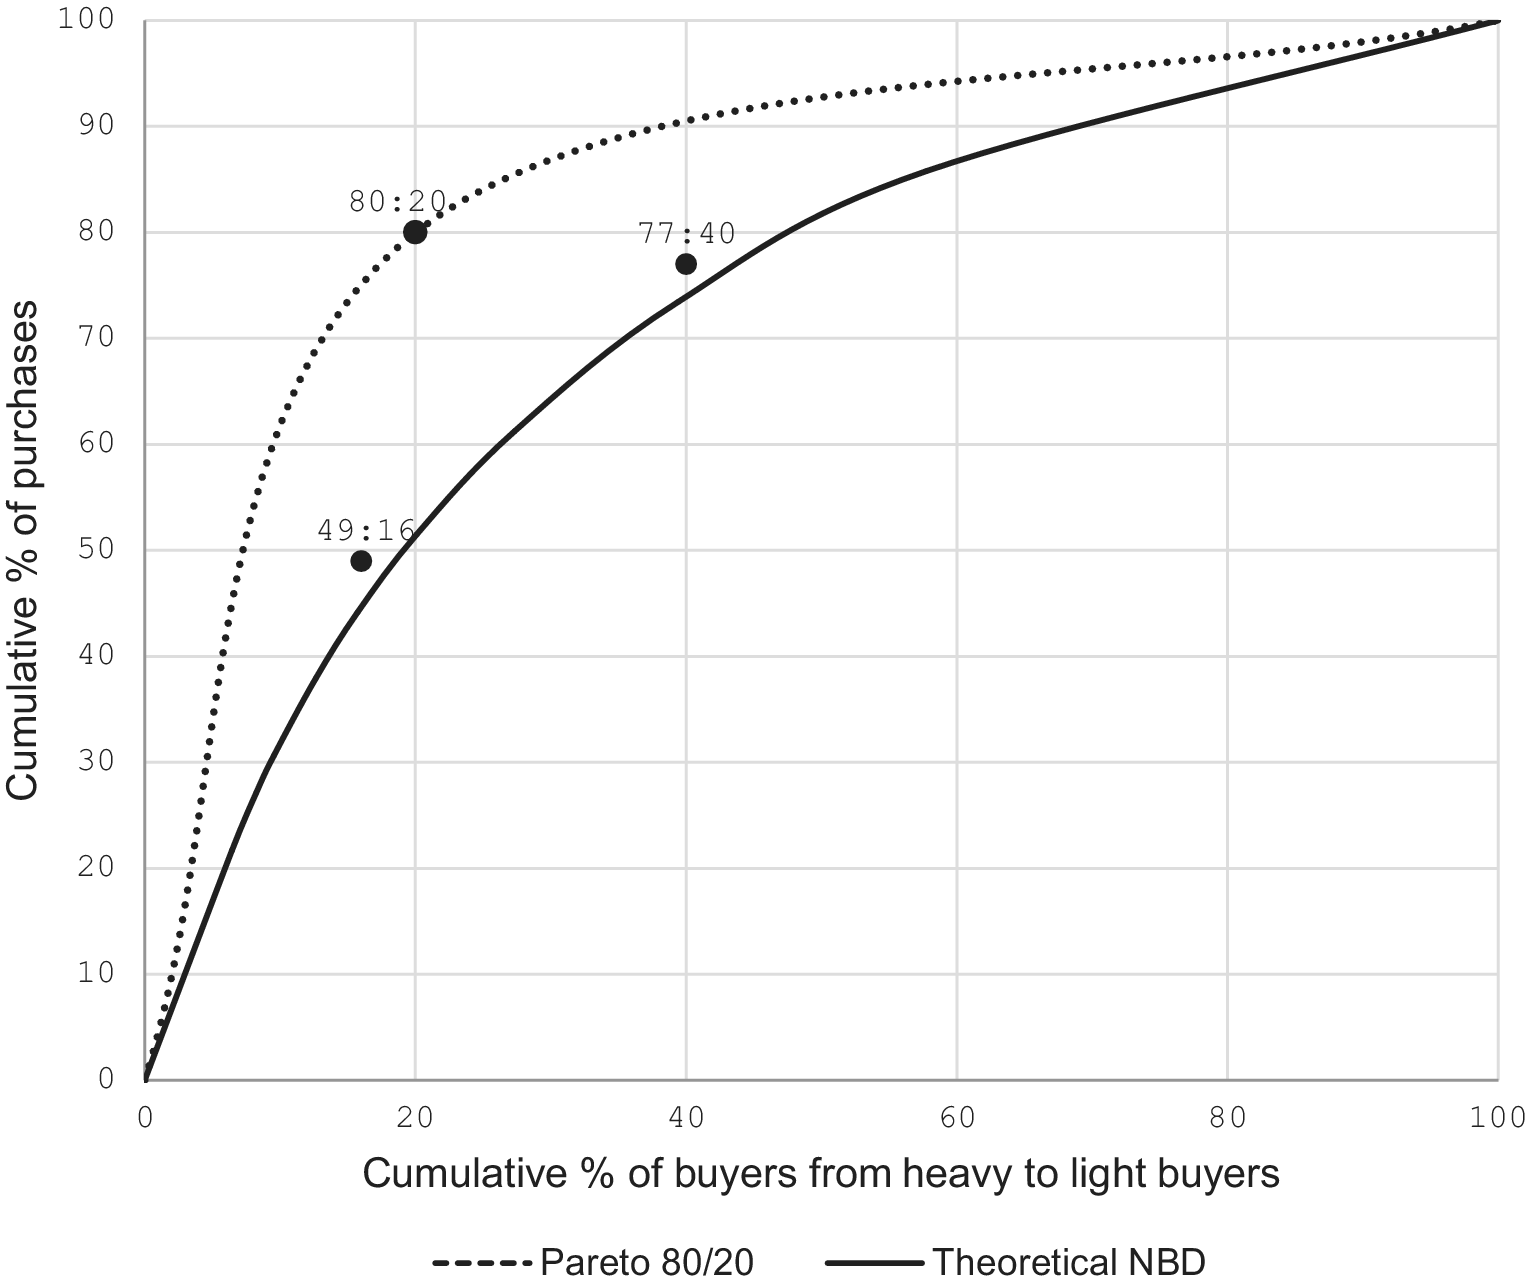
It is worth quoting Lauer at length because it clearly suggests that neither Lauer nor the distinguished editors of the book in which his chapter appears, The Rise of Marketing and Market Research,Footnote 52 had any inkling of EBM concerning the difference between an 80/20 Pareto distribution and a 60/20 NBD. For a start, it seems contradictory to claim that data was used to identify the “vital few” but then describe how records were successfully used to revive thousands of “inactive customers,” many if not most of whom were presumably part of the “trivial many.” Secondly, an awareness of the debates about whether the share of purchases from the top 20 percent of customers is 80 percent or 50 to 60 percent would have led Lauer to interrogate the data from the surveys he found from the 1930s more closely. It is not clear if the surveys only covered customers who had bought on credit. Nevertheless, on the face of it, if “40 per cent of a store’s customers purchased 77 per cent of its merchandise,” that is much closer to a 60/20 NBD than an 80/20 Pareto distribution, as indicated by Figure 3. This appears to be a case of interpreting marketing history through the prism of STP theory even when the evidence contradicts it.
Comparison of Pareto 80:20 distribution with a theoretical negative binomial distribution.
Note: The theoretical NBD is from Figure 2, which illustrates a typical NBD found in marketing. Lauer in “Making the ledgers talk” suggests that 49:16 and 77:40 anticipate a Pareto 80:20 distribution. In fact, they are closer to a typical NBD.

Figure 3. Long description
The x-axis represents the Cumulative percentage of buyers from heavy to light buyers, ranging from 0 to 100. The y-axis represents the Cumulative percentage of purchases, also ranging from 0 to 100.
Two curves originate at 0,0 and terminate at 100,100.
* The Pareto 80 20 curve is a dotted line that rises steeply, reaching approximately 80 percent of purchases at 20 percent of buyers, then levels off as it approaches the top-right corner.
* The Theoretical N B D curve is a solid line with a more gradual, concave-down trajectory, sitting below the Pareto curve for its entire length.
Three specific data points are plotted as black circles.
* Point 49 16 is located at approximately x equals 16 and y equals 49, sitting slightly above the solid N B D line.
* Point 80 20 is located at x equals 20 and y equals 80, sitting directly on the dotted Pareto line.
* Point 77 40 is located at approximately x equals 40 and y equals 77, sitting slightly above the solid N B D line but well below the dotted Pareto line.
The field of marketing history may not be appealing for adherents of quantitative EBM. Historical research is more aligned with qualitative methods in marketing,Footnote 53 and as with much business history,Footnote 54 marketing history largely consists of case studies using rich primary sources. Marketing historians readily acknowledge the difficulty of being able to “distinguish the typical from the exceptional cases.”Footnote 55 Tedlow specifically chose case studies as his preferred method for studying “the history of market segmentation” as opposed to “the measurement of all segmentation by all companies over an extended period of time,”Footnote 56 which sounds like an impossibility. It could be inferred that Tedlow had already decided he was going to find a history of segmentation rather than merely increased product-variety marketing, having deferred to STP theory from the outset. All of which confirms the impression that EBM has been overlooked, both in histories of marketing theory and marketing practice.Footnote 57 The archival research presented in this paper might provide the basis for a more constructive discussion of alternative perspectives in marketing history.
A Brief History of Henry Poole & Co
Wealthy bankers still boast about getting their suits made by Henry Poole & Co., “in business since Napoleon.”Footnote 58 Poole’s heritage is clearly important for customers. A brief history of the company can therefore be gleaned from various publications celebrating that heritage, as well as histories of fashion, tailoring and menswear that often mention Poole’s influence.Footnote 59 Stephen Howarth provides a concise narrative of the company in Henry Poole: Founders of Savile Row. He justifies the title in his introduction, where he maintains that:
Henry Poole & Co … is rightly regarded as the founding firm of Savile Row. It was not the first tailoring establishment to set up in the Row, so to give it this distinction may seem curious. But the two or three preceding firms were short-lived, and although some now operating there began earlier than Poole’s, they did so elsewhere and only came to the Row because of Henry Poole’s example.Footnote 60
As is often the case with the genre of corporate history, Howarth does not cite his sources, but it seems likely that he used the company ledgers for many of his anecdotes about Poole’s colorful clientele. Even though Howarth’s book could be seen as an example of corporate “rhetorical history,”Footnote 61 it does not seem to have been very strategic. The book was published in 2003 when a commissioned history might have been expected to appear closer to Poole’s bicentenary in 2006.
James Sherwood definitely used the ledgers for his more sumptuous, and slightly more skeptical volume, Henry Poole & Co: The First Tailor of Savile Row, his sixth published by Thames & Hudson, renowned for their beautifully illustrated books on art and fashion. Sherwood’s book was prominently displayed on the coffee table for customers in Poole’s Savile Row shop when the authors visited in 2024, along with an edition of the French men’s fashion magazine, Dandy, featuring an article on “Poole, Une Institution.” Sherwood’s brief account of the company is interspersed with extensive profiles of sixty famous customers, starting with King Edward VII (1841–1910) of Great Britain, Emperor of India, and Sir Winston Churchill (1874–1965). Sherwood selected sixty from the “500 people” that he identified in Poole’s ledgers “who significantly contributed to and helped shape world history.” He was employed by Poole’s as a curator to restore the customer ledger books, which were disintegrating, as well as “cataloguing and researching the illustrious names of famous and infamous men and women listed in the ledger books.”Footnote 62 His Hall of Fame on Poole’s webpages lists famous customers dressed by Poole’s such as Bram Stoker, Field Marshal Horatio Kitchener, and Prince Otto von Bismarck.Footnote 63
The founder, James Poole (1781–1846), and his wife Mary (1776–1862), moved from Shropshire to London, where James started a drapers shop in 1806. Toward the end of the Napoleonic wars in 1815 James Poole joined a volunteer corps of infantry. Howarth recounts how:
According to company tradition, the men of his corps were required to provide their own uniforms – not unusual a the time – and James and Mary together made his personal kit to such a high standard that others, including officers, asked for their own to be made by the same hands.
As a result, by the time of Napoleon’s final defeat at Waterloo in June 1815 James Poole was well on the way to becoming a “prosperous military tailor.”Footnote 64 Sherwood is dubious about the company lore “that James was not a tailor until 1815.” He observes that:
It is highly unlikely that James and/or Mary had never threaded a needle before being asked to tailor a military tunic in 1815 […] particularly one that won the admiration of the officer class.
James Poole had probably started making military uniforms soon after he moved to London.Footnote 65 Sherwood’s incredulity toward Poole’s company legend affirms his integrity and independence.
James Poole’s son, Henry (1814–1876), inherited the business in 1847 and gave it his own name. He then expanded it to become an international enterprise with ever more prestigious customers around the world. When Henry died in 1876, the trade magazine, Tailor and Cutter, described him as “head of the most noted tailoring firm in the world, both on account of its extent and the aristocratic element in its connection.” After Henry Poole’s death, the company was jointly owned by his sister Mary Ann Poole (1812–1879) and Samuel Cundey (1823–1883), who was the son of Henry Poole’s first cousin and became head of the firm. From then on, successive heads of the firm have been descendants of Samuel Cundey: Howard Cundey (1857–1927); Samuel Henry Howard (Sam) Cundey (1905–1981); Hugh Howard (1907–1980); Angus Howard Cundey (1937–2024); and Simon Goran Howard Cundey (1968–).Footnote 66
Poole’s specialized in bespoke tailoring for men. The term “bespoke” is believed to originate from when cloth for a suit was said to “be spoken for” by individual customers.Footnote 67 As described in Anderson’s detailed study of Poole’s elite male customers:
In bespoke tailoring a garment is ordered before it is made, so the beginning of the sales process is also the beginning of the design process. This involves deciding on the cut, style features, cloth and trimmings to be used. For nearly all orders between 1861 and 1900 Poole’s provided the cloth and the trimmings. Company literature and customer letters reveal that orders were placed either in person at the shop, through visits to customers’ homes, by letter, or through traveling representatives who received customers at foreign hotels.Footnote 68
In the Foreword to Henry Poole & Co, the Joint Managing Director of the company, Simon Cundey, wrote about the relationship between the business and its customers:
the garments we make for them are built to last. With designer ready-to-wear, for example, the purchase is made and thus ends your relationship with the brand. With Poole’s, a client can and does return to maintain or possibly alter a suit for whatever circumstance.
[…]
I was brought up in the family firm. I remember hearing clients’ names and then welcoming their grandsons three decades later … At Poole’s we understand that if we do our job correctly and with care, a client will be with us for a lifetime.Footnote 69
There are not many markets as rarefied as that of the bespoke tailors on London’s renowned Savile Row, as captured in a BBC television documentary from 2009. Albeit with an element of affectation, given the well-rehearsed “art of positioning luxury brands within a frame of heritage myths,”Footnote 70 one of the Savile Row tailors interviewed claimed that:
We don’t need to advertise because our reputation for very high class tailoring is very well known …. We’d like to say we’re a household name in the households we want to be known at.
Another tailor said that he did not advertise, “but people write about us,” presumably referring to the type of article on Poole’s in the Dandy magazine observed above. Yet another explained that he did not make any money from making uniforms for young military officers, but he hoped that they would become customers for life. The documentary described Mayfair, the exclusive part of London where Savile Row is located, as “The tribal home of the gentleman.”Footnote 71 All of which gives the impression that Savile Row has always relied upon a tradition of loyal custom from an exclusive wealthy elite rather than passing trade. In other words, the purveyors of luxury brands such as Henry Poole & Co tend to see themselves as uniquely dependent upon the loyalties of lifetime heavy buyers.
In conclusion, it is worth noting just how expensive Savile Row suits were in the early twentieth century and still are in the twenty-first century. In one of Sherwood’s previous books for Thames & Hudson, a lavish survey of Savile Row: The Master Tailors of British Bespoke, he mentions that, “A Henry Poole & Co. bespoke suit would have cost circa £6 in the Edwardian era: roughly the annual wage of lowly house servant or labourer.”Footnote 72 When interviewed for the Gentleman’s Journal in 2023 Poole’s Managing Director, Simon Cundey explained that, “The approximate price ranges from around £6,000 for pure bespoke, to around £2,000 for ‘made to measure’, to around £600 for ‘ready to wear’ … Pure bespoke is cut and made at Henry Poole, on the premises, with hand canvassing and four inches of extra inlays.”Footnote 73
Data Collection in the Poole’s Archive
As noted above, the original impetus for this study was the search for exceptions to the 60/20 law of purchasing patterns for brands. Luxury goods are often seen by their purveyors as exceptional in many respects, and it might be thought they are uniquely dependent on a core of wealthy heavy buyers. If luxury brands are a possible exception, then the various consulting firms, such as Bain & Company, with a specialty in luxury goods, might be a source of suitable data. As is clear from Bain’s website, however, the company’s reports are about category growth and the motivations of buyers, with nothing resembling the kind of longitudinal panel data that would be required to test for the NBD. For example, Bain’s luxury report for 2025 estimated that between 2022 and 2024 the worldwide market for the most expensive luxury goods had contracted from 400 to 350 million customers:
This contraction may have resulted in part from elevation strategies, which prioritized top-tier clients. These very important clients (VICs), who represent just over 2% of the total customer base, now account for 45% of global luxury purchases, up from 35% in 2021. However, VICs feel less pampered by brands, as their experiences have become more transactional.Footnote 74
The 45/2 distribution alludes to a Pareto Law but refers to the total market, not the purchasing pattern for a particular brand. This report from Bain is in line with other consulting firms who stress that luxury brands should focus on their heaviest buyers by emphasizing their exclusivity and distinctiveness, and not bother too much with the hoi polloi.Footnote 75
Finding that suitable contemporary data was not readily available from any of the consulting firms nor from luxury brands themselves, the possibility that firms could have historical data that might not be so sensitive, private, or protected was considered. Several luxury goods makers who had been in business for a long time were approached. Most did not have any relevant historical records, or if they did, they were not willing to grant access. After an extensive search, Henry Poole & Co. was identified as a company that had an archive that is open to researchers. As well as having an archive, Poole’s were friendly and keen to hear about any findings, and granted free access. There is no shortage of interesting articles in fashion magazinesFootnote 76; nevertheless, little is known about the actual purchasing of luxury clothing—how often people buy, how much they spend, and whether their buying behavior is stable over a year or a lifetime.
The “Poole’s Archive” features in the Heritage section of the Henry Poole & Co website.Footnote 77 The archive, henceforth Poole’s Archive, opened to researchers in 2015 and is held in a dedicated room at Poole’s shop on Savile Row. However, this sounds more grandiose than it actually is. For anyone familiar with the extensive well organized archives of large corporations such as Boots or Unilever, Poole’s Archive might come as a shock. There is no archivist, and no catalog. The Archive is kept in a musty, windowless room measuring roughly ten feet by ten feet in the basement of Poole’s Savile Row premises. Three walls are lined with shelves holding the ledgers and the index volumes, and the shelves on the fourth wall are stuffed with memorabilia. There is a stool to stand on to take the hefty ledgers down and a small desk in the cramped corridor outside where the material can be examined while standing up and making way for staff going past. Researchers are left to their own devices to rummage through the material. The Poole’s Archive would be better described as a collection of ledgers and other material of historical interest. The ledgers are clearly still used for heritage purposes, such as Sherwood’s book and the Hall of Fame on the company website, and must be of personal interest for members of the Cundey family. Even so, a case could be made that the collection should be transferred to a university or other publicly accessible archive where it could be properly cataloged and preserved for posterity.
The archive gives access to a comprehensive record of every customer purchase between 1846 and the 1950s. One of Poole’s directors, Keith Levett, reckoned the ledgers contain records of about 132,000 customers.Footnote 78 Clearly some kind of sample would need to be taken before any analysis of buyer behavior could be done. This would allow for a partial replication of the research done from an EBM perspective to test the distribution of buyers for a company. However, the data is limited to one company, so does not replicate full panel data, which means that there is no way of knowing whether Poole’s customers made purchases from other comparable luxury brands.
The mostly male customers have records from the day they were first introduced to the shop, to the day their death was noted in the ledgers, sometimes recording progression through aristocratic titles or military ranks.Footnote 79 As mentioned in the introduction, these records provide the basis for Anderson’s detailed historical study of how fashions for socially elite men reflected economic and cultural changes between 1861 and 1900. Anderson reckons that Poole’s “produced an average of 12,000 bespoke garments a year” during this period. She compiled a database from a sample of one thousand transactions recorded in the ledgers for just two selected years, 1861 and 1900, and only for customer surnames beginning with C and D. However, the database was used to identify interesting characters for case studies rather than any quantitative analysis.Footnote 80
Each of the 120-odd sales ledgers contains about a thousand pages of handwritten notes detailing customer names, titles, addresses, and records of every purchase they ever made, as well as notes on how the customer came to be introduced to the shop, and occasionally special requirements, such as “extra size,” or “must pay cash.” Each of the ledgers from about 1840 to 1869 contains all the entries for customer names beginning with a single letter, e.g., “B 1849-53.” Starting in about 1870, the ledgers are divided into series “1” through “9,” with 1870-73 in series 1, 1874-77 in series 2, and so on up to 1898-1900 in series 8, and 1900-1903 in series 9. After the turn of the century, the ledger numbering restarts with a second series “1,” but they cover longer periods, e.g., Series 1 E-K 1903-1917.
When an order was placed, an employee would check the index volume to see whether the customer had bought from Poole’s before, and if not, would start an entry in one of the open ledgers that were divided by alphabet: A-B, C-D, E-G, H-K, L-N, O-R, S-T, U-Z. For example, on March 16, 1889, Major J. Lawrence Rathbone of the Pacific Union Club, San Francisco, bought a suit and accessories for 12 pounds 9 shillings and 6 pence—his first purchase from Poole’s. This purchase and later payment were entered into the ledger for surnames O-R, Series 5, 1886-1889 on page 727. This is one of eight volumes in series 5 covering roughly 1885 to 1890. When he next came to buy clothing on July 30, 1896, he bought suits and accessories for 44 pounds 16 shillings and 6 pence. This order was entered on page 460 for surnames O-R, series 7, 1896-97. A note at the top of this entry points to the preceding entry in series 5, page 727, where there is a direction to the next record, i.e., back to July 1896. Thus Rathbone, and any other customer, can be tracked from purchase to purchase, even when those purchases are separated by several years. At the bottom of the entry on page 460 (series 7) is a newspaper clipping from May 4, 1907, saying that Rathbone had died in San Francisco after a brief illness at the age of sixty-three. There are many such clippings, sometimes accompanied by comments or notes in pencil about how outstanding accounts were to be settled.
Rathbone was a typical Henry Poole customer who purchased occasionally over the years. A very few customers made multiple purchases each year, year after year, and therefore occupy many pages in the ledgers. These are the type of customers who were more likely to have biographical information recorded and make interesting characters for case studies. But it was more common for a customer to have one or two entries, separated by a few years, as was the case for Rathbone. Each ledger note of previous and subsequent series and page makes it possible to identify when the customer first made an order, all the way through subsequent purchases until they ceased to be a customer.
In order to understand how Poole’s customers purchased their clothing, the first step was to examine the ledgers from various periods to assess completeness and legibility. This was necessary because some of the records for earlier years are difficult to decipher, due to illegible handwriting or damage to the pages. The ledgers from the 1880s onwards are in better condition and legible, so it was decided to extract samples for the period 1890–1899. This period is covered mostly by Series 6 ledgers for the early 1890s, Series 7 for mid 1890s and Series 8 for the late 1890s. The bulk of the selected entries therefore come from twenty-four ledgers, with a few additional entries from series 5 and 9 (where necessary) in order to provide a complete record of customers’ purchases for the whole decade.
When looking at the ledgers themselves, it is striking how variable the entries are—some customers bought a great deal, with records covering four or five pages, but in other cases, a single page might have complete entries for three or four customers, each of whom bought one or two items. Some customers’ records showed purchases for four or five years, all on one page, while others spread the same number of purchases across as many pages, sometimes over three or four ledgers. There was also variability in the ledgers themselves, as some had around 800 pages, while others held over 1,000 pages; some included two or three years of entries, while others held seven or eight years. In the end, the most reasonable sampling plan was to ensure that the customer records included were drawn as evenly as possible across the 1890s decade, and across the ledgers themselves. In practice, this meant selecting about five records for each one hundred pages of ledger, one from every twentieth page.
The intention was to sample from 1890 to 1899 and for the sample to come from all the ledgers in that time frame, which meant from all the letters of the alphabet. So the sampling started at the As and worked through the ledgers, making sure each was represented in the sample. The data collection started with the ledger from Series 6, 1888-91 for surnames A-B, starting on page 491 where the first record for 1890 was found. The first complete entry was chosen, the name and city were noted, and then the total amount spent for the year. Some customers’ records included a series of purchases over a year on multiple pages. In such cases, the purchases were totaled for the entire year. If the customer made subsequent purchases, these were indicated by series and page numbers, and so each purchase was noted until the last purchase in 1899. For customers with records starting in 1890, it was possible to move straight through the ledgers to 1899. However, for records starting later in the decade it was necessary to follow the notes to previous entries as well as to subsequent ones.
Records drawn from the last years meant tracking the purchases back through to preceding ledgers. In this way each customer’s purchasing for each of the ten years was noted, as were the page numbers for each recorded purchase. Note that “purchase amount” does not mean that money changed hands; each customer record carries a parallel set of figures totaling up the amount owing after each purchase, and also when payment was made. A few customers, including some very big spenders, settled their accounts very slowly, hence the comments against their names such as “must pay cash” or “limit £50” while others included directions to send bills to fathers or to a nation’s embassy.
From the sample it appears that about half the customers were European, about a quarter from the US and the rest from round the world. The general pattern for the Americans was to place an order in the early summer and then return for a fitting and additional items a few weeks later. In contrast, British customers and, to a lesser extent, other Europeans spread their purchasing throughout the year. When interviewed about the preliminary findings from this research, Poole’s Director Keith Levett observed that the current customer base looked much like the 1890s—a quarter British, a quarter American, and half from the rest of the world, showing remarkable consistency over 150 years.Footnote 81
Buyer Behavior From Poole’s Sales Ledgers
With the complete purchasing records for a total of 665 customers, each year of the decade and each ledger was reasonably well represented. The data were cleaned and translated from pounds, shillings, and pence to decimal fractions. The next step was to identify the purchasing pattern from the sample of 665 customers to see if it conforms to a typical NBD or an 80/20 Pareto distribution. Much research in EBM, including Ehrenberg’s original study, refers to prepackaged consumer goods, which can be counted fairly straightforwardly in panel data.Footnote 82 In fact, historically, individually wrapped products, such as confectionery, were referred to as “count lines,” as distinct from products that were sold by weight, and often bagged up by retailers. Sales of unique bespoke suits are almost by definition not so easily counted. Suits varied widely in price so that a customer who bought infrequently might still have spent more than a customer who bought more often. Therefore it seems sensible to consider both the frequency and value of purchases made by buyers in the sample.
Given that the sample of Poole’s buyers covers ten years, a convenient way to assess the frequency of purchases was to count the number of years in which each buyer made a purchase, that is, the number of purchase years per buyer. The analysis started with frequency counts of total numbers of customers who bought in each year from 1890 to 1899, how much they spent in each year, and how much they spent over the decade. Most customers did not buy every year, so the total number of years of purchasing per customer was also tallied, as was the total amount spent per customer, and the average spend per year per customer.
It is clear from the data that some customers bought an awful lot of clothing: some were prominent personalities; European aristocrats or military officers; others were dandies and clothes-horses. One such was Robert McCracken of London who made purchases of between £5.25 and £52.62 each year for the entire decade.Footnote 83 McCracken spent relatively modest amounts, but he was among only three percent of all buyers who made purchases in each of the ten years. At the other extreme, some customers appeared only once in the ledgers, buying a couple of suits and then disappearing from the record. An example is Meredith Whitehouse of Chicago, whose single purchase was in 1894 when he bought clothing for £12.20.Footnote 84 He was among the 25 percent of customers who only made a purchase in one year. The average number of purchase years per buyer over the decade was four. An example is Alfred Edward Harward of London who made purchases averaging about £25 per year in 1894, 1895, 1898 and 1899.Footnote 85 On average, those who only made purchases in one year during the period paid £27.30, which is almost exactly the same as those who made purchases in four years during the period and paid on average £27.80.
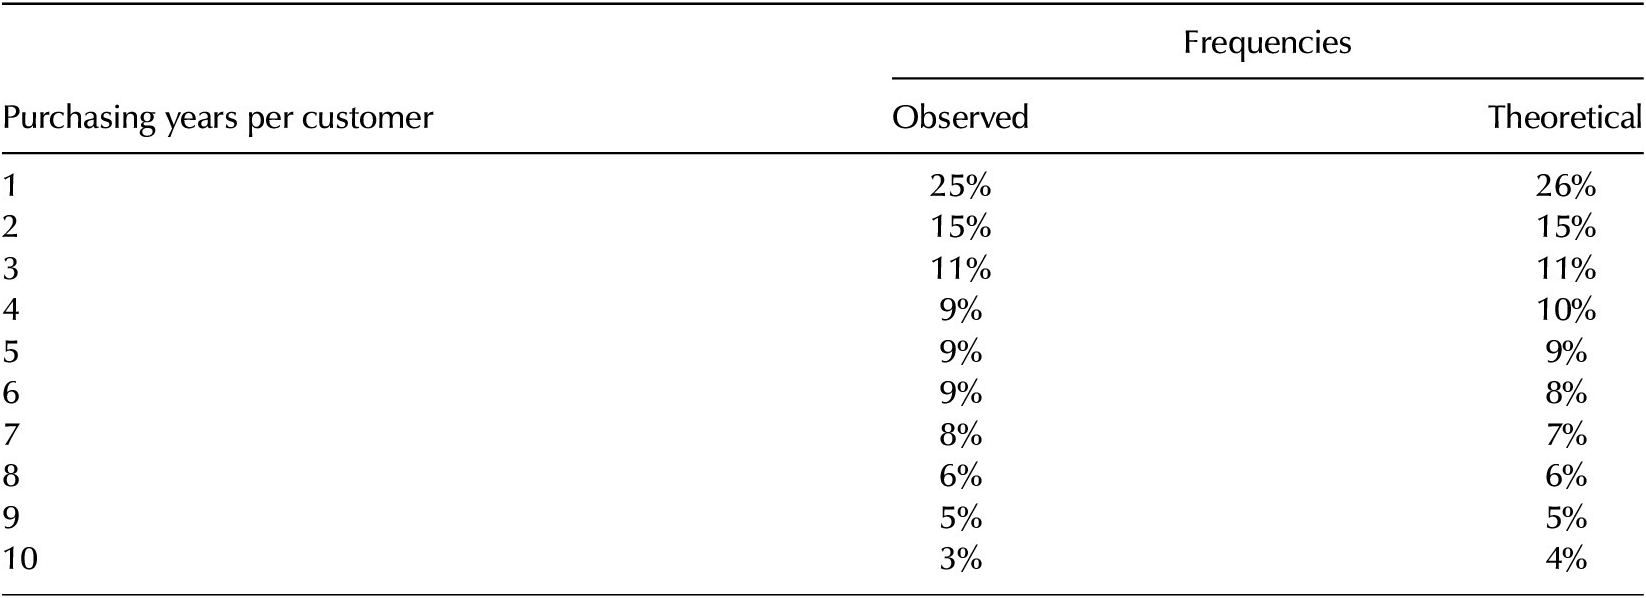
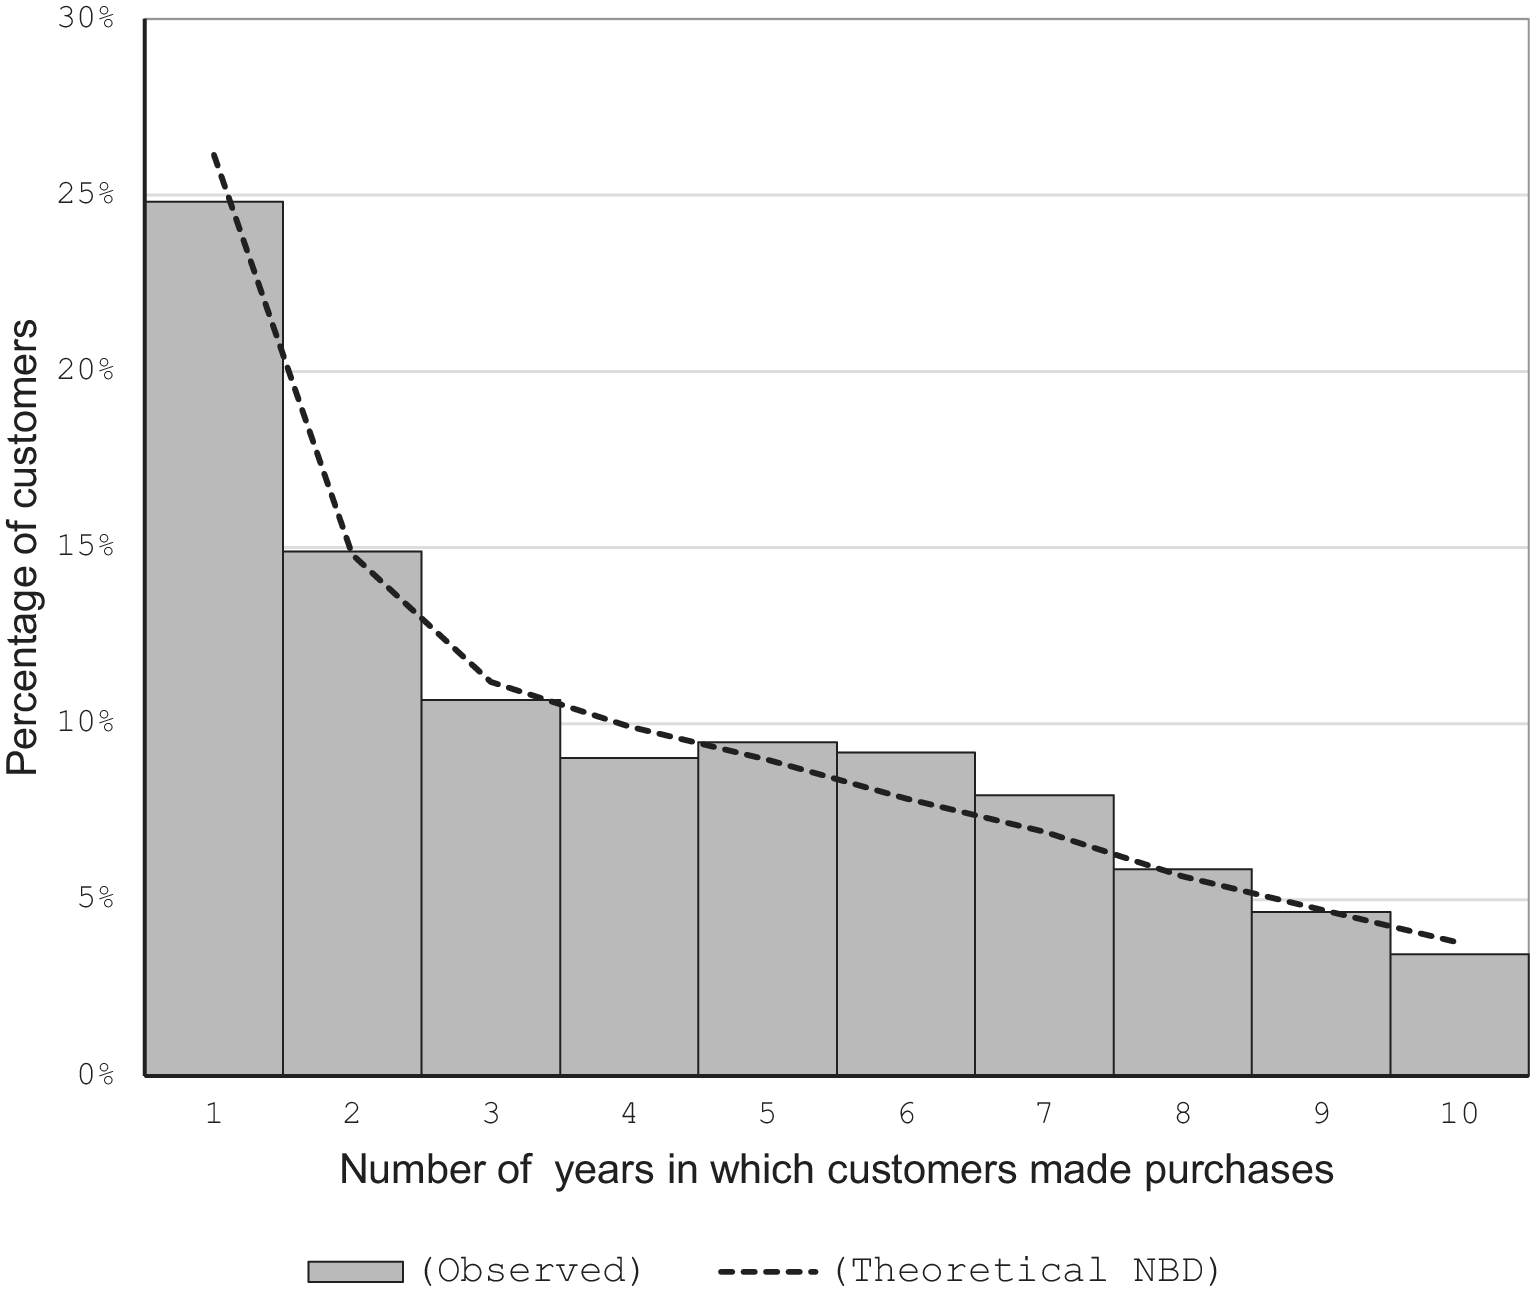
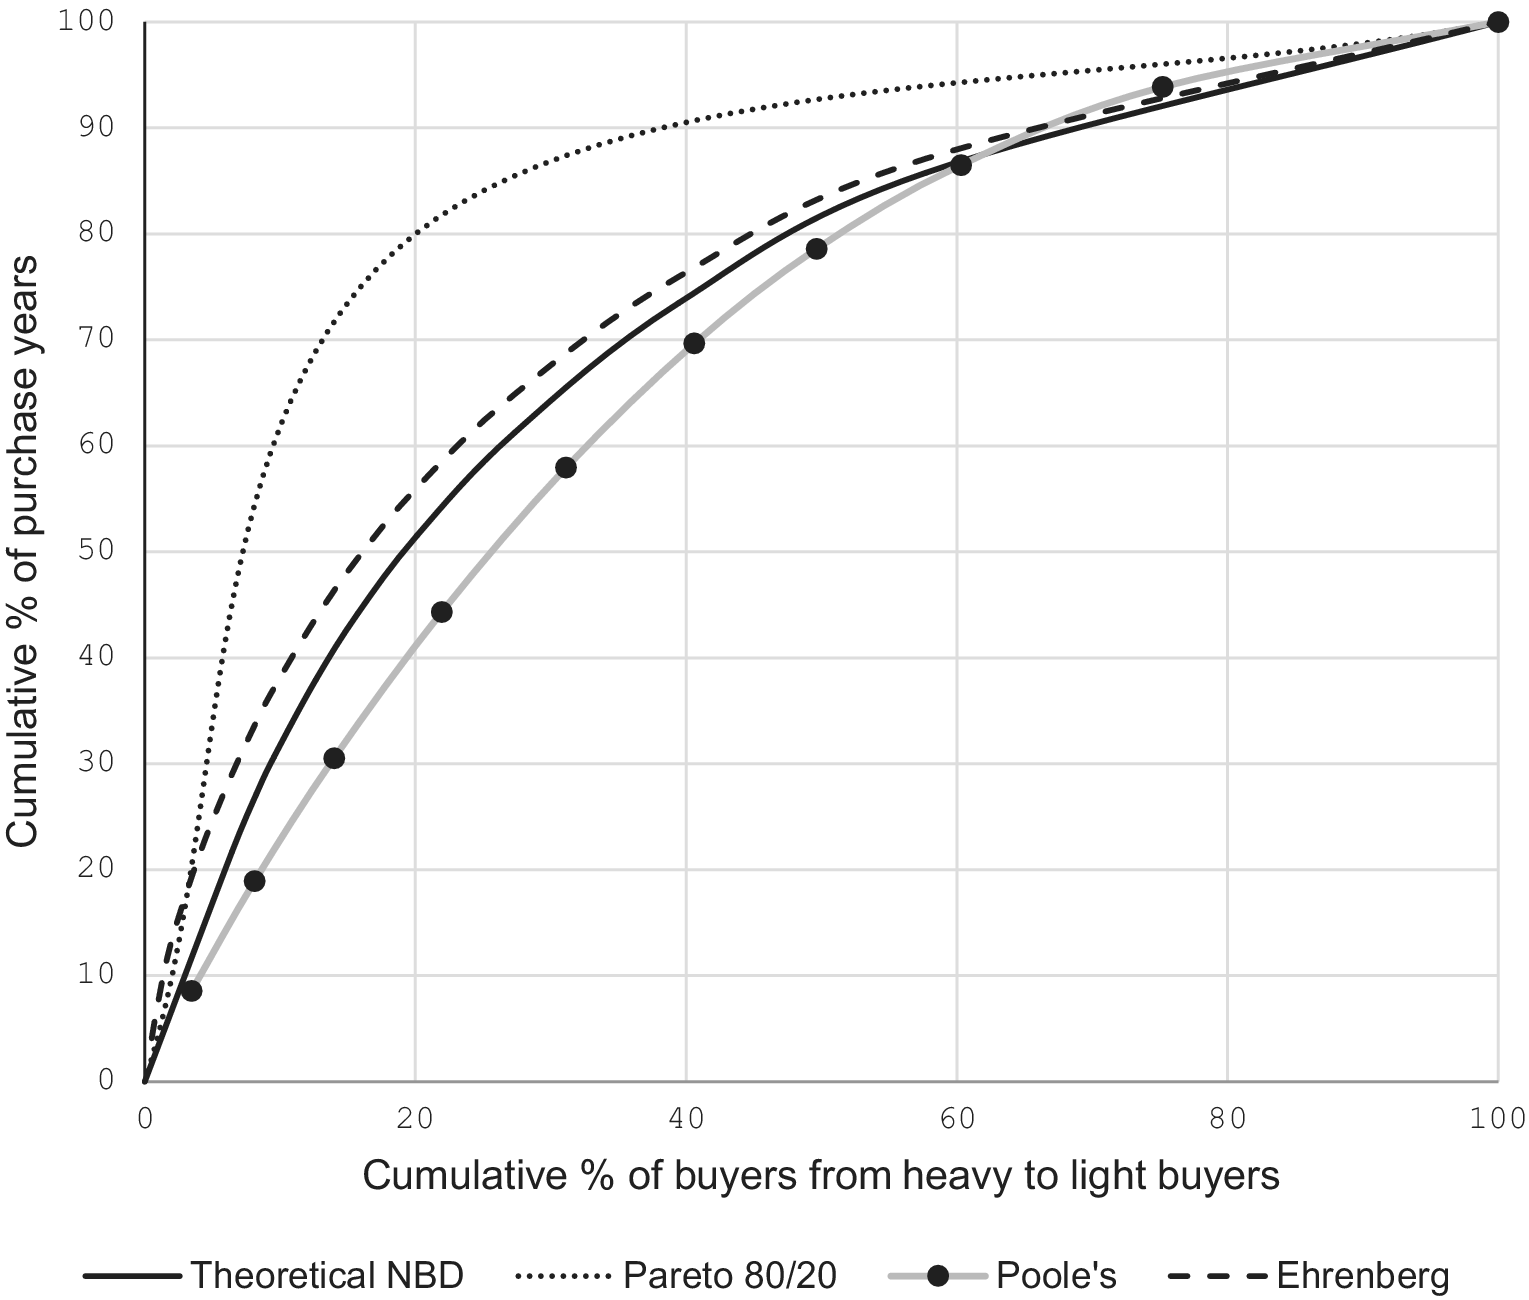
Taken together, the sample data suggests that there were many light or occasional buyers, fewer regular every-other-year buyers, and a few whales who bought several times per year for years at a time. Over the decade, 25 percent of customers only purchased in one year, 15 percent purchased in two years, 11 percent in three years, and so on, as shown in Table 2.Footnote 86 This is typical of an NBD, as would be expected from an EBM perspective, as can be seen in Figure 4. As the cumulative concentration curves in Figure 5 indicate, the purchasing pattern of Poole’s buyers in the 1890s was way off from anything resembling a Pareto 80/20 distribution. The 22 percent who bought in the most years accounted for 44 percent of the total number of purchase years. A similar exercise was performed using the value of purchases: the amount spent per year, and over the entire ten-year period per person.
Number of years in which each customer purchased from Poole’s between 1890 and 1899 compared to the number predicted by a theoretical negative binomial distribution

Table 2. Long description
The table consists of three columns: Purchasing years per customer, Observed Frequencies, and Theoretical Frequencies. The data is as follows:
* 1 year: Observed 25 percent, Theoretical 26 percent.
* 2 years: Observed 15 percent, Theoretical 15 percent.
* 3 years: Observed 11 percent, Theoretical 11 percent.
* 4 years: Observed 9 percent, Theoretical 10 percent.
* 5 years: Observed 9 percent, Theoretical 9 percent.
* 6 years: Observed 9 percent, Theoretical 8 percent.
* 7 years: Observed 8 percent, Theoretical 7 percent.
* 8 years: Observed 6 percent, Theoretical 6 percent.
* 9 years: Observed 5 percent, Theoretical 5 percent.
* 10 years: Observed 3 percent, Theoretical 4 percent.
Percentage of 665 Poole’s buyers who bought in one or more years 1890–99.

Figure 4. Long description
The y-axis is labeled Percentage of customers and ranges from 0 percent to 30 percent in increments of 5 percent. The x-axis is labeled Number of years in which customers made purchases and is numbered from 1 to 10.
Observed data is represented by gray bars. The values are approximately
* 1 year: 25 percent
* 2 years: 15 percent
* 3 years: 11 percent
* 4 years: 9 percent
* 5 years: 9.5 percent
* 6 years: 9 percent
* 7 years: 8 percent
* 8 years: 6 percent
* 9 years: 5 percent
* 10 years: 3.5 percent
A dashed line represents the Theoretical N B D model. It begins at approximately 26 percent for year 1 and follows a steep exponential decay curve that intersects the top of the bar at year 3. From year 4 to year 10, the dashed line continues a gradual downward slope, staying slightly below the observed bars for years 4 through 7 and aligning closely with the bars for years 8 through 10.
Cumulative percentage of Poole’s buyers making cumulative percentage of purchases in one or more years: comparing observed data from Poole’s with the predicted negative binomial distribution and Pareto 80/20 distribution.
Note: Cumulative concentration curve from Ehrenberg superimposed for comparison.

Figure 5. Long description
A line graph plotted on a grid from 0 to 100 on both axes. The X axis is labeled Cumulative percent of buyers from heavy to light buyers. The Y axis is labeled Cumulative percent of purchase years.
Four curves originate at the 0,0 origin and terminate at the 100,100 point.
* The Pareto 80/20 curve, shown as a dotted line, is the most concave, rising sharply to reach 80 percent on the Y axis when the X axis is at 20 percent.
* The Ehrenberg curve, shown as a dashed line, sits below the Pareto line, reaching approximately 65 percent on the Y axis at the 20 percent mark on the X axis.
* The Theoretical N B D curve, shown as a solid black line, follows a similar path to the Ehrenberg curve but sits slightly lower.
* The Poole’s data, represented by a solid grey line with circular data points, is the least concave, sitting closest to the theoretical linear diagonal. At the 20 percent mark on the X axis, it reaches approximately 45 percent on the Y axis.
A legend at the bottom identifies the four series: Theoretical N B D (solid black line), Pareto 80/20 (dotted line), Poole’s (grey line with dots), and Ehrenberg (dashed line).
Examining the totality of the customer base as opposed to a few prominent heavy buyers shows that an individual purchase by a customer was a fairly rare event—only about 40 percent of the customers sampled from 1890 to 1899 made a purchase in any given year, while 60 percent did not. More tellingly, the customers who only bought in one year over the decade outnumbered those who bought every year by eight to one. In detail, the average annual spend by the sample of Poole’s customers between 1890 and 1899 was £45 per year per customer, with a maximum of £745 and a minimum of £0.12.Footnote 87 These figures exclude those who did not make a purchase during the year. Over the entire ten-year period, the average spend per customer was £184, and the maximum was £4,346.Footnote 88 The most frequent buyers in terms of purchase years accounted for 56 percent of the total spend. However, the 20 percent of the heaviest spenders made up 61 percent of sales by value. In a nutshell, the heavy buying 20 percent bought more often than average, and spent a bit more than average when they did so; nearly half of Henry Poole’s business in the 1890s was generated by its least loyal, least regular, and lowest spending customers. This is well within the range expected from previous EBM research, even for a highly exclusive luxury good over a long period of time where something approaching an 80/20 Pareto distribution might have been expected.
The average spend for customers in the research sample can be compared to the figures given for some of the sixty “illustrious” customers in Sherwood’s Henry Poole & Co. About a dozen of them were listed as “patrons” during the 1890s. The biggest spender was Miss Catherine “Skittles” Walters (1839–1920), described by Sherwood as “the last of the great Victorian courtesans.” Her “patronage” ran from 1863 to 1906 and during that time her total spend was £10,495. Not far behind was the banker and industrialist J. P. Morgan (1837–1913): patronage 1876–1916Footnote 89; total spend £9,690. Bram Stoker (1847–1912) was closer to the average for the 1890s: patronage 1893–1901; total spend £201.Footnote 90 Focusing on famous patrons may reinforce the impression that the company was reliant on its heavy buyers. However, it is clear from the evidence that Henry Poole’s celebrity patrons in the 1890s were not representative of the company’s broader customer base.
Conclusions: Evidence-Based Marketing; Henry Poole & Co; Marketing History
This research was motivated in the first instance as a way to test whether the NBD holds in a very different type of market to the fast-moving consumer goods which have been studied extensively, namely luxury tailoring. The research sought to confirm whether the 20 percent of heaviest buyers accounted for just over half of sales, and not the 80 percent as is assumed from the 80/20 Pareto Law.Footnote 91 The data sampled from the ledgers of the luxury tailor Henry Poole & Co from 1890 to 1899 reveal that the Victorian customers bought in patterns that conform to the expectations of buyer behavior predicted by an NBD, with 20 percent of buyers accounting for 61 percent of sales by value. This confirms that the 60/20 NBD not only applies in a different historical context but also for a highly exclusive customized luxury brand which might have been expected to be an exception. The study therefore represents a highly differentiated replication for the purposes of EBM.
From an EBM perspective, the research on Poole’s could be extended by finding further historical data to replicate the analysis of buyer behavior in other times, categories of goods, other markets, or other countries. For example, the UK has 110 livery companies comprising ancient and modern trade associations and guilds, also known as the “Worshipful Company” of a particular craft or profession. These livery companies play a significant role in the life of the City of London through charitable giving and networking opportunities. They could be contacted to find out if they maintain archives, or have directories of archives where sales have been recorded in sufficient detail to be analyzed with the techniques used to examine Poole’s ledgers.Footnote 92 There is scope for further research examining the marketing history of various brands where previously the 80/20 Pareto rule was implicitly assumed.
If this research had been presented for an EBM readership as a differentiated replication, then the company, and even the specific product, might have been anonymized, as in Ehrenberg’s original research. Ehrenberg simply referred to a non-specified, pre-packaged, branded, non-durable consumer good. There is no reference to the date or location of the data collection, only that it was for a 26-week period. His purpose was an exposition of the NBD and its potential application to marketing. The novelty of the data from Poole’s is that it was actually compiled by the researcher, laboriously, from the records of actual sales in the archive, not downloaded as a readymade spreadsheet from a third party. What is more, as the records are over a hundred years old, they are not commercially sensitive. It therefore made sense to try to present the findings in a format that would be accessible to marketing and fashion historians by naming the company, Henry Poole & Co., and to put it into some historical context.
Having named the company and offered a brief history of Poole’s as a prelude to analyzing the purchasing pattern of its customers in the 1890s, it would be all too tempting to present the company as an object lesson for EBM. There is little evidence of how marketing was thought about at Poole’s in the late nineteenth century, but from the company’s longevity it could be inferred that its efforts to attract new customers must have been compatible with the tenets of EBM, albeit unknowingly. On the one hand, Poole’s extended credit to wealthy customers, which nearly led to its downfall under Henry Poole himself, possibly in the mistaken belief that it was more dependent on such customers than it actually was. On the other hand, as mentioned by the fashion historian Fiona Anderson, during the nineteenth century Poole’s used “traveling representatives who received customers at foreign hotels.”Footnote 93 Poole’s Joint Managing Director also noted that, “It is important for our clients to know that the garments they are measured up for, be that in Atlanta or Zurich, are cut and made on the premises at No. 15 Savile Row.”Footnote 94 This refers to the so-called “Trunk Shows” which Poole’s continues to organize “all over Europe, the Americas and the Far East.”Footnote 95 However, this didactic approach would reduce history to a tautology: if a company was successful, then its marketing practices must have conformed to the precepts of EBM. Little or no reading of the relevant historiography would be required, and it would reinforce a view that most academic marketing concepts are irrelevant for marketing practice. A less presumptuous approach would be to consider how the NBD purchasing pattern of Poole’s customers relates to previous research on the company.
Anderson’s study is the only other research from the Poole’s Archive published in an academic journal, Fashion Theory. Her “analysis of the design, making and consumption of tailored garments from Henry Poole and Co.” focuses on two particular years, 1861 and 1900. Anderson is not trying to explain Poole’s longevity, as a business or marketing historian might be tempted to do. Instead she explores how the “collaborative design process” for bespoke clothing, in “an all-male environment,” enabled Poole’s wealthy customers to negotiate the “complex and ambiguous‥ shifting tensions between late-nineteenth century class identities, masculinities and fashion.” Anderson observes from the archive that, “the small group of customers who were purchasing most shifted from British patricians in the main in 1861 to principally the American wealthy in 1900.” This leads her to present case studies of two individuals—a Scottish aristocrat for 1861; and an American financier for 1900—as representatives of “the ‘model’ customer” from each period.Footnote 96 As with Sherwood’s history of the companyFootnote 97 and Poole’s Hall of Fame,Footnote 98 Anderson may have been misled by the salience of its most prominent customers. Although some of the aristocrats and financiers certainly spent a lot as individuals, it is clear from the findings presented in this paper that they were not typical. Much of Poole’s revenue, well over half, came from customers each of whom spent a lot less. It is not possible to make inferences about the wealth or income of Poole’s customers from the ledgers, but as proponents of EBM point out, “Despite what can seem like outrageous prices, luxury brands get most of their sales from the middle class, not a small cadre of billionaires.”Footnote 99
This article has made the case that STP theory has been accepted uncritically in marketing history, as it is to some extent in fashion history, even when the evidence appears to contradict it.Footnote 100 STP is predicated upon an assumption that a segment of heavy buyers can be identified and targeted, as suggested by the 80/20 Pareto Law applied to marketing. Hopefully, the presentation of historical findings from archival research which contradict the 80/20 Pareto Law will prompt marketing historians to reconsider their deference to STP theory. The alternative EBM perspective suggests there is a near-universal law of a 60/20 NBD of purchasing for brands. It is not clear how much of marketing history would need to be revised if this were to be accepted. Advocates of EBM tend to maintain that STP theory is generally accepted simply because it is widely disseminated as the conventional wisdom in textbooks and taught in most business schools, which amounts to saying that it is accepted because it is accepted. A more historical explanation would be desirable.
Much of the debate over periodization in marketing history hinges on when and how the transition to segmentation took place in marketing theory and practice. The underlying assumption is that there has always been an 80/20 Pareto distribution. Then, by a process of trial and error, segmentation was discovered and disseminated, and later incorporated into STP theory, as it was realized that the 80/20 Pareto Law could be leveraged for competitive advantage. This must be appealing for marketing practitioners and theorists since it attributes enormous agency to them as historical actors, and hence enhances the relevance of marketing historians. If the 60/20 law of NBD is accepted, then a corollary is that increasing product variety is the result of product innovation, mundane improvements in productivity, and greater prosperity of consumers, rather than revelations of segmentation and differentiation for targeting heavy buyers. This may well be less appealing for marketing practitioners and theorists and undermine debates about the periodization of segmentation in marketing history. Following on from this, many of the outstanding corporate histories that focus on marketing could be re-read to examine how far their narratives are informed by STP and how much they might change if they took into consideration a 60/20 distribution of purchasing.Footnote 101 This is not to say that the teleology of EBM should be substituted for the teleology of STP. Finally, marketing historians need to explain how STP theory came to be so widely accepted in the latter half of the twentieth century, while Ehrenberg’s insights from the NBD were largely overlooked.
Acknowledgment
We would like to thank Henry Poole & Co for permission to consult Poole’s Archive.



 Open access

