I. INTRODUCTION
Nanocrystalline metals and ceramics have attracted considerable interests in the past decade due to the observation and expectation of their high strength, high hardness, and good fatigue resistance. Reference Meyers, Mishra and Benson1–Reference Wang, Chen, Zhou and Ma13 However, nanocrystalline materials show low ductility at room temperature, Reference Meyers, Mishra and Benson1,Reference Shan, Knapp, Follstaedt, Stach, Wiezorek and Mao14–Reference Hasnaoui, Van Swygenhoven and Derlet16 which limits their applications. Thus, it is very important to understand the fracture mechanisms operating in these systems. In nanocrystalline metals, a fracture surface is characterized with dimpled structures whose sizes are larger than the grain size. Hasnaoui et al. Reference Hasnaoui, Van Swygenhoven and Derlet16 used molecular dynamics to simulate the fracture process of nanocrystalline nickel and their results suggested that the formation of local shear planes contributed to the dimpled characteristics on the fracture planes. Shan et al. Reference Shan, Knapp, Follstaedt, Stach, Wiezorek and Mao14 conducted in situ tensile straining on nanocrystalline nickel in a transmission electron microscope (TEM). Grain agglomerates were found to form rapidly and frequently ahead of an advancing crack, which was used to explain the formation of dimpled structure. However, there are few reports on fracture mechanisms of nanocrystalline ceramics. It has been proposed that nanocrystalline ceramics consist of a large portion of grain boundary (GB) atoms compared with nanocrystalline metals Reference Szlufarska, Nakano and Vashishta17 and the mechanical properties and fracture mechanisms of nanocrystalline ceramics are mainly determined by the amorphous and soft GB phases. GBs act as preferable places for crack nucleation and propagation, because of their low atomic density and weak interatomic bonds. Ovid'Ko et al. Reference Ovid'ko and Sheinerman18–Reference Ovid'ko, Sheinerman and Alfantis21 constructed theoretical models to study the deformation and fracture mechanisms of nanocrystalline ceramics. Their models suggested that stress-induced GB sliding and migration serve as the toughening mechanisms. Pozdnyakov and Glezer Reference Pozdnyakov and Glezer22 theoretically examined the fracture toughness of a quasibrittle nanomaterial and concluded that plastic deformation carried by GBs can significantly increase the fracture toughness of nanocrystalline ceramics. However, so far, there is a lack of experimental evidences on how GBs contribute to the fracture dynamics, how the crack propagates, and what toughening mechanisms are behind nanocrystalline ceramics.
Fracture toughness in general serves as an important indicator of the reliability of structural materials. For bulk materials, the method to measure fracture toughness is well-established by following the standard ASTM procedures. However, these methods are not compatible with in situ monitoring of microstructure using TEM, which requires a thin film. There has also been a lack of a universal methodology to measure the fracture toughness of thin films. Numerous techniques were applied to evaluate the fracture toughness of thin films, including indentation, Reference Wei, Bhushan and Jacobs23 tension, Reference Gu, Wu, Zhang, Srolovitz and Greer24,Reference Kumar, Li, Haque and Gao25 and buckling. Reference Huang, Chen, Wang, Yu and Chen26,Reference Wang, Yu and Huang27 Those measurement methods for fracture toughness rely on testing thin films deposited on metallic or Si substrates. Because of substrate effect and difficulties in fabricating specimens and applying external stress, there are considerable uncertainties in the measured values, Reference Zhang, Sun, Fu and Du28 and the origin of these variations may be also due to different deformation and failure mechanisms of thin films. Recently, bending experiment performed in a scanning electron microscope (SEM) Reference Jaya, Jayaram and Biswas29–Reference Matoy, Schonherr, Detzel, Schoberl, Pippan, Motz and Dehm31 avoids the substrate effect, but the deformation and fracture mechanisms were not identified. Therefore, it is necessary to measure the fracture toughness and investigate the accompanying deformation and failure mechanisms in thin films using TEM.
Here, we report a study of fracture mechanism in nanocrystalline TiN thin films based on a new method to evaluate the conditional fracture toughness by in situ testing under TEM. In situ TEM provides valuable information on the evolution of microstructures during deformation and failure, which is not accessible by other methods including in situ fracture toughness measurements performed with SEM (Refs. Reference Jaya, Jayaram and Biswas29 and Reference Mueller, Pejchal, Žagar, Singh, Cantoni and Mortensen32–Reference Yawny and Perez Ipina34) or optical microscopy. Reference Zhang and Zhang35 Though in situ TEM has been applied to study crack propagation behavior, the major focus was on nanocrystalline metals. Reference Shan, Knapp, Follstaedt, Stach, Wiezorek and Mao14,Reference Kumar, Li, Haque and Gao25 Our study focuses on nanocrystalline TiN to gain important insights into the deformation mechanism of nanocrystalline ceramics. Nanocrystalline TiN thin films were selected for this study because their applications in coatings have attracted great interests due to their excellent mechanical properties, e.g., high hardness and high strength, high chemical stability, low electrical resistivity, and high biocompatibility. The current and potential applications of TiN thin films include hard and corrosion protective coatings on mechanical tools and prosthetic devices, antierosion coatings on aerospace components, conducting coatings on the counter electrode of flexible dye-sensitized solar cell, Reference Chen and Wu36 and diffusion barriers in microelectronic components, where fracture toughness is one of the most crucial properties.
II. EXPERIMENTAL METHODS
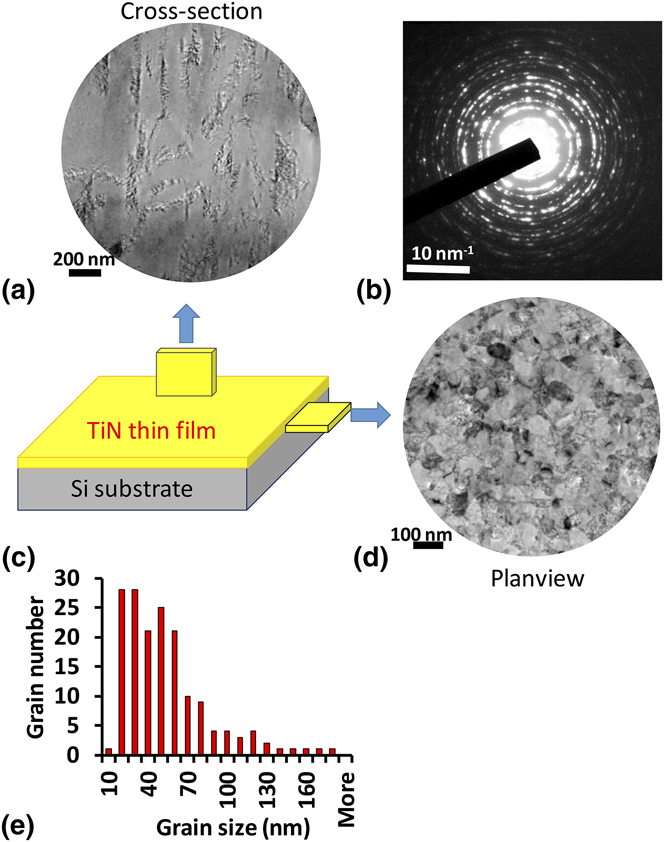
Nanocrystalline TiN thin films were prepared by unbalanced magnetron sputtering. The cross-sectional SEM images indicate that the film is ∼4.5 μm thick. The technical details can be found in Ref. Reference Wang, Yu and Huang27. The as grown films were characterized by x-ray diffraction and x-ray photoelectron spectroscopy, and the crystal structure and N/Ti ratio were also listed in Ref. Reference Wang, Chuang, Yu and Huang37. Figure 1 shows the plan-view and cross-sectional bright field TEM images of the TiN thin films. From the plan-view image, the TiN film has nanometer-sized and equiaxed grains. The distribution of grain sizes in the plan-view direction is measured from ∼166 grains, which is shown in Fig. 1(e). The average grain size is 48.1 nm. The cross-sectional image indicates that the film has columnar grains along the growth direction (perpendicular to the film). To investigate the deformation and failure mechanism of nanocrystalline TiN films with equiaxed grain distribution, the beam specimen was prepared in the plan-view direction, as shown in Fig. 2. The sample was taken from the middle part along the thickness direction of TiN thin films by focused ion beam (FIB).
Characterization of TiN thin film specimen. (c) Schematic figure of the sample geometry, and corresponding plan-view (d) and cross-sectional (a) bright field TEM images. The selected area diffraction pattern is taken from plan-view sample and shown in (b). (e) The grain size distribution of TiN film in plan-view direction.

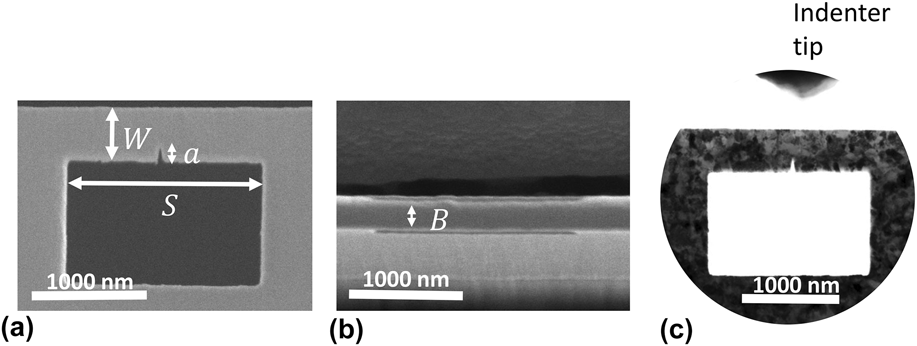
(a) and (b) show the SEM images for a TiN beam prepared using FIB for three point bending test. The sample geometry is as follows: W ⋍ 400 nm, S ⋍ 1600 nm, a ⋍ 100 nm, and B ⋍ 200 nm. (c) A TEM bright field image of the prepared beam. The contrast is enhanced to show the microstructure of the TiN thin film.

For in situ fracture toughness measurement, we followed the ASTM E399 three-point bending test standards, and fabricated a beam specimen with the dimensions along horizontal, depth, and thickness directions of ∼1600 nm × ∼400 nm × ∼200 nm, as shown in Fig. 2, using a dual-beam FIB (Helios 600i, FEI). The Ga+ ion beam was controlled from 30 kV and 2.3 nA to 5 kV and 7.7 pA during the fabrication of the beam specimen. There is very little grain overlap along the thickness direction due to the TiN film columnar grain structure (see Fig. 1). This is further confirmed by the orientation mapping performed using scanning electron nanobeam diffraction (SEND) on the beam specimen [see Figs. 5(b) and 6(b)]. A notch of length ∼100 nm at the middle of the beam acts as a precrack for stress concentration and initiation of the crack. The radius of curvature at the notch tip was around 10 nm. The notch was fabricated using 30 kV and 7.7 pA Ga+ ion beam in FIB. Since the test specimen is made entirely of TiN film, we avoid the substrate effect on the fracture toughness measurement. Also, no microcracks or flaws before fracture testing were observed from TEM imaging.
The bending test was performed using a Hysitron PI95 picoindenter TEM holder equipped with a cube corner diamond indenter. The experiment was carried out in displacement-control mode under 2 nm/s displacement rate. The indenter applied a bending force at the middle of the beam until the crack started to propagate. Ten beams were tested in total.
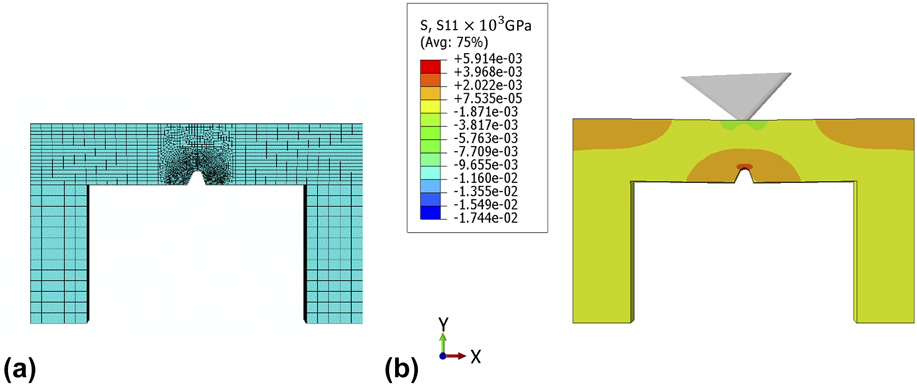
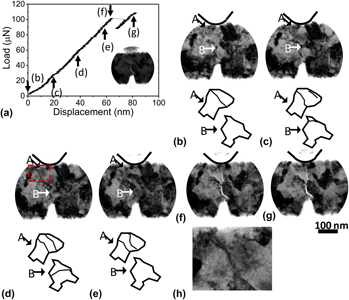
Finite element analysis software Abaqus 6.13 was used to calculate the conditional fracture toughness of all ten experiments. In the simulation, the bending test was simulated using a rigid cube corner indenter with tip radius ∼45 nm (measured from TEM images) and a TiN beam with an elastic modulus of 395 GPa, Poisson's ratio of 0.21, Reference Wang, Chuang, Yu and Huang37 and a yield stress of 7 GPa. Reference Ma, Huang and Chen38 The effect of the plastic penetration effect from the cube corner diamond indenter was accounted for in the simulation. The beam geometry before bending and mesh used for simulation are shown in Fig. 3(a). All the dimensions in the simulation were based on the measurements from SEM and TEM images, including the span, width, thickness of the beam, and the shape of the notch. Boundaries are encastered at the two end surfaces of the beam. The experimentally measured upper load marked by arrow (f) in Fig. 4(a) at which crack starts to propagate was used to simulate the stress distribution. The stress near the notch tip was used to calculate the conditional fracture toughness based on the stress method in Ref. Reference Chan, Tuba and Wilson39.
(a) The beam geometry and mesh used in the FEM simulation. (b) σxx (S11) tensile stress contour plots obtained from FEM simulation at the fracture load, plotted in shaded color.

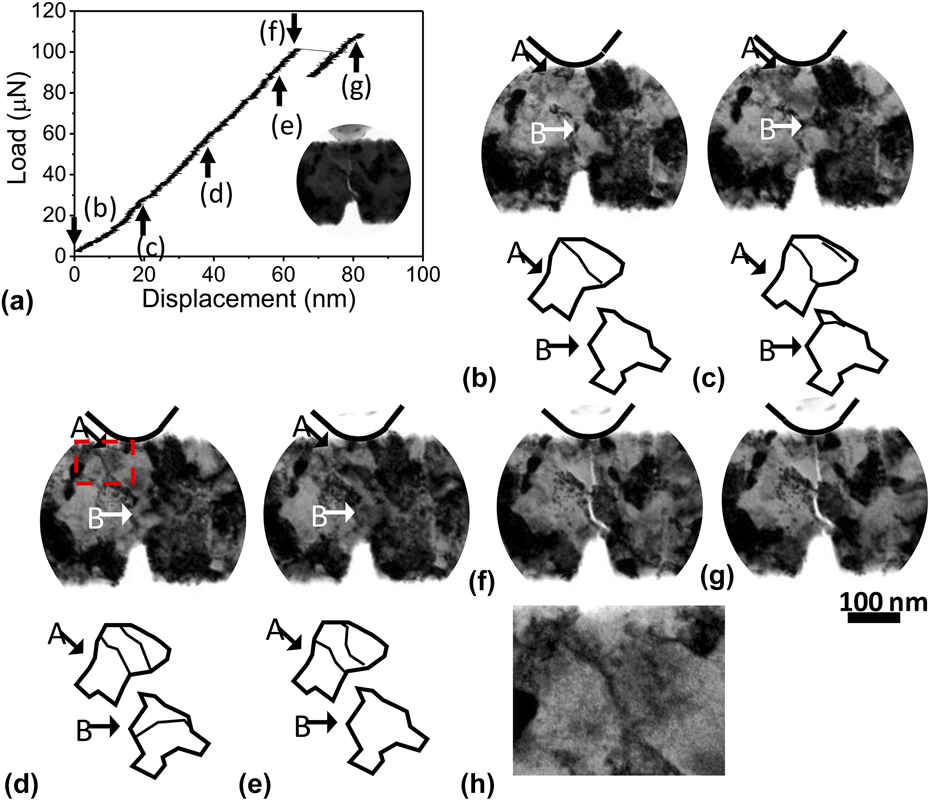
The measured load–displacement curve (a) for beam 7 in Table I and corresponding TEM bright field images from (b) to (g). The TEM image with reduced contrast showing the indenter tip in contact with the beam specimen is shown in the inset of (a). The arrow A and B highlight grains with dislocation activities. The contrast of images in (b)–(g) is enhanced for better visualization. The black line depicts the position of the indenter in (b)–(g). (h) shows a magnified image extracted from the boxed region in (d) to show the dislocations clearly.

The measured K C is under plane strain condition, which is attributed to the small plastic zone size of TiN thin film. The radius of plastic zone at the crack-tip can be estimated as Reference Hertzberg, Vinci and Hertzberg40
 $${R_{\rm{f}}} \approx {1 \over {6\pi }}{{{K^2}} \over {{\sigma _{{\rm{ys}}}}^2}}\quad ,$$
where K is the stress intensity factor and σys is the yield strength. The critical stress intensity factor K C for TiN thin film is ∼3 MPa m1/2 (Refs. Reference Wei, Bhushan and Jacobs23, Reference Wang, Yu and Huang27, and Reference Massl, Thomma, Keckes and Pippan41−Reference Kataria, Srivastava, Kumar, Srinivas, Siju, Khan, Rao and Barshilia43), and the yield strength σys is ∼7 GPa. Reference Ma, Huang and Chen38 Thus, the plastic zone size of TiN is about 10 nm. This is further validated from TEM imaging where no obvious dislocation activities near the notch tip were detected (see Fig. 4 and supplementary video). For the specimen considered to satisfy the plane strain conditions, the ratio of plastic zone size to film thickness should be less than 1/10, which is met if the specimen thickness is larger than 100 nm. In our case, the sample dimension is ∼200 nm × ∼400 nm × ∼1600 nm, and hence the conditional fracture toughness of the TiN coatings is under plane strain condition which is at the lower limit regardless of the loading modes.
III. RESULTS AND DISCUSSION
Figure 4(a) (and the associated supplementary video) shows a typical load–displacement curve accompanying with the TEM bright field images corresponding to several data points. No detectable dislocation activities can be observed near the notch tip during the loading. Thus, the plastic zone size should be less than 10 nm, further experimentally confirming the satisfaction of plane strain condition. At point (f), a crack starts to propagate from the notch, which corresponds to the load drop in the measured load–displacement curve. The formation of crack and its propagation are accompanied by a drop in the measured load on the picoindenter. Afterward, the crack ceases to propagate due to the compressive stress field induced by the cube corner indenter. Once the crack stops, the measured load stabilizes and further increases upon continued mechanical loading due to the two cantilevers (see Fig. 3). The load just before the crack propagation is used in the finite element method (FEM) simulations. The crack growth is stable due to the following possible reasons: (i) As discussed by Jaya and Jayaram in their paper, Reference Jaya and Jayaram44 the crack will grow stably due to the clamped beam geometry; (ii) the compressive stress field due to the sharp cube corner indenter used in the experiment also stops the propagation of the crack and prevents catastrophic crack growth; (iii) the bridging and GB deflection toughening mechanisms together with (ii) stabilize crack growth. Using the Hysitron PI95 picoindenter with a data acquisition rate of 500 Hz, we can estimate the crack propagation time by measuring the crack start and stop times, and thus obtain the crack propagation speed in the nanocrystalline TiN film.
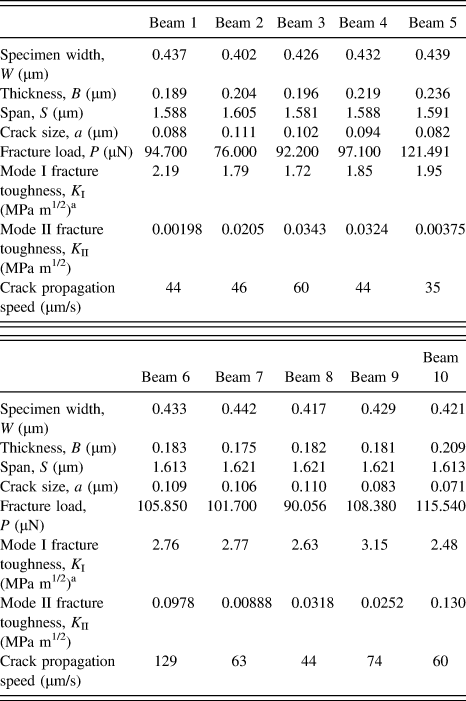
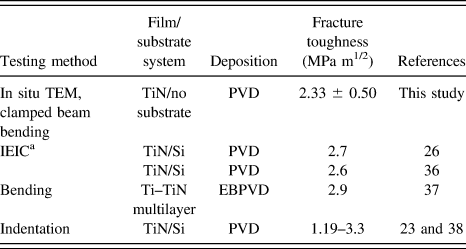
Ten experiments were performed on the TiN beams with similar geometry. Among all the experiments, failure always occurs near the notch. The beam geometry and calculated conditional fracture toughness by FEM simulation for each beam are listed in Table I. The beam dimensions were measured from SEM images, except the notch length and curvature which were measured from TEM imaging. The resultant average fracture toughness of the TiN specimens is 2.33 ± 0.50 MPa m1/2 which is comparable to literature data as shown in Table II. The fracture toughness that we measured is a mixed mode Kc. GB deflection, crack propagation on cleavage planes and the misalignment between the indenter and the notch will change the fracture mode from pure mode I fracture to a mixed mode of mode I and mode II fracture. We also calculated the mode II fracture toughness based on the stress method in Ref. Reference Chan, Tuba and Wilson39 as shown in Table I. The value is comparably small compared with mode I fracture toughness, indicating that mode I fracture is the dominant fracture mode in our measurement. Thus, the K I value is effectively fracture toughness K IC.
Sample geometry and conditional fracture toughness for 10 TiN beams.

a Since the K II value is small compared with K I value, the K I is effectively K IC.
Comparison of fracture toughness (K C) of TiN with literature values.

a Internal energy induced cracking.
The measured conditional fracture toughness shows considerable fluctuations that are dependent on how cracks are formed. Three kinds of crack propagation pathways are observed, namely bridging, intergranular fracture, and a mixed mode of transgranular and intergranular fracture.
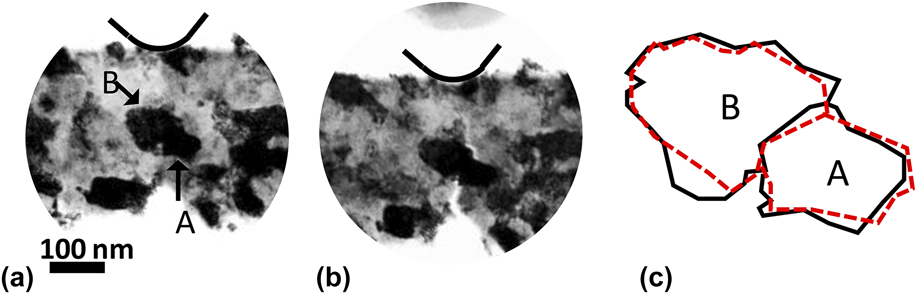
In the beam 1 (see Table I), the crack bridging process is observed. TEM bright field images before bending and at the failure point and a schematic figure to illustrate the observed grain rotation or bending process are shown in Fig. 5. Change in the shapes of grain A and grain B took place during the deformation. The solid and dashed lines represent the shape of grain A and B before and after deformation, respectively. Because TEM images were recorded in projection, the shape changes can be due to grain rotation or bending. At the fracture point, the crack initiates from the notch, and is hampered by grain A, and subsequently starts to propagate on the other side of grain A.
Bright field TEM images recorded before bending (a) and at the failure point (b) for beam 1 in Table I. (c) shows the illustration of the change in the grain shape. The solid line depicts the grain shape before deformation and the dashed line depicts the grain shape after deformation. The contrast is enhanced. A black line is used to depict the shape of the indenter.

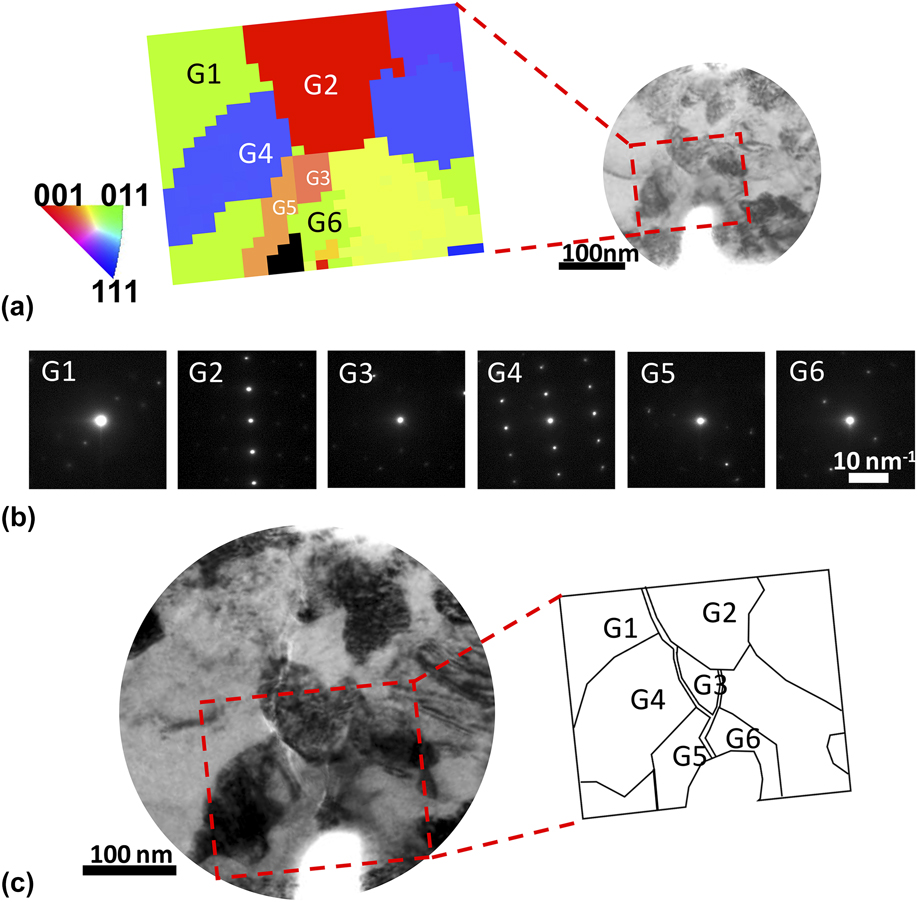
Intergranular fracture in nanocrystalline TiN is observed in beam 8 as shown in Fig. 6. To better distinguish the GB and grain shape, Scanning Electron Nanodiffraction (SEND) was performed before the bending test. Reference Kim, Xing, Zuo, Zhang and Wang45 The scanning region was ∼200 nm × ∼200 nm with an electron probe size ∼2 nm and step size 8 nm. The orientation of each grain can be determined by fitting each scanning nanobeam electron diffraction pattern with simulations from quantitative electron diffraction (QED) software. The orientation map and the corresponding diffraction pattern of each grain are shown in Figs. 6(a) and 6(b). The majority of diffraction patterns are from single crystal, indicating that very few grain-overlaps exist along the electron beam direction. From the correlation map color-coded by the crystal orientation of each grain, most of the grains are separated by high angle grain boundaries. The crack propagation path is shown in Fig. 6(c) with a postmortem bright field TEM image and a schematic figure illustrating the configuration of grains and crack. The crack front proceeds along the GB between G5 and G6, and then diverges into two crack propagation paths [see Fig. 6(c)]. The crack on the right keeps propagating along the GB of G3 until it meets G2, where the crack is arrested due to large resistance exerted by the GB perpendicular to the crack propagation direction. The crack on the left continues to propagate along the GB of G2, G4, and G1 and keeps being deflected by the GBs. The crack contrast within G2 may be due to the tilted GB alignment between G2 and G1, or transgranular crack growth in G2.
Intergranular fracture mode. (a) Orientation map of beam 8 obtained from the boxed region using SEND. The diffraction pattern of each grain is shown in (b). (c) shows the crack growth path.

A mixed mode of transgranular and intergranular fracture is shown in Fig. 7, corresponding to beam 6 in Table I. SEND is also performed before the bending test with a scanning area of ∼360 nm × ∼200 nm, probe size of ∼2 nm, and step size 8 nm. The orientation map and the corresponding diffraction pattern of each grain are shown in Figs. 7(a) and 7(b). The crack first propagates transgranularly in G1 until it meets a triple junction formed by G1, G2, and G4. The triple junction acts as a deflection point and deflects the crack by an angle of 38° since the energy required for intergranular crack is less than that for transgranular crack. The crack then deflects to G4 by an angle of 59° and continues propagating within G4. Based on the SEND patterns for G1 and G4, the cleavage plane can be indexed as (001) for G1 and
 $(01\bar 1)$
for G4 [see Fig. 7(c)]. The GB deflected the crack propagation by 38 and 59° [see Fig. 7(c)]. The large angle kinks may enhance the fracture resistance and toughen the materials.
Mixed mode of intragranular and intergranular fracture. (a) is the orientation map of beam 6 obtained by SEND from the boxed region. The diffraction pattern for each grain is shown in (b). (c) shows the crack growth path. The ⊥ mark denotes the directions parallel and perpendicular to the cleavage plane. The inset diffraction patterns of G1 and G4 are contrast enhanced to better show diffraction spots. The normal of cleavage plane points to (001) diffraction spot in G1 and
 $(01\bar 1)$
diffraction spot in G4.

Among the 10 specimens observed, 6 (beam 2, 4, 5, 7, 8, and 10) show cracks that predominately propagate along GBs. When the crack initiates in the vicinity of a GB, it will propagate along the GB if the GB has nearly parallel orientation respect to the crack propagation direction. This is consistent with the fact that GB has a lower atomic density and weaker atomic bonds, which facilitate crack propagation due to smaller amount of broken bonds compared with that required for transgranular fracture. Thus, the cracks have a tendency to propagate along GBs. In two cases (beam 5 and 8), the GBs perpendicular to the crack growth direction are observed. Their presence arrests the crack propagation, and forces the crack to proceed along other intergranular paths, or nucleate a new crack on the other side of the blocking grain in a bridging toughening manner, or grow into the grain. When the crack front ends in the grain interior, the crack will start to advance transgranularly (beam 3, 6, and 9) until it meets a GB which will deflect the crack.
For the specimen geometry we used, the stress is partly relieved compared with thin films on substrate. The thin films that grow on the substrate are normally under compressive stress. Because of this, the measured value by in situ TEM clamped beam bending method is slightly lower than other method with films bonded to a substrate (Table II).
The crack bridging process occurring in beam 1 (Fig. 5) is believed to be consuming more energy than transgranular fracture. Normally transgranular fracture in brittle materials, such as ceramics, occurs on the cleavage plane, where the crack propagation is unstable and spontaneous once the Griffith criterion is met and the crack propagation speed is very fast. On the other hand, the observed crack bridging process is mainly because an existing crack arrested by encountering a grain with unfavorable orientation such that transgranular cleavage or intergranular crack cannot be initiated. Therefore, GB-mediated mechanisms, such as grain rotation or bending, are activated to relieve the stress concentration at the crack-tip, where a crack is formed on the other side of the two grains (A and B in Fig. 5) to accommodate the deformation of the change of grain shape. These GB-mediated mechanisms accompanying with the formation of a new crack should consume more energy than a simple transgranular cleavage fracture. We succeeded in observing this type of fracture once in our experiment. Further experiments are needed to quantify the toughening associated with it.
The amount of time that crack propagated varies from 2 to 6 ms with our measurement resolution at 2 ms. By measuring the length of crack using TEM images, we estimated the average crack propagation speed at 60 μm/s, with the highest speed at 129 μm/s observed in beam 6 with mostly transgranular crack path and the lowest speed at ∼44 μm/s at beam 1, 4, and 8 with bridging and intergranular crack path. Those specimens showing predominantly transgranular crack (group A, 3 specimens) had an average speed of 88 μm/s while specimens involving intergranular cracks (group B, 6 specimens) had an average speed of 52 μm/s. The relative low propagation speed may be due to the compressive stress field imposed by the sharp cube corner indenter which limits the crack propagation. Also, the toughening mechanisms, e.g., bridging and GB toughening, will also retard the crack propagation. Although the data points are somewhat limited, the trend shows that intergranular fracture and bridging serve as effective toughening mechanisms to retard crack propagation.
Further, dislocation activities are observed during loading as shown in Fig. 4 (and the associated supplementary video) as an example. As shown in Fig. 4(b), a trapped dislocation existed in the grain marked by arrow A before bending. During bending a dislocation nucleated from the upper right GB. Then the trapped dislocation and newly formed dislocation together propagated to the lower left direction. The arrow B denotes a dislocation that nucleates, glides through the grain, and finally is absorbed by GBs. This process has been previously observed in nanocrystalline metals. Reference Kumar, Van Swygenhoven and Suresh3,Reference Liao, Zhou, Lavernia, Srinivasan, Baskes, He and Zhu46–Reference Kumar, Suresh, Chisholm, Horton and Wang49 The schematic figures below bright field TEM images illustrate these processes. Similar behavior is observed in other test specimens. Dislocation activity tends to be observed near the indenter tip where it is under compressive stress. While in other grains, the recorded TEM images show few or very limited dislocation activities. Previous studies reported that nanograins hinder the intragranular dislocation motion. Reference Meyers, Mishra and Benson1,Reference Ma, Huang and Chen38 However, in nanocrystalline nickel of ∼30 nm grain size which is similar to that of our specimens, significant dislocation activities were observed during deformation Reference Kumar, Suresh, Chisholm, Horton and Wang49 ; by contrast, dislocation activities are much limited in nanocrystalline TiN, only observed in regions near the indenter tip where under compressive stress. Dislocation activities are restricted in ceramics like TiN mostly due to their high Peierls barrier for dislocation slip. In addition, for a notched specimen satisfied plane strain conditions, the area in the vicinity of the notch tip will be under triaxial stress state due to the plastic constraint, and the yield stress will be higher than that under uniaxial stress state. Reference Hertzberg, Vinci and Hertzberg40 The inhibited dislocation activities seen in our fracture toughness test appear to be consistent with these reasons.
IV. CONCLUSION
In summary, we demonstrated a novel method to evaluate the conditional fracture toughness of thin films and to correlate with in situ study of fracture mechanisms. Nanocrystalline TiN thin films were investigated using this method. Reproducible fracture toughness values were measured in a good agreement with previous reports, indicating high reliability of our method. The fracture toughness that we measured is a local fracture toughness near the notch, dependent on the crack initiation. In situ TEM bright field imaging reveals three crack propagation pathways, namely bridging, intergranular fracture and a mixed mode of transgranular and intergranular fracture. Also, grain rotation or bending and dislocation sliding contribute to the deformation of nanocrystalline TiN. By comparing the crack propagation speed, it can be concluded that bridging and GB deflection act as toughening mechanisms for nanocrystalline TiN thin films. The influence of stress state on the dislocation behaviors in nanocrystalline ceramics is discussed, which confirmed the applicability of the classical yielding criteria at submicrometer size scale. Our methodology is universal and can be applied to other ceramic material systems to evaluate the fracture toughness and study the deformation and failure mechanisms.
Our results show that both the measured fracture toughness value and crack propagation speed are important parameters that can be obtained in in situ TEM to correlate with microstructure and crack behaviors. Using these data, we can also conclude that GB deflection and bridging hinder the crack growth by reducing the crack propagation speed and act as toughening mechanisms for nanocrystalline ceramics. Our method of measuring thin-film fracture toughness has advantages of avoiding substrate effect, and overcoming difficulties in sample preparation and applying external stress in conventional methods, and gives reproducible and reliable fracture toughness values.
Supplementary Material
To view supplementary material for this article, please visit http://dx.doi.org/jmr.2016.4.
ACKNOWLEDGMENTS
The work is supported by DOE BES (Grant No. DEFG02-01ER45923). Electron microscopy was carried out at the Center for Microanalysis of Materials at the Frederick Seitz Materials Research Laboratory of University of Illinois at Urbana–Champaign. The TiN specimen was prepared by Ms. An-Ni Wang with Department of Engineering and System Science, National Tsing Hua University at Hsinchu, Taiwan.