Introduction
An extensive body of demographic literature has described Jews as ‘long-lifers’. Comparisons of Jewish and non-Jewish mortality made during the nineteenth and the early twentieth century testified to relatively low mortality of Jews in several communities with well-documented mortality patterns (Fishberg Reference Fishberg1911; Hersch Reference Hersch1948; Schmelz Reference Schmelz1971; Condran & Kramarow Reference Condran and Kramarow1991; Goldstein et al. Reference Goldstein, Watkins and Spector1994; Marks Reference Marks1994; Reid Reference Reid, Corsini and Viazzo1997; van Poppel et al. Reference Van Poppel, Schellekens and Liefbroer2002; Derosas Reference Derosas2003; O’Grada Reference O’Grada2006; Cattan et al. Reference Cattan, Mallet, Feingold and Robertson2007; Sawchuk et al. Reference Sawchuk, Tripp and Melnychenko2013). The relatively low mortality of Jews was especially conspicuous in infancy and childhood ages, but it was not limited to these ages. The attempts to explain the Jewish longevity advantage highlighted a wide array of behavioural and lifestyle factors, some related to the superior educational attainment and specific employment patterns of Jewish males and females, while others were independent of them and came under the broad umbrella of cultural/religious factors. Among the cultural/religious factors, the role of the Jewish dietary laws (e.g. kashrut and hand washing), long breastfeeding of Jewish infants and the existence of developed systems of poverty relief in Jewish communities invoked substantial scholarly commentary, yet uncertainty persists regarding the impact of these specific factors on health and longevity. In contrast, the generally greater attention paid by Jews to matters of health, their openness to medical and public health innovations and their readiness to consult doctors loom large in the picture of potential explanations. As noted by Derosas (Reference Derosas2003, pp. 111-112), both with respect to fertility and mortality, it is appropriate to characterise Jews as ‘forerunners’ of demographic behaviour that the rest of the population would adopt later, with a delay of several decades. As early as the beginning of the nineteenth century, Jews’ notions of healthy lifestyle and proper care for children and the ill, in terms of nutrition, warmth and hygiene, came closer to the modern standards compared to the rest of the population. To borrow another insight of Derosas (Reference Derosas2003): at the early stages of the demographic transition, it may be more appropriate to speak of the overmortality of non-Jews, resulting by and large from the failure to prevent avoidable mortality even in the absence of modern medical care through behavioural adjustments, than of the longevity advantage of Jews. In addition, a degree of social isolation of Jews may also have played a protective role. In an environment where most deaths are caused by infectious and parasitic diseases, social isolation – even partial – could reduce the transmission of infection, leading, in the first place, to relatively low morbidity and, subsequently, to relatively low mortality (van Poppel et al. Reference Van Poppel, Schellekens and Liefbroer2002).
Fast-forward to the latest stage of the demographic transition…Consistently, since the 1960s, Jews in the Diaspora have enjoyed relatively low mortality compared to their host populations. This pattern affected all age groups and was particularly well expressed among Jewish males but was also present among Jewish females. It also held good independently of the Jews’ socio-economic position (Rosenwaike, Reference Rosenwaike1990; Interstate Statistical Committee of the Commonwealth of Independent States 1995; Shatenstein & Kark Reference Shatenstein and Kark1995; Goldstein Reference Goldstein1996; Piskunov Reference Piskunov1996; Bogoyavlenskiy et al. Reference Bogoyavlenskiy, Shkolnikov, Andreev, Shkolnikov, Andreev and Maleva2000; Shkolnikov et al. Reference Shkolnikov, Andreev, Anson and Mesle2004; Staetsky Reference Staetsky2011a; Staetsky and Hinde Reference Staetsky and Hinde2015). Similarly, Jews in Israel have relatively low mortality when compared to many Western populations (Staetsky and Hinde Reference Staetsky and Hinde2009; Staetsky Reference Staetsky2011b). The analyses of the cause of death of the mortality of Jews, both in Israel and in the Diaspora, revealed the relatively low mortality of Jews from a wide range of causes significantly linked to health-destructive behaviour and/or neglect of health issues (circulatory diseases, cancer and especially lung cancer, chronic obstructive pulmonary disease, suicide and other external causes of deaths). Many studies across the globe have reported a relatively low prevalence and/or intensity of smoking, low levels of alcohol consumption among Jews and a relatively low tendency of Jews to get involved in antisocial behaviour (Fishberg Reference Fishberg1911; Hersch Reference Hersch1948; Snyder Reference Snyder1958; Herman & Enterline Reference Herman and Enterline1970; Horowitz & Enterline Reference Horowitz and Enterline1970; Schmelz Reference Schmelz1971; Seidman Reference Seidman1971; Glassner & Berg Reference Glassner and Berg1980; Shuval Reference Shuval1992; Boyarin Reference Boyarin1997; Almog, Reference Almog2000; Becher et al., Reference Becher, Waterman, Kosmin and Thomson2003; Baron-Epel et al. Reference Baron-Epel, Haviv-Messika, Tamir, Nitzan-Kaluski and Green2004; Shkolnikov et al., Reference Shkolnikov, Andreev, Anson and Mesle2004, Staetsky & Hinde Reference Staetsky and Hinde2009, Reference Staetsky and Hinde2015, Staetsky Reference Staetsky2011b).
However, there are known instances of relatively high Jewish mortality that should not be overlooked. A full understanding of Jewish mortality is impossible without accounting for them. Studies of Jewish mortality in North America in the middle of the twentieth century showed that, relative to the populations among whom they were living, certain Jewish populations had high mortality at advanced ages – yet they had low mortality during childhood and young adulthood (Spiegelman Reference Spiegelman1948; Fauman and Mayer Reference Fauman and Mayer1969; Needleman Reference Needleman1988; Rosenwaike Reference Rosenwaike1990; Goldstein Reference Goldstein1996). Elevated mortality, relative to Western populations, was observed in certain subgroups of Israeli Jewish females aged 65 years and over well into the 1990s (Staetsky and Hinde Reference Staetsky and Hinde2009, Reference Staetsky and Hinde2015). The notion of the ‘Jewish pattern of mortality’, proposed by Staetsky and Hinde (Reference Staetsky and Hinde2015), reconciled the findings of the relatively low and relatively high mortality of Jews. The fundamental, defining tendency of Jewish populations across the globe, according to Staetsky and Hinde (Reference Staetsky and Hinde2015), is to have low mortality due to the low incidence of health-destructive behaviour. However, certain forces may counteract this tendency; metaphorically speaking, they ‘compete’ for expression with this tendency elevating mortality temporarily. For the large part of the twentieth century, many Jewish populations across the globe, and the Jewish populations of North America and Israel in particular, were substantially composed of migrants from higher mortality environments, that is, Eastern Europe, North Africa and the Middle East. Thus, the preservation of high mortality, where it occurred, was a legacy of the migrants’ countries of origin, and it dissolved towards the end of the twentieth century with the gradual replacement of the first-generation migrant Jewish populations by locally born Jews.
This paper has two aims. The first aim is to show the impact of COVID-19 on Jewish mortality. To this purpose, we present and analyse data on Jewish mortality in the year 2020 – the first year of the global coronavirus pandemic. Sixteen Jewish populations feature in this paper: Australia, Austria, Belgium, Canada, Denmark, France, Germany, Great Britain (England and Scotland), Hungary, Israel, Italy, Mexico, Netherlands, Spain, Sweden and USA. In combination, these Jewish populations constitute about 95% of world Jewry (DellaPergola Reference DellaPergola2020). This is a study of a global pandemic in the Jewish population which is, to the best of our knowledge, unique in its scope and quality. There are no demographic accounts of Jewish mortality during, for example, the plague pandemics of the fourteenth to seventeenth centuries or the 1918 Spanish influenza pandemic. The data necessary to conduct such analyses had never been collected. The situation with the coronavirus pandemic is different: in the early twenty-first century, mortality data were available for many Jewish populations. As a result, partial accounts of the coronavirus pandemic among Jews, focusing on a smaller selection of populations and/or limited to the first wave of the pandemic, came into existence (Office for National Statistics 2020; Staetsky and Paltiel Reference Staetsky and Paltiel2020, Gaughan et al. Reference Gaughan, Ayoubkhani, Nafilyan, Goldblatt, White, Tingay and Bannister2021; Staetsky Reference Staetsky2021a; Staetsky et al. Reference Staetsky2021b), and we build on them here.
The second aim of this paper is to further develop the notion of the ‘Jewish pattern of mortality’. We suggest that the COVID-19 pandemic operated as an ephemeral factor elevating Jewish mortality, competing with the underlying low mortality of Jews. In some – albeit not all – Jewish communities, mortality during the pandemic was significantly elevated, more so than among the surrounding non-Jewish populations. Specifically, coronavirus mortality in these communities was higher among Jews than among non-Jews. Some early commentators tended to attribute this to the relative agedness of certain, albeit not all, Jewish communities. Still, to others this came as a surprise. Although some Jewish communities are older than non-Jews among whom they live, Jewish health profile is generally favourable. Coronavirus is known to form synergetic relationships with pre-existing chronic conditions, and, if the prevalence or severity of these conditions are relatively low among Jews, this can be expected to dampen the effect of coronavirus too. What then explains the instances of high Jewish mortality from coronavirus, relative to non-Jews, especially where age profiles of Jews and non-Jews are comparable? Does COVID-19 pandemic set a test of validity for the notion of the Jewish pattern of mortality? We suggest that the finding of the relatively high Jewish mortality from coronavirus, where it occurs, fits into the notion of the ‘Jewish pattern of mortality’. In what follows, we propose that factors such as social cohesion, sociability and the interconnectedness of Jewish communities (owing to both Jewish culture and religion) may have led to the relatively high prevalence of the highly transmissible coronavirus infection in these communities during the pandemic. That, in turn, may have led to the relatively high Jewish mortality from coronavirus. We maintain that social cohesion and sociability may be conducive to low mortality under normal circumstances (i.e. when mortality is dominated by non-communicable diseases), yet they may facilitate the spread of communicable diseases.
Sources, Data and Methods
To capture the impact of coronavirus on populations (Jews and non-Jews), we resort to measuring excess mortality. The assessment of excess mortality in a period of time (e.g. year 2020) is based on the comparison between the number of deaths actually observed during that period and the number of deaths that is expected to take place, derived from the experience of previous years. The method of excess mortality has been widely used by the epidemiological community as the method of quantifying the effect of the coronavirus pandemic. The method is independent of the presence and quality of COVID-19 diagnosis, which may vary across time and space, and simply describes the elevation in mortality from all causes during the time of the pandemic. The assumption is that the effect of a significant new factor operating to inflate mortality should be observable at the level of the total number of deaths. Further information about the assessment of excess mortality, the rationale behind it and its history, can be found in Adam (Reference Adam2022), Karlinsky and Kobak (Reference Karlinsky and Kobak2021), Sanmarchi et al. Reference Sanmarchi, Golinelli, Lenzi, Esposito, Capodici, Reno and Gibertoni2021, and references therein. Technically, we calculate and present percentage change in the number of deaths during the first year of the pandemic (2020) relative to normal levels of mortality. An average of 2016–2019 is taken as representative of the normal level of mortality, with the exception of Hungary and USA, New York, where an average of 2017–2019 is used since data for 2016 were not available for Jews in these locations. There are 37 national and subnational locations featured in this study: in 24 locations, the average number of Jewish deaths during a period used for benchmarking is above 100, in 10 locations it is above 1,000; there are no locations with the number of deaths lower than 30.
As a rule, death certificates in countries with significant Jewish populations do not identify Jews, or any other minorities for that matter. Thus, building a credible picture of mortality of particular ethnic and religious groups is difficult. For Jews, there is a way around this issue, as there are special Jewish burial societies (Hevrot Kadisha) that take care of the Jewish dead, ensuring strict adherence to Jewish law and burial customs. The data on deaths occurring in 2016–2020 in Jewish communities of the Diaspora were obtained from the major Jewish burial societies. All of the approached burial societies kept records of their activities (the distributions of deaths by month) during the COVID-19 pandemic, which they made available to the author alongside their records from recent years. Records from recent years (i.e. mostly 2016–2019) were used to reconstruct the ‘normal’ levels of mortality in these communities. The level of mortality in 2020 was then compared to the normal levels, to estimate the extent of excess, if any. The data on deaths in Israel was received from the Central Bureau of Statistics, Israel.
Although there are differences in the degree of the coverage for each of the participating Jewish communities, our data cover regions which encompass 95% of global Jewish population. Still, with respect to the Diaspora Jewish populations, the question of selectivity presents itself. Are Jews buried by the Jewish burial societies in any way different from those who are not? In particular: are mortality experiences of Jewish populations whose deaths are handled by the Jewish burial societies different from the experiences of Jews who bury outside of this framework?
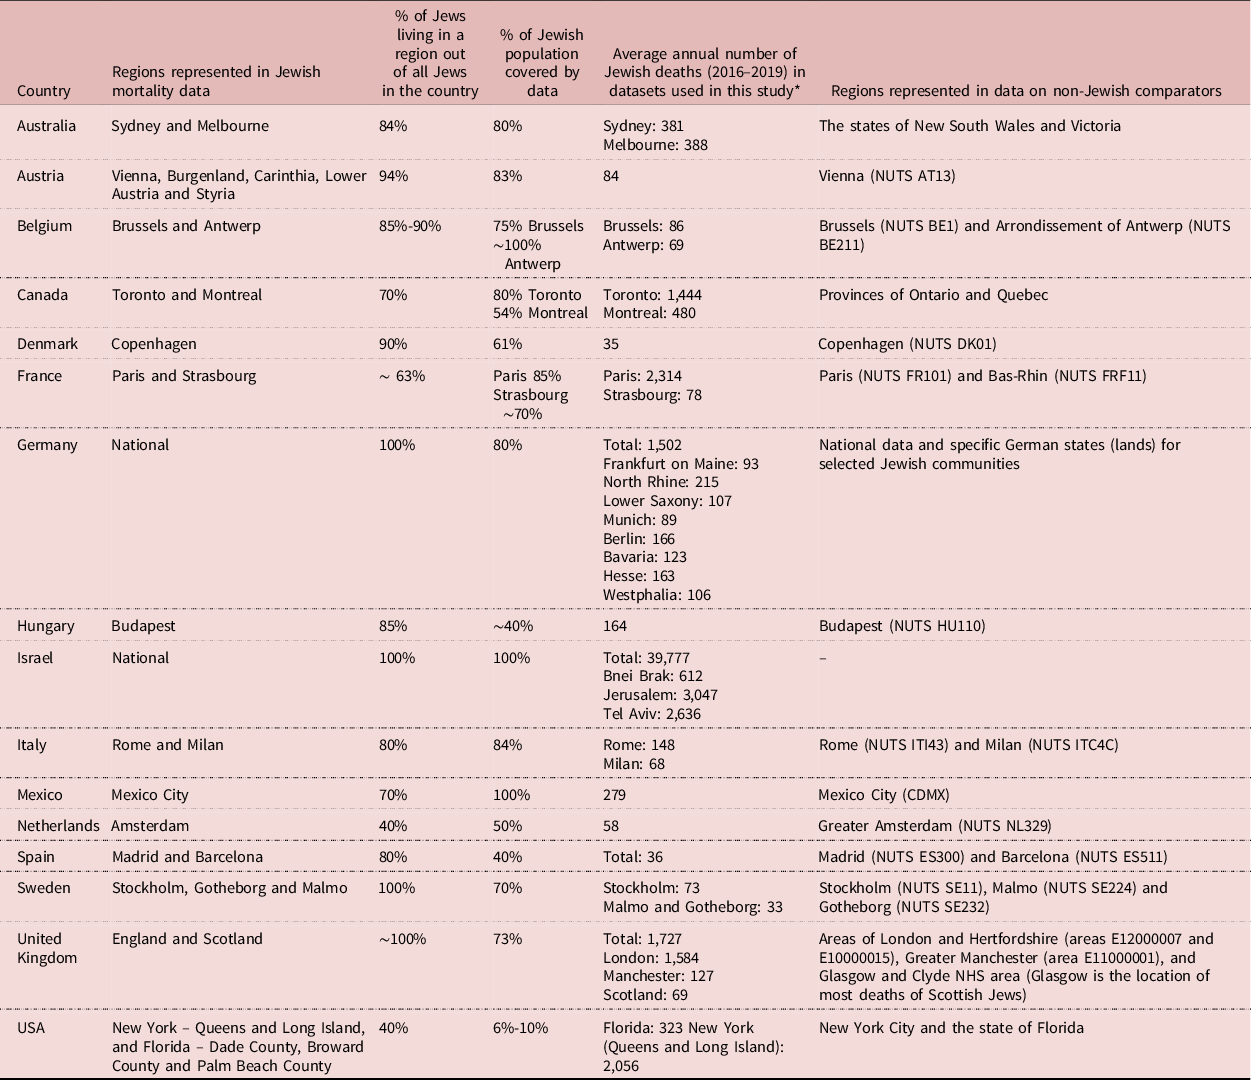
In view of the author, in the context of the Diaspora, it is best to thinks of mortality experiences described in this study as representative of Jewish communities, rather than Jewish populations. Jewish community here is defined as consisting of two segments: (1) Jews formally affiliated to/registered in/members of synagogues and/or umbrella communal bodies (the inner circle), and (2) Jews who are not formally attached as specified but are sufficiently involved in Jewish life to wish to be buried according to Jewish ritual (the outer circle). Universally, a certain fraction of deaths among Jews who are not formally attached with the community are handled by Jewish burial societies. Jews who remain outside of both circles are likely to be the least religious and involved in Jewish culture. It is possible (but not certain!) that their mortality experience is different from Jews belonging to the inner and outer communal circles and is not reflected in the data underlying this study. The difference between ‘communities’ and populations may be small and, in some places, it may even be trivial. The latter is true of those Jewish populations where the absolute majority is in fact affiliated to communal bodies (e.g. Australia, Austria, Belgium, Germany and Italy) and deaths made available for this study represent over 80% of all Jewish deaths (see Table 1). In other Jewish populations, affiliation to Jewish communal bodies is more partial (most notably the UK, Canada and Sweden), but it has been confirmed that there Jewish burial societies reach far beyond the inner circle. In these locations, coverage of Jewish deaths is mostly 70% and over. Where it is less than 70% (Montreal, Canada), this is simply because certain Jewish burial societies failed to communicate their data by a set deadline and not due to the selective omission of death belonging to the least religious segments of Jewish population. The strongest possibility of selection of the more religious segment of Jewish population exists in Hungary, a country with the least religious Jewish community in the given context. In sum, selectivity may be present and Jewish mortality experiences in the Diaspora may be represent the more religious and engaged segments. Still, this does not compromise the findings of the study. In majority of examined cases, the reach of the data is far beyond the most religious and is reflective of strong majorities of Jewish populations. Where this may not be so (e.g. Hungary), the data remain comparable: Jewish community of Hungary, its inner and outer circles, is still comparable to similarly defined Jewish communities in other contexts; it just represents a smaller proportion of Jewish population than elsewhere. The last caveat is on the American data. These data represent experiences of selected American Jewish communities, due to their very partial, local coverage, not the experience of the American Jewry as a whole.
Coverage of Jewish populations in this study and non-Jewish comparators

* With the exception of Hungary and USA, New York where an average of years 2017–2019 is used.
For non-Jews, comparable data come from EUROSTAT or national statistical offices. In the context of the Jewish Diaspora, we compared Jews to non-Jews living in the same city or region. This is important because COVID-19 did not affect all regions within countries in a uniform manner. Table 1 facilitates understanding of various aspects of mortality data.
Results
The impact of coronavirus on Jewish communities in the first year of pandemic
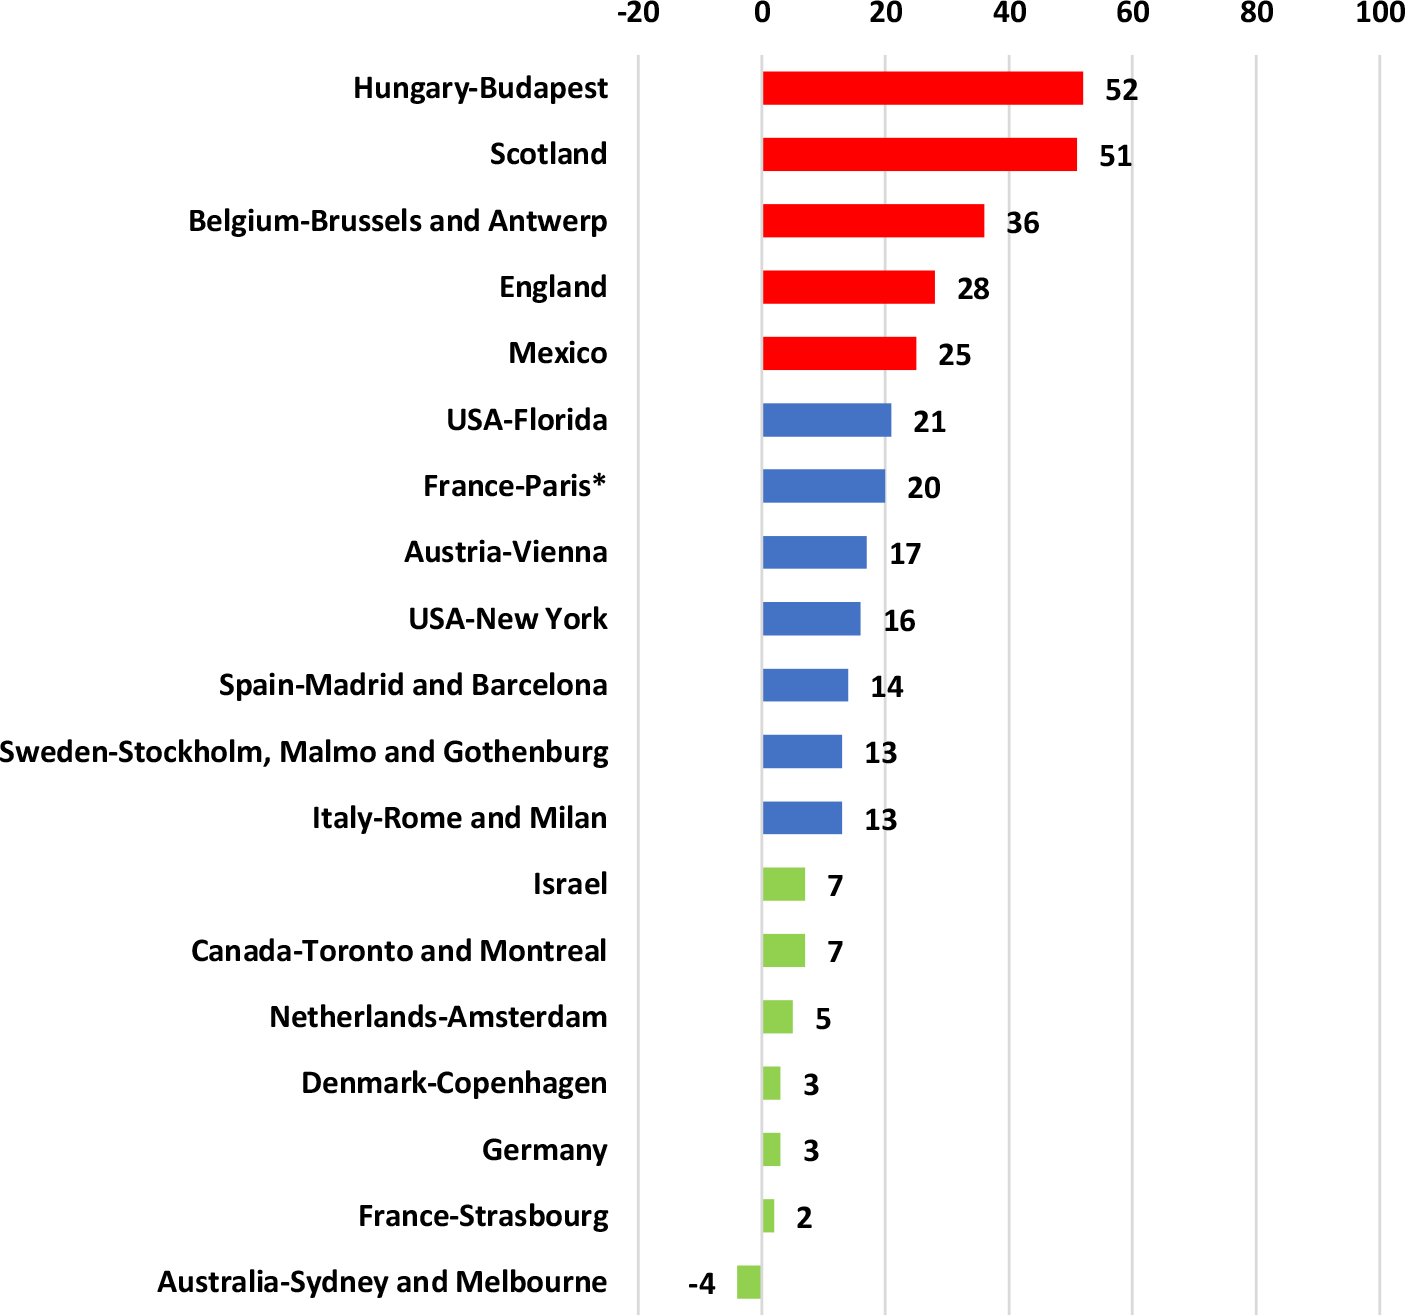
All Jewish communities with available data have been affected by coronavirus to some extent (Figure 1). The only exception is the Jewish community of Australia, where mortality during the first year of the pandemic was actually lower than the normal level. The spectrum of the impact of coronavirus on Jews is very wide. The Hungarian, British, Belgian and Mexican Jewish communities were the most affected in 2020, with mortality elevated to 25%–52% relative to the levels observed in normal times. At the same time, Jews in Israel, Canada, Germany, Netherlands and Denmark were the least affected, with an elevation below 10% relative to the normal levels. Other Jewish communities, including selected communities in the USA as well as Southern (Italy and Spain) and Western and Northern Europe (Austria, France and Sweden) are situated in-between: the elevation in mortality there is in the approximate range of 10–20%. In short, there is a great variety of situations.
Excess mortality of Jews in 2020, by country: % of deaths above/below the expected level.
Note: (1) The smallest annual number of deaths on which the estimation is based is 35. Five out of 19 communities presented in the graph had an annual number of deaths, in a normal year, in the range of 35–100; seven had 101–1,000 deaths; another seven had over 1,000 deaths. See Table 1. (2) An estimate for Paris is made on the basis of seven months (January–July 2020), data for August–December 2020 were not available at the time of estimation. The estimation assumes that during the months of missing data, Jewish mortality in 2020 was at 2016–2019 average. This assumption would be reasonable for at least 2 months (August–September 2020) when the level of excess mortality in France as a whole was near zero and the first half of October where it was at a level of 8%–20% (excess mortality during the coronavirus pandemic (COVID-19) – Statistics and Research – Our World in Data), and so Jews can be expected to have zero, or very small, excess mortality too. The assumption may not hold for the late October–December 2020. Yet, we experimented with inflating the number of Jewish deaths in these months by a factor of 2 – for Jews, an elevation at this level was only observed in April 2020. This had some effect on our conclusions. If indeed the number of Jewish deaths in Paris in November–December 2020 was two times normal level, in itself a very unlikely scenario, the elevation of Jewish mortality for the whole year would have been at the level of 30%, not 20%. Given the extreme nature of this experimental scenario, we acknowledge that there may be a degree of underestimation of the impact of coronavirus on Jews in Paris, yet the elevation of mortality in this population is closer to 20% than to 30%. (3) In Israel, the estimate relates to the population of Jews and others (i.e. it includes Jews and people unrecognised as Jews by Jewish law but forming part of the Jewish sector of Israel), the estimate excludes Israeli Arabs. (4) In New York, the estimate relates to the Jewish population of Queens and Long Island. In Florida, it relates to Dade County, Broward County and Palm Beach County.

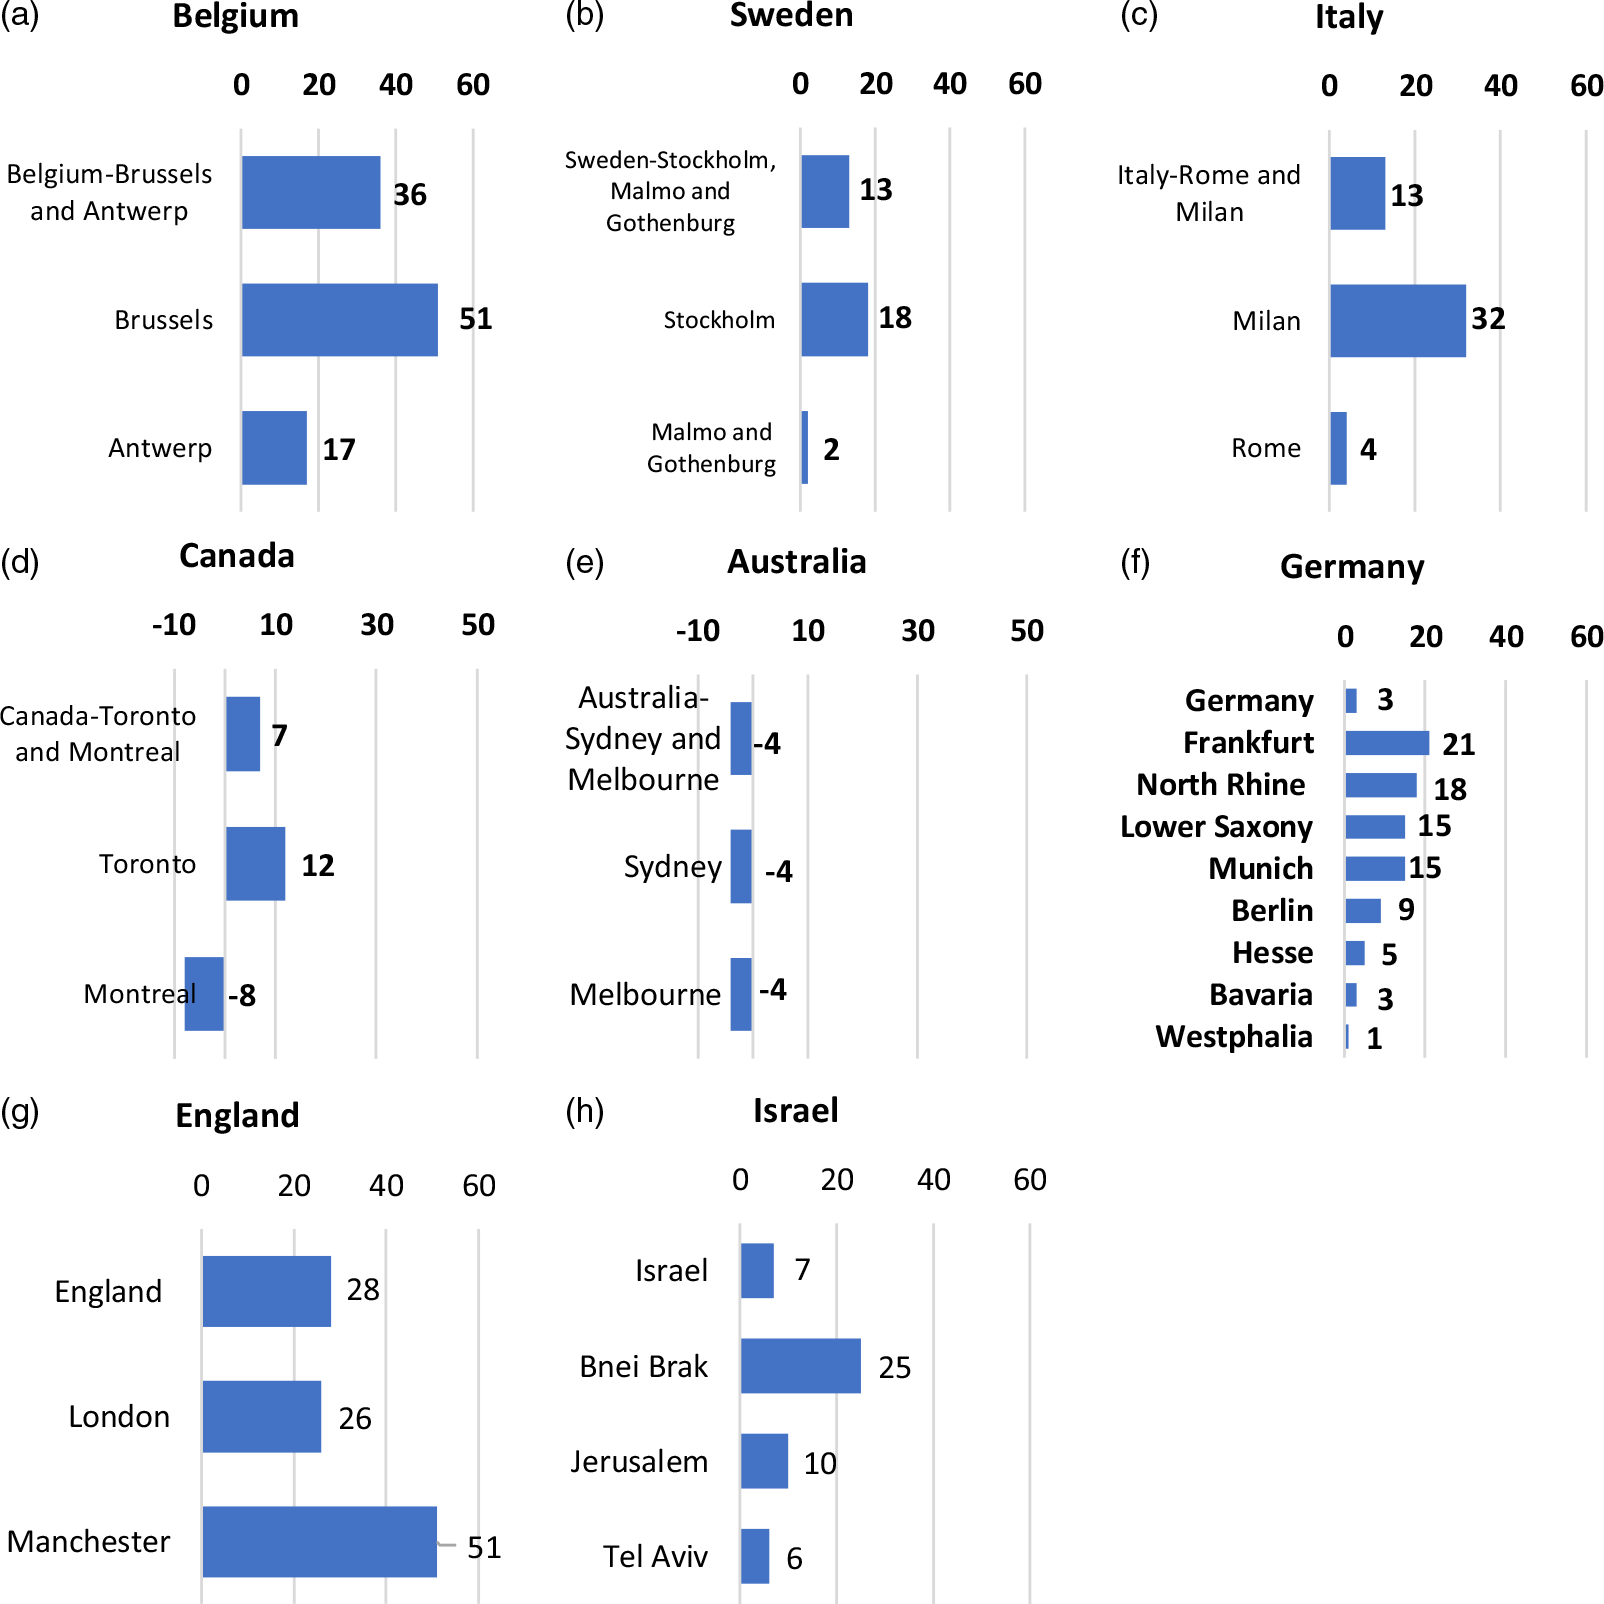
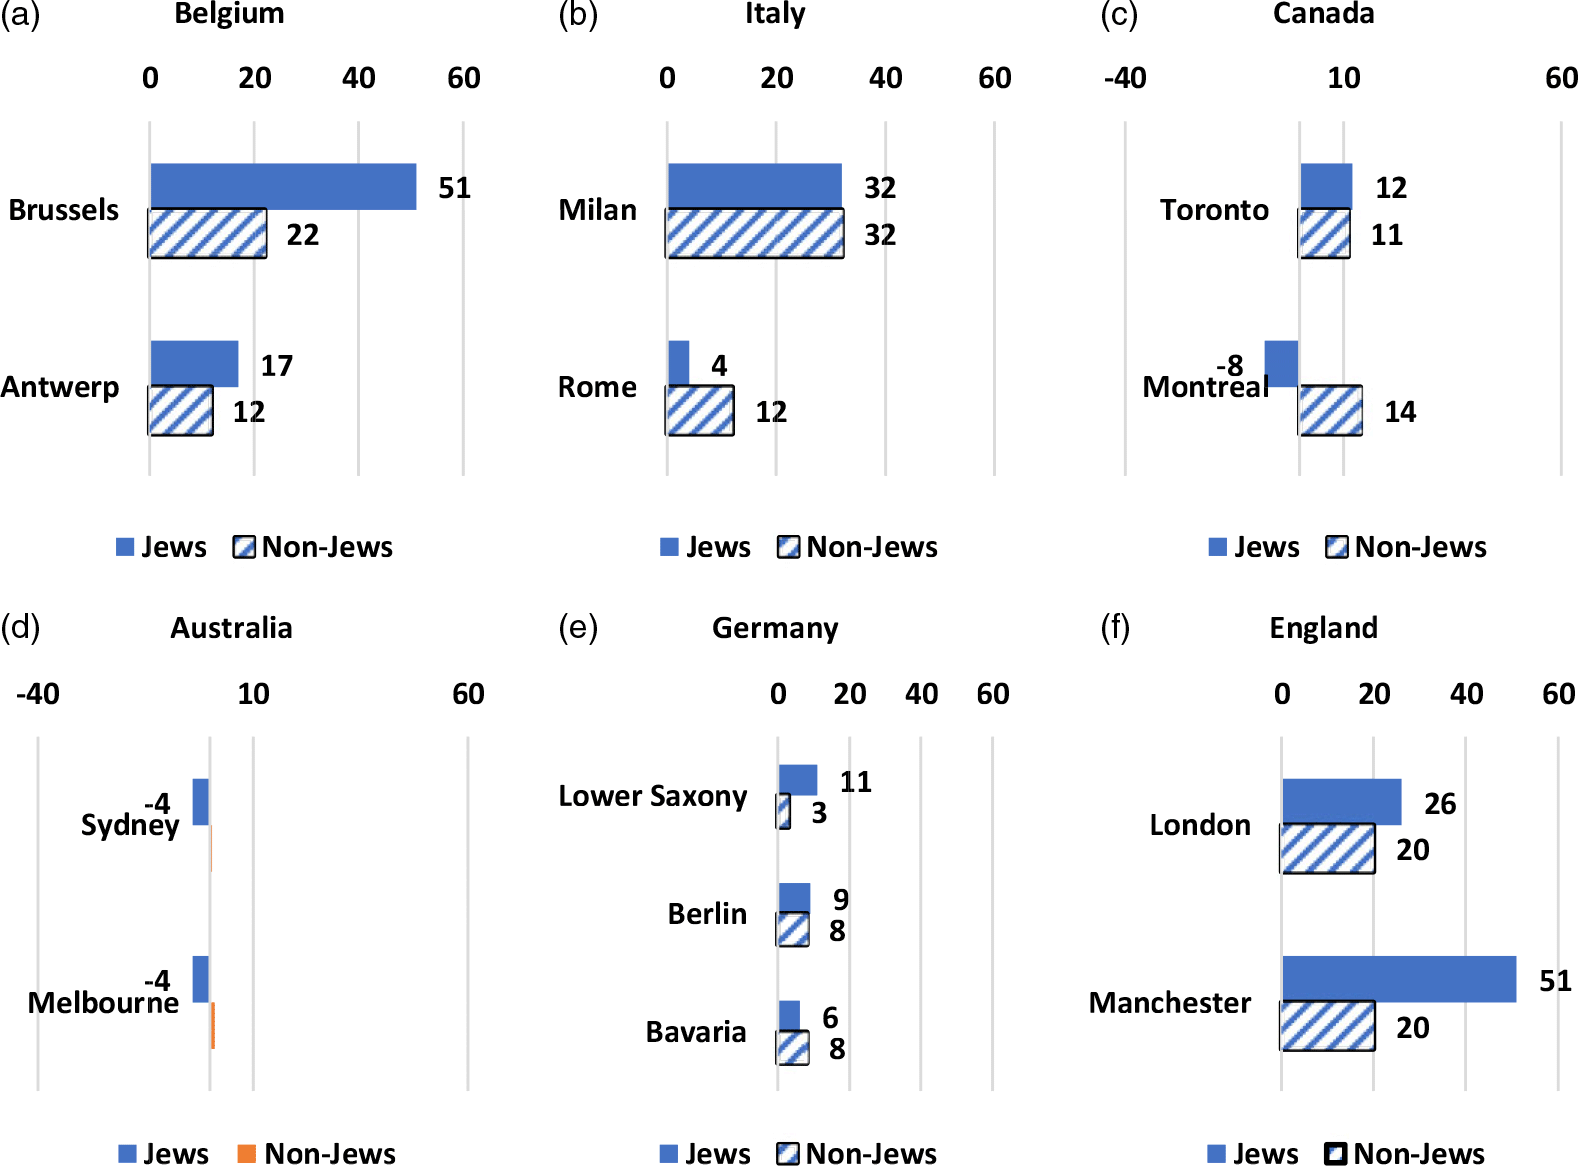
Looking inside selected Jewish communities reveals that there is also a significant intra-country heterogeneity of experiences among Jews with respect to the impact of coronavirus. This was already suggested by Figure 1 (compare Paris and Strasbourg in France and Florida and New York in the USA). Figure 2 provides a further illustration. While Brussels and Milan, two major Jewish population centres in Belgium and Italy, respectively, were very strongly affected, Antwerp and Rome were significantly less so. The British Jewish population was severely affected by the pandemic, yet some places (London) fared better than others (Manchester). Whereas the coronavirus pandemic in 2020 had a relatively light touch on the Jewish populations of Germany and Israel, it had a really heavy touch on certain subpopulations of Jews in these countries, namely the strongly religious population of Bnei Brak in Israel and the Jewish populations of Frankfurt in Hesse, and North Rhine in Germany. Among the examples shown here, Australia is the only place with a homogeneous picture of Jewish mortality.
Excess mortality of Jews in 2020, by location inside country: % of deaths above/below the expected level.
Note: (1) The smallest annual number of deaths on which the estimation is based is 33. (2) In Israel, the national estimate relates to the population of Jews and others (i.e. it includes Jews and people unrecognised as Jews by Jewish law (halacha) but forming part of the Jewish sector of Israel), and the estimates excludes Israeli Arabs. For Jerusalem, the estimate relates to Jewish (61%) and Arab (39%) populations; for Tel Aviv and Bnei Brak, it relates to the total population which includes a very small number of Arabs (5% in Tel Aviv and less and 0.5% in Bnei Brak), and these populations are almost exclusively Jewish. The source of figures for ethnic/religious composition of Israeli cities is: Central Bureau of Statistics, Israel. All figures relate to 2020.

There was not, in conclusion, a single ‘Jewish experience’ of coronavirus when it came to the impact of the pandemic on the mortality of Jews. Both across and inside Jewish communities, a significant diversity of situations prevailed.
Jews compared to non-Jews
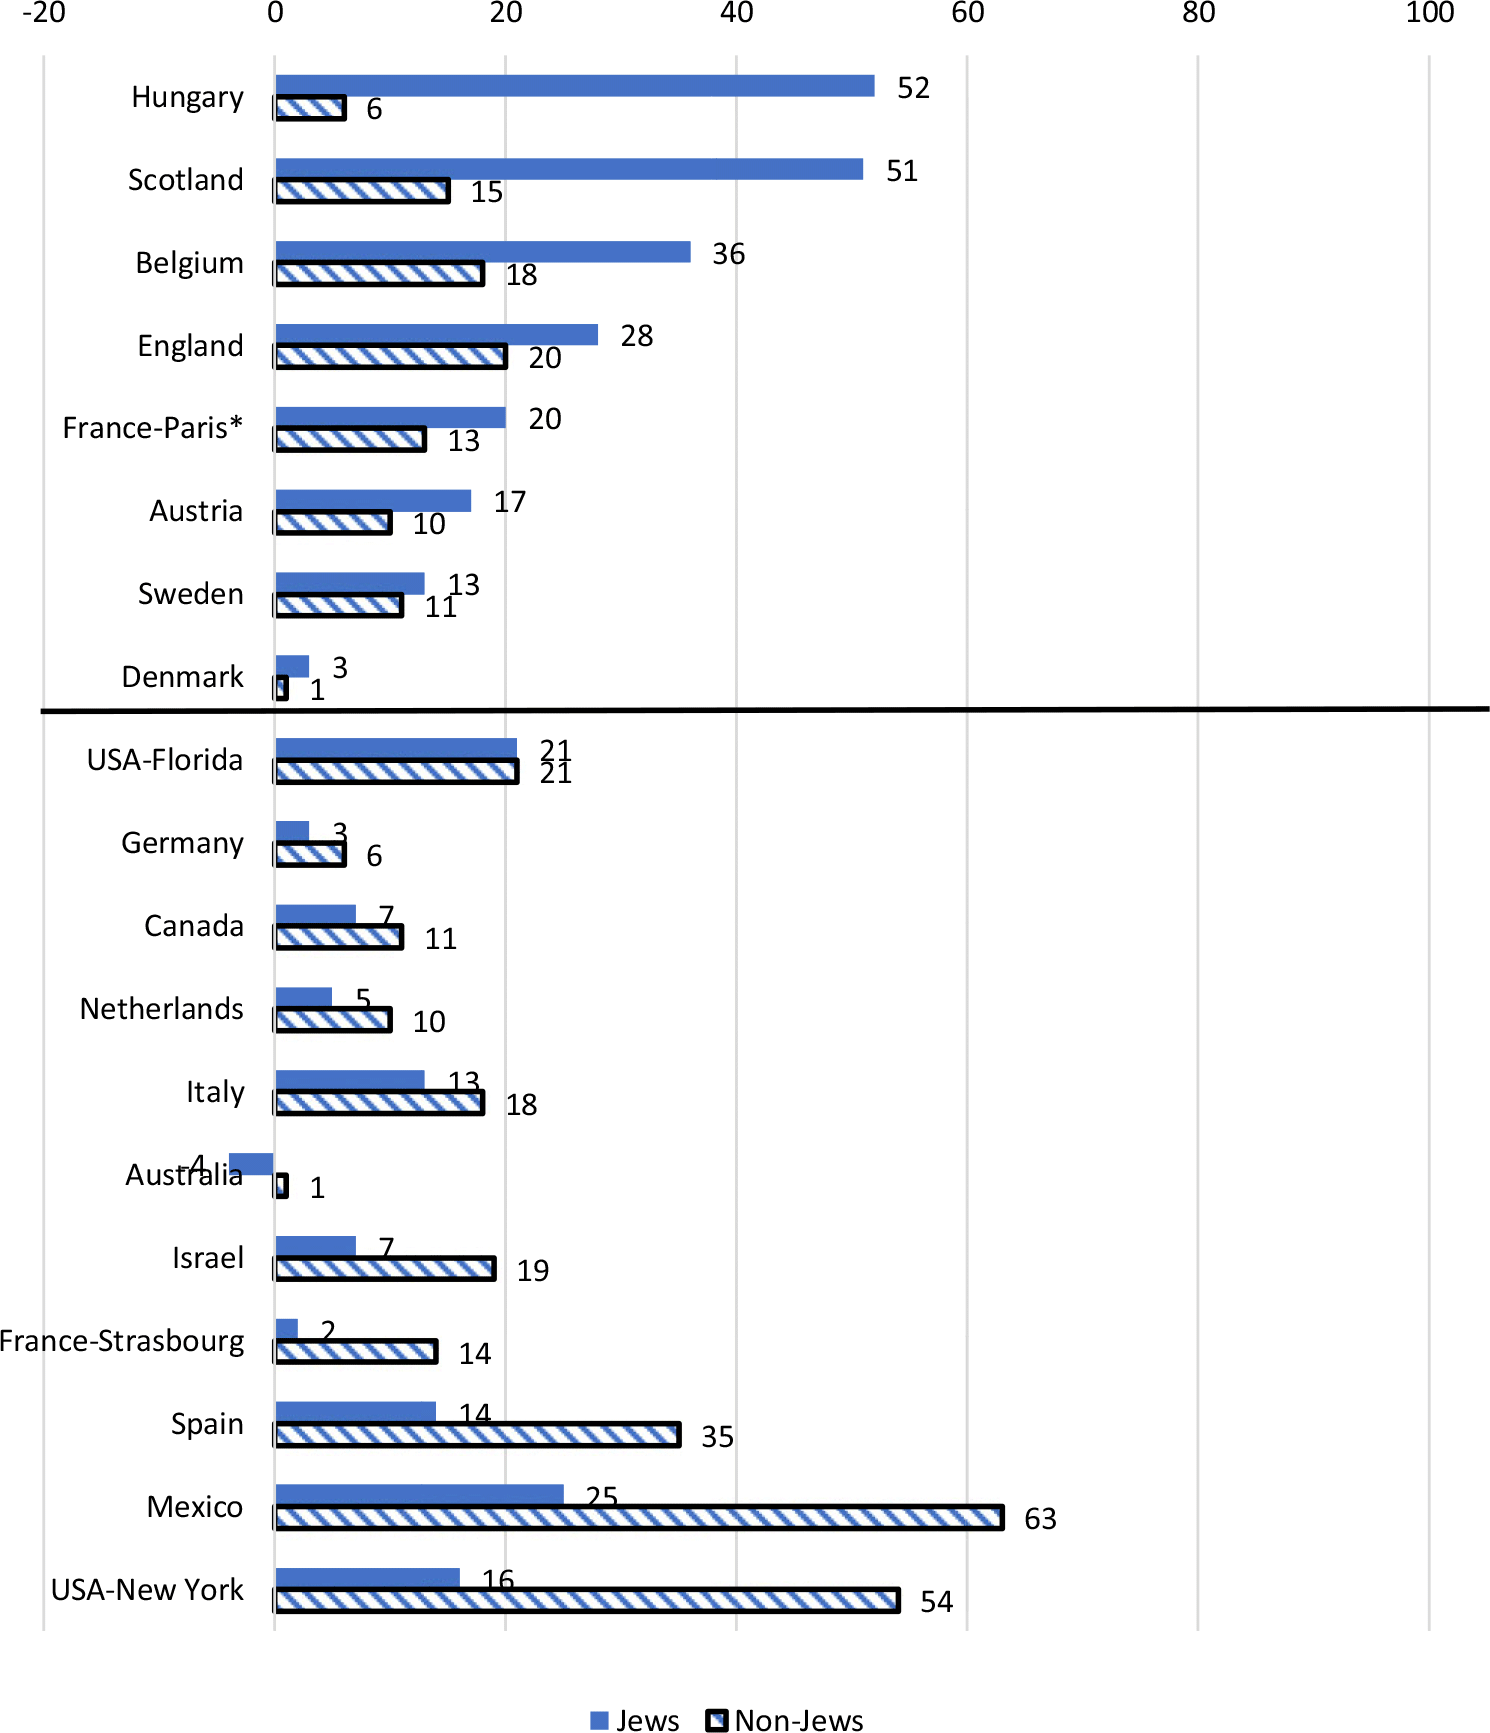
Let us now compare Jews to non-Jews. Out of 19 locations featured by Figure 3, the excess mortality among Jews was higher relative to non-Jews in eight locations: Hungary, Great Britain (both England and Scotland), Belgium, Paris-France, Austria, Sweden and Denmark. We henceforth relate to the phenomenon of a relatively high excess mortality among Jews compared to non-Jews as a ‘Jewish penalty’. Communities with a Jewish penalty are located in the top panel of Figure 3. In 10 locations, excess mortality of Jews was lower than among non-Jews, in some places very considerably so (bottom panel of Figure 3): Mexico, New York-USA and Spain especially stand out in this respect. Thus, in relative terms, there is not a single ‘Jewish experience’ either: some places display the Jewish penalty, others do not. Looking inside selected Jewish communities (Figure 4) sends much the same message.
Excess mortality of Jews and non-Jews in 2020, by country: % of deaths above/below the expected level.
Note: (1) Notes 1–2 to Figure 1 apply here. (2) In Israel, the estimate for non-Jews relates to Israeli Arabs. (3) The exact geographies in this exhibit correspond to the geographies in Figure 1; shorter titles for geographical locations (e.g. Belgium, instead of Belgium-Brussels and Antwerp) are used here simply for readability.

Excess mortality of Jews and non-Jews in 2020, by location inside a country: % of deaths above/below the expected level.

The positioning of Israeli Jews deserves a special mention. The excess mortality among Jews in Israel is lower than among Israeli Arabs, and it is also lower than in many Western countries. The latter outcome owes significantly to the youthful age structure of Israeli Jews. The indicator of excess mortality does not control for the age structure; while this may not present a serious problem when populations with broadly similar age structures are compared, the situation with Israeli Jews is different. About 5% of the British population and only 1.5% of Jews in Israel are aged 80 years and over – a significant difference. Experimentally, we applied the same set of infection rates and coronavirus case fatality ratios to two model populations of identical size: one with the Israeli Jewish age structure and another with the British structure. We found that the number of excess deaths in a population with the British age structure would have been 1.5 times higher than in the population with the Israeli Jewish age structure, other things being equal. This would suggest that had Israeli Jews possessed the British age structure, their excess mortality would have been closer to the levels observed among non-Jews in Canada, the Netherlands, Austria and Sweden (all around 10%–11%)Footnote 1 . We will return to the impact of age structure on the excess mortality of Jews in the next section.
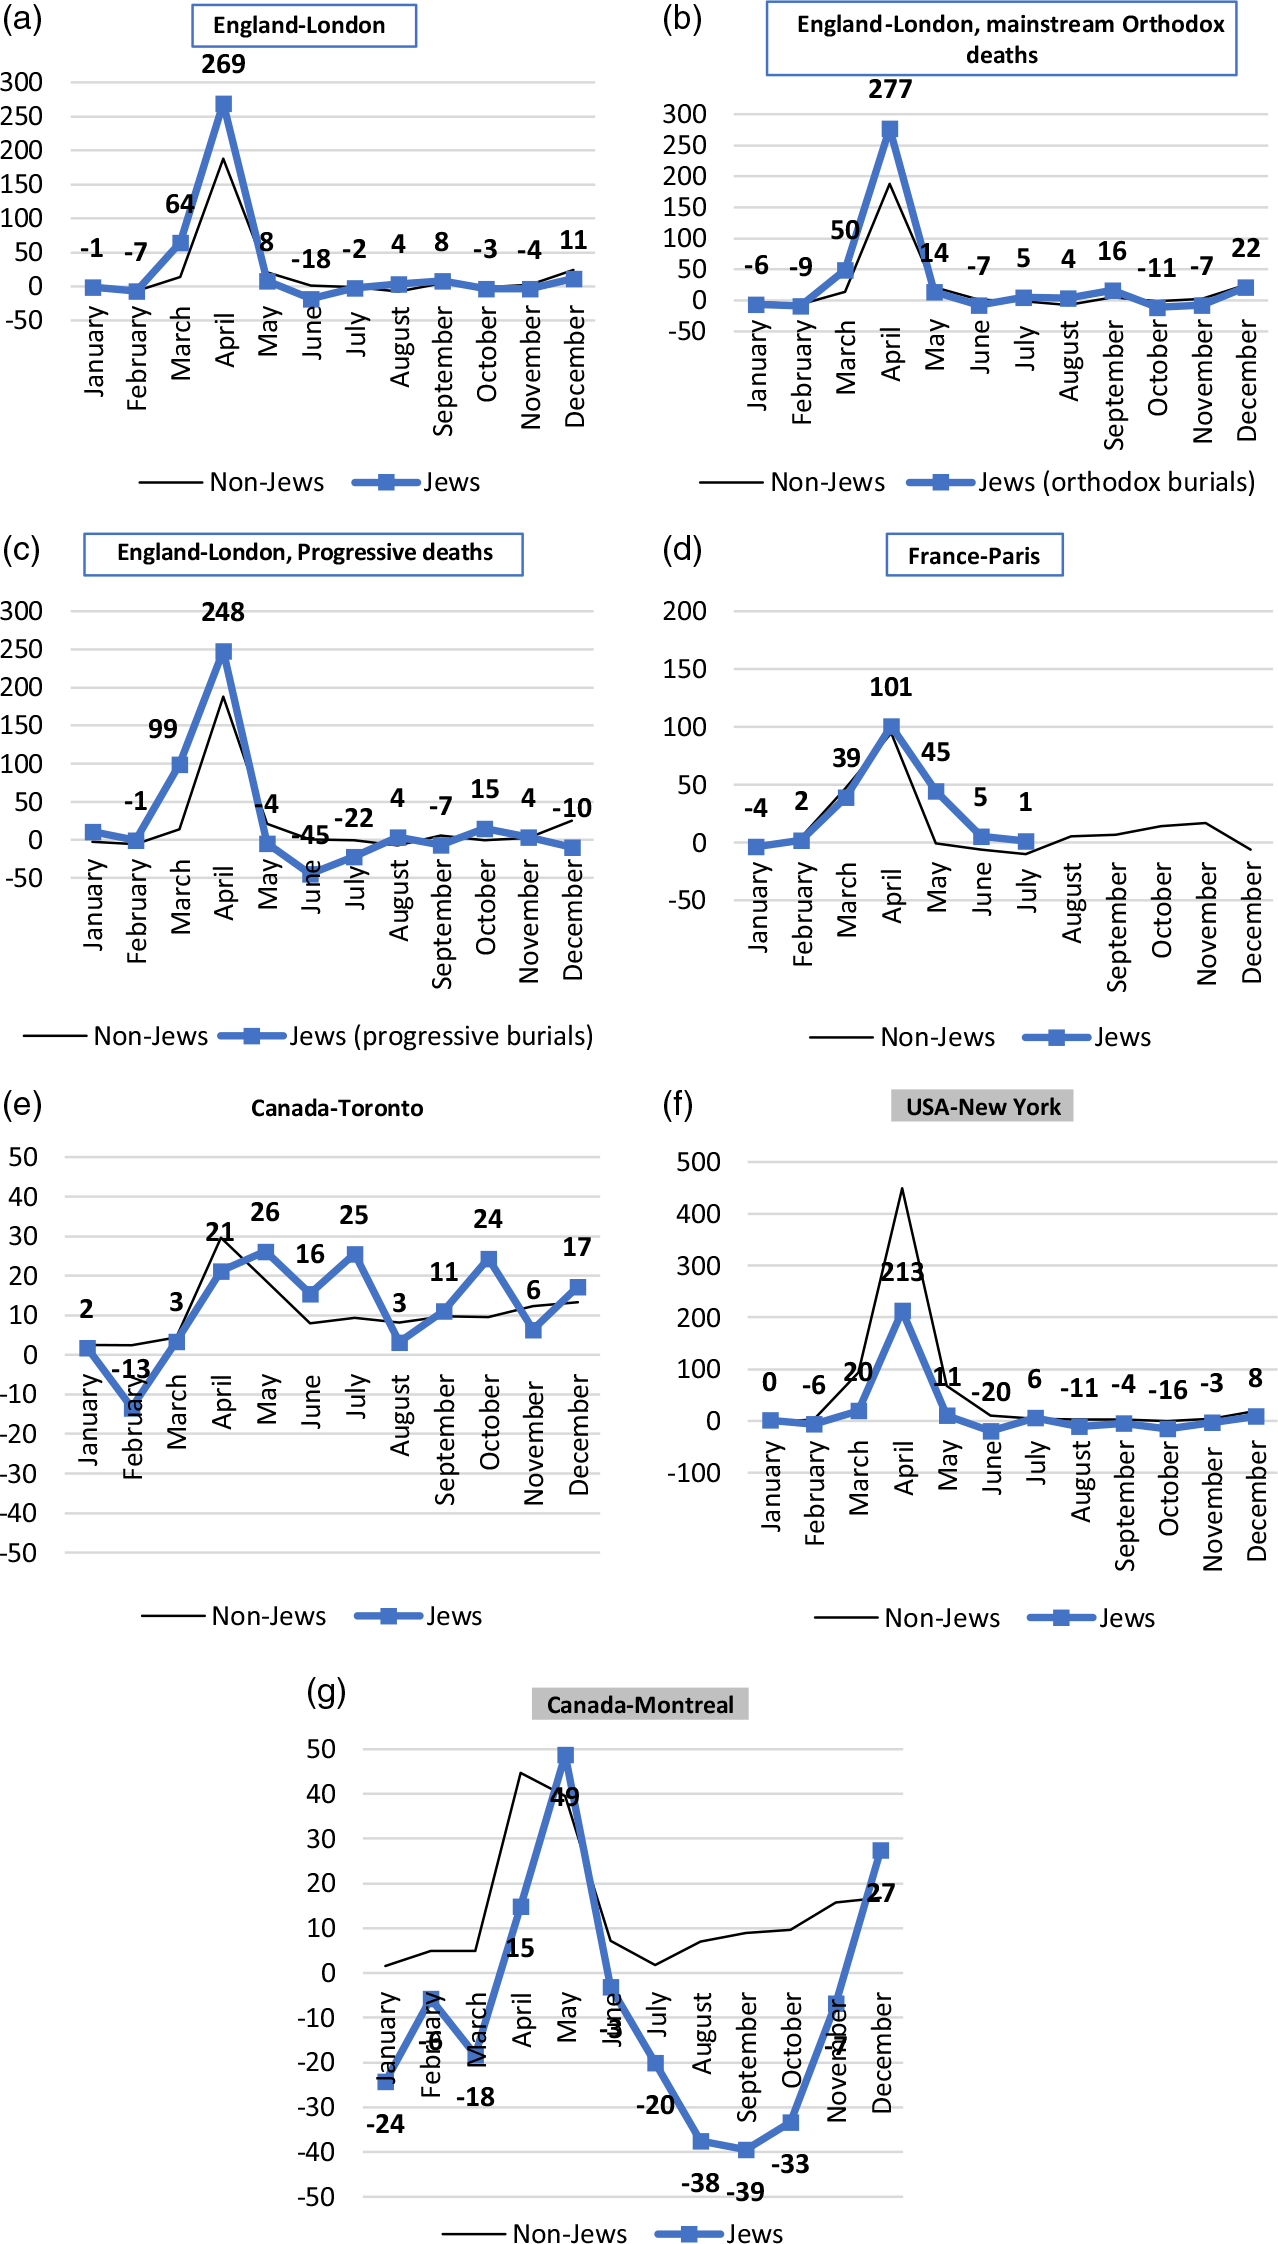
In the remainder of this section, we will look closer at the timeline of the coronavirus pandemic among Jews and non-Jews in selected countries. We only present locations in the Jewish Diaspora where the monthly average number of Jewish deaths exceeds 30, to avoid drawing conclusions based on volatile numbers. Examination of the timeline of the pandemic suggests that those locations with a Jewish penalty in 2020 (e.g. London and Paris, titles framed) ended up this way because of momentary strong surges of mortality (Figure 5). Especially in London but also in Paris, the surges developed early, and they brought Jewish excess mortality far above the levels observed among non-Jews. The surges were followed by a period of convergence of Jewish excess mortality towards the levels observed in the general population of these locations. Thus, the overall, annual, relatively high excess mortality among Jews (i.e. the Jewish penalty) was a net outcome of strong mortality surges far above the levels observed among non-Jews, followed by periods of broadly comparable levels of excess mortality. It is interesting to observe that the more religiously observant Jews (in London) were no different from the less religiously observant (progressive) in the pattern of pandemic that was displayed. This pattern, in essentials, was also observed in other locations with a Jewish penalty, apart from London and Paris: for example, in the Jewish communities of Stockholm, Milan and Vienna (not shown here separately). In Toronto, the annual Jewish excess mortality was comparable to the levels observed in the total population in the year 2020 – that too was a net outcome of surges and falls.
Excess mortality of Jews and non-Jews in 2020, for selected locations: % of deaths above/below the expected level.
Note: (1) The smallest average monthly number of deaths on which the estimation is based is 30. (2) In New York, the estimate relates to the Jewish population of Queens and Long Island. (3) Vastly different scales are adopted deliberately across the panels; the emphasis is not on comparing the scale of the pandemic in across different communities/locations but on the detailed developments in each community across time.

Locations with relatively low excess mortality among Jews during the whole year of the pandemic (e.g. New York and Montreal, titles shaded, and also Mexico, not shown graphically) are characterised by a relatively low excess for most months of the pandemic. To be sure, the pandemic is clearly visible in these Jewish populations and surges of mortality occur there too. Yet these surges never ‘overtook’ similar surges happening among non-Jews; in-between surges, the excess mortality of Jews remained relatively low, and so the net annual outcome in these Jewish communities was very different from the first group: in the end, the latter group had a relatively low excess mortality.
Explanations considered
Descriptive analysis so far has raised several questions. What accounts for the variety of levels of excess mortality in Jewish communities across and within different countries?
What accounts for a wide spectrum of situations relative to non-Jews, specifically the presence of the Jewish penalty in mortality in some Jewish communities and its absence in others? What accounts for the observed disproportionate surges in the excess mortality of Jews? We maintain that the question of a Jewish penalty is the most fundamental of all. The Jewish penalty is seemingly at odds with the currently observed patterns of relatively low Jewish mortality.
The state of health
It would be only natural for a scholar equipped with the knowledge of Jewish mortality patterns prior to the coronavirus pandemic (i.e. as a rule, a relatively low mortality of Jews compared to non-Jews due to socio-economic and cultural factors alike) to expect that the excess mortality of Jews from COVID-19 would be low relative to non-Jews. This subject has been thoroughly covered in the Introduction. In the context of the coronavirus pandemic in the Diaspora, some Jewish communities in North America (New York in the USA, Montreal in Canada and Mexico), Europe (e.g. Spain, the Netherlands and Germany) and Australia arguably ‘live up’ to this expectation. They do not display a Jewish penalty and even display some Jewish advantage. This is not the case with respect to Austrian, Belgian, Swedish and British Jews, as well as Jews living in Paris. The mortality patterns of British, Belgian and Austrian Jews are the best documented; their non-COVID mortality is lower than the mortality of the surrounding non-Jewish population (Staetsky Reference Staetsky2011a, 2021a; Staetsky and DellaPergola Reference Staetsky and DellaPergola2020, p.28; Staetsky and DellaPergola Reference Staetsky and DellaPergola2022, p.62). Given how well established the finding of relatively low Jewish mortality is, there are sound reasons to assume that Swedish Jews are no different from their British, Belgian and Austrian counterparts. Why a Jewish penalty then? If we cannot reconcile the fact of a Jewish penalty with what is already known about Jewish mortality then perhaps, despite many years of observation and analysis, we have no proper understanding of Jewish mortality at all. If we could find an explanation for a Jewish penalty, it could serve us as a metaphorical ‘key that opens all doors’ with respect to other questions as well.
The age factor?
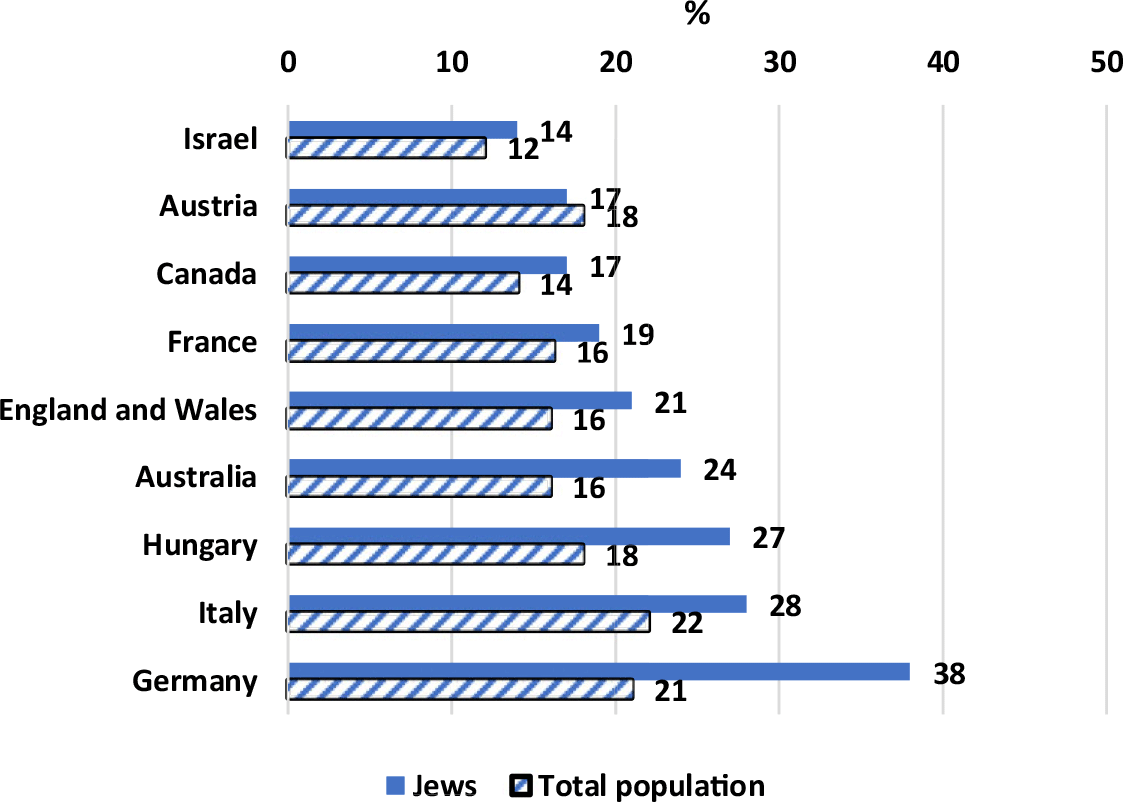
The indicator of excess mortality does not hold the age structure of populations constant, as previously mentioned. Excess mortality due to coronavirus is concentrated in the older age groups. Theoretically, the relatively high proportion of old people in Jewish communities could be responsible for the Jewish penalty. Yet, this does not seem to be the case. It is true that many, albeit not all, Diaspora Jewish communities and populations are older than non-Jews surrounding them, as Figure 6 clearly demonstrates.
Percentage aged 65+ years in selected Diaspora Jewish populations and in Israel, 2002–2018.
Source: Non-Jews: European populations, except France: Human Mortality Database (2020); France: Cohen (Reference Cohen2015). Non-Jews in Australia: Australian Bureau of Statistics (2021). Non-Jews in Canada: Brym et al. (Reference Brym, Neuman and Lenton2019).
Israel (Jews and non-Jews): Statistical Abstract of Israel 70.
Jewish populations: (1) Austria (around 2016): assessment on the basis of Staetsky and DellaPergola (Reference Staetsky and DellaPergola2020); (2) France (2002): Cohen (Reference Cohen2015); (3) Germany (around 2019): Zentralwohlfahrtstelle der Juden in Deutschland (2020); (4) Office for National Statistics (2021); (5) Hungary (around 2015): Kovacs and Barna (Reference Kovacs and Barna2018). (6) Italy (around 2017): central register of the Italian Jewish community; (7) Canada (around 2016): Brym et al. (Reference Brym, Neuman and Lenton2019); and (8) Australia (around 2016): Australian Bureau of Statistics (2021).

Still, the patterns of a Jewish penalty and the relative agedness of Jews are not correlated. Simply put, the most aged Jewish populations (e.g. Germany, Australia and Italy, all located at the bottom panel of Figure 1) were not the communities with the highest Jewish penalty, whereas the relatively young Jewish community of Austria displayed a Jewish penalty (top panel of Figure 1). Further, detailed investigation into mortality from coronavirus in the context of the British Jewish community has shown that during the first wave of the pandemic (March–May 2020), British Jews exhibited relatively high coronavirus mortality even when the age structure and several indicators of socio-economic and health status were controlled for (Gaughan et al. Reference Gaughan, Ayoubkhani, Nafilyan, Goldblatt, White, Tingay and Bannister2021).
The importance of age structure for understanding differences in the scope of coronavirus mortality between countries was evaluated early in the course of the pandemic (Balbo et al. Reference Balbo, Kashnitsky, Melegaro, Mesle, Mills, de Valk and de Vilhena2020; Dowd et al. Reference Dowd, Andriano, Brazel, Rotondi, Block, Ding, Liu and Mills2020; Esteve et al. Reference Esteve, Permanyer, Boertien and Vaupel2020; Kashnitsky and Aburto Reference Kashnitsky and Aburto2020). Yet, it was also shown that, ultimately, although important, age differences between populations do not exclusively explain the observed differences in the volume of coronavirus mortality. Bilinski and Emanuel (Reference Bilinski and Emanuel2020) demonstrated that countries with the highest levels of COVID-19 mortality (e.g. the USA) were not the countries with the oldest age structure, whilst countries with old age structures (e.g. Germany) have a low volume of coronavirus mortality. These insights correspond well with our understanding of the role of age structure among Jews.
We do not claim that age structure is not important. In fact, we have shown that youthful age structure lowered the excess mortality in the Jewish population of Israel putting it at a significant advantage with respect to coronavirus relative to many Western European populations. Rather, having acknowledged the importance of age structure, we claim that it cannot explain the Jewish penalty.
Prevalence of infection
The prevalence of infection remains as a candidate for explaining the Jewish penalty once alternatives – the age structure of Jewish populations or their health status – are eliminated, or at least shown as insufficient in explanatory power. The prevalence of the COVID-19 infection has been shown to differ between cultural, ethnic and racial groups. In pre-vaccinated populations globally, the antibody prevalence for COVID-19 was two to three times higher in Black and Asian populations compared to the White population (Bobrovitz et al. Reference Bobrovitz, Arora, Cao, Boucher, Liu, Donnici, Yanes-Lane, Whelan, Perlman-Arrow, Chen, Rahim, Ilincic, Segal, Duarte, Van Wyk, Yan, Atmaja, Rocco, Joseph, Penny, Clifton, Williamson, Yansouni, Grant Evans, Chevrier, Papenburg and Cheng2021). In England, these differences were confirmed even when a variety of demographic and socio-economic factors (e.g. age, sex, region, deprivation, household size and employment) were controlled for (Ward et al. Reference Ward, Atchison, Whitaker, Ainslei, Elliott, Okell, Redd, Ashby, Donnelly, Barclay, Darzi, Cooke, Riley and Elliott2020). The prevalence of coronavirus infection was shown to be relatively very high among the British strictly Orthodox Jewish population in 2020: overall seroprevalence of 64%, in contrast to 7% nationally and 11% in London (Gaskell et al. Reference Gaskell, Johnson, Gould, Hunt, Stone, Waites, Kasstan, Chantler, Lal, Roberts, Goldblatt, Eggo and Marks2021). The prevalence of infection among non-strictly Orthodox British Jews remained unknown. In Israel, the overall prevalence of infection was put at 4%–5% in July–September 2020 (Reicher et al. Reference Reicher, Ratzon, Ben-Sahar, Hermoni-Alon, Mossinson, Shenhar, Friger, Lustig, Alroy-Prei, Anis, Sadetzki and Kaliner2021); among strictly Orthodox Jews in Bnei Brak, the equivalent figure stood at 9% (Central Bureau of Statistics 2020). While the national prevalence of infection in Israel fitted well into the spectrum of prevalence typical of high-income (and relatively low infection) countries, the prevalence among the strictly Orthodox Jews in Israel and Britain was better aligned with the much higher infection levels observed, for example, in Latin America and the most affected populations in the high-income countries (Bajema et al. Reference Bajema, Wiegand, Cuffe, Patel, Iachan, Lim, Lee, Moyse, Havers, Harding, Fry, Hall, Martin, Biel, Deng, Meyer, Mathur, Kyle, Gundlapalli, Thornburg, Petersen and Edens2020; Bobrovitz et al. Reference Bobrovitz, Arora, Cao, Boucher, Liu, Donnici, Yanes-Lane, Whelan, Perlman-Arrow, Chen, Rahim, Ilincic, Segal, Duarte, Van Wyk, Yan, Atmaja, Rocco, Joseph, Penny, Clifton, Williamson, Yansouni, Grant Evans, Chevrier, Papenburg and Cheng2021).
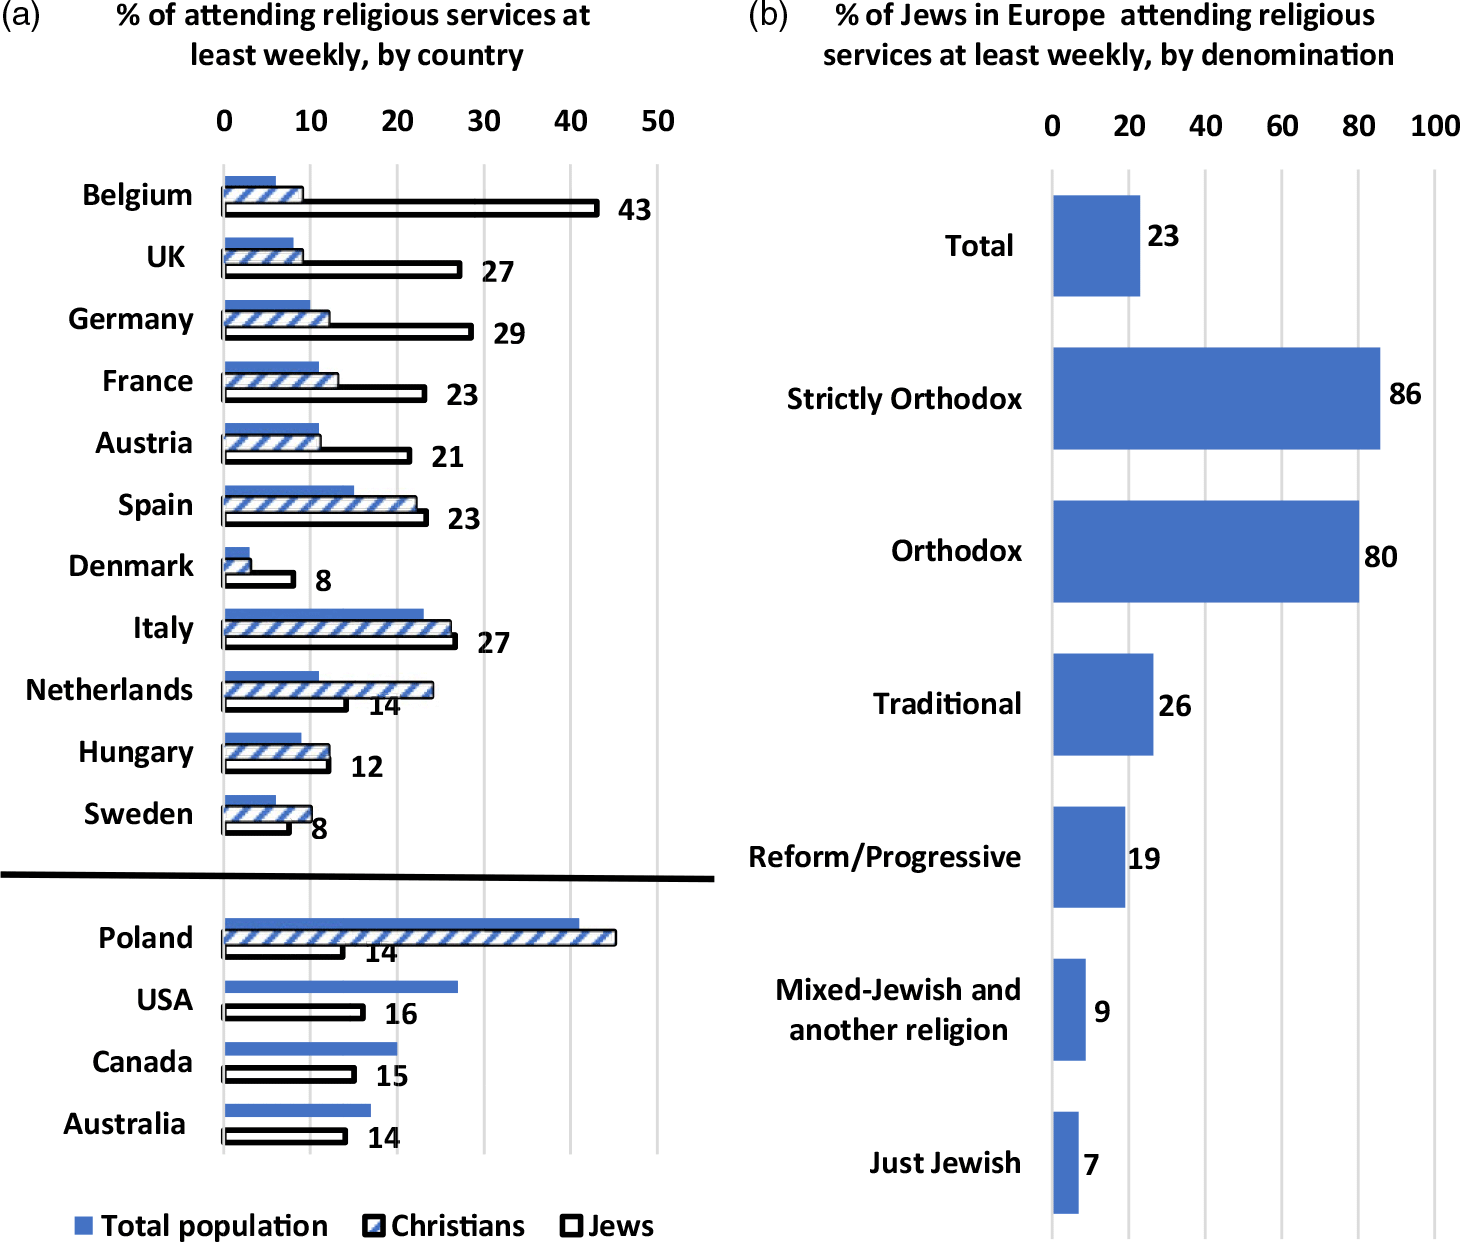
The information on the prevalence of coronavirus infection presented so far cannot and does not help us to properly evaluate the impact of that factor on the Jewish penalty. For that to happen, we need information on the prevalence of infection for all Diaspora Jewish communities and for their non-Jewish counterparts. Such information simply does not exist. What underlies our decision to highlight the prevalence of infection as a possible factor responsible for Jewish penalty is what we choose to label as the relatively high ‘Jewish sociability’, that is related directly or tangentially to a relatively more intense Jewish religious life. Figure 7 gives an idea of how Jews compare to non-Jews in terms of their attendance of religious services, an indicator highly relevant in the context of the coronavirus pandemic. Becoming infected with COVID-19 requires exposure to carriers of the virus, and that exposure is facilitated by social contact, especially in enclosed spaces, such as a synagogue. Participation in religious worship is one of the forms of such contact, and it is more prevalent among Jews than non-Jews. Figure 7 presents the levels of attendance registered around 2018–2019, that is, before the eruption of the coronavirus pandemic; these levels apply during the initial stages of the pandemic when the extreme infectiousness of COVID-19 was not well understood, and the official measures against social mixing were not in place.
Attendance of religious services at least weekly, 2018–2019, %.
Source. Jews: European Jewish populations: European Union Fundamental Rights Agency 2018 survey of Jews in Europe (GESIS Data Archive, Cologne, ZA7491); Canada: Brym et al. (Reference Brym, Neuman and Lenton2019); Australia: Graham and Markus (Reference Graham and Markus2018): USA: Pew Research Center (2021). Non-Jews: Pew Research Center (2018), Appendix B, except USA; USA: Pew Research Center (2021).
Note. Average values for each denomination in Panel B are based on 12 European countries shown in Panel A.

Panel A of Figure 7 shows that out of 12 European countries with available statistics, in 11 countries attendance of religious services by Jews was higher than among non-Jews. In six instances, it was higher than among self-identifying Christians in these countries. In Europe, the gap between Jews and non-Jews was especially wide in Belgium, UK, Germany, France and Austria – all locations where the Jewish penalty in some form was observed (Figures 3-4). Outside of Europe, in the USA, Canada and Australia – all places without an observable Jewish penalty – levels of attendance of religious services of Jews are broadly comparable to the levels among non-Jews. Panel B of Figure 7 gives additional insights. First, the level of attendance of religious services (23%) among Jews in Europe is almost two times higher the level seen among non-Jews in the same group of countries (mostly in the range of 3%–11%, with Italy and Poland being most prominent exceptions with higher values). Second, it is only the least religiously observant subgroups in Jewish communities (e.g. people self-identifying as ‘Just Jewish’ or Reform/Progressive) that display the levels of attendance of religious services seen in non-Jewish populations.
To clarify, Jewish sociability is only partly related to the ideational content of Judaism or religious belief as such. Rather, the term relates to the Jewish tendency to congregate together as part of their religious worship but also beyond the rather clearly defined limits of worship as such. In a sense, synagogue attendance is just the tip of the iceberg, a window into a wide range of social-religious events. Sociability is an umbrella term for various activities such as weddings, bar/bat mitzvah (religious coming of age) celebrations or particular communal celebrations such as the Purim holiday in mid-March 2020. Specifically, it should be remembered that in 2020, Purim celebrations occurred around 9/10 March – which was 1 or 2 days before the imposition of the earliest lockdown in the group of European countries featured in the exhibit above (Denmark, 11 March 2020). It is possible, though it has not been proven beyond reasonable doubt, that Purim celebrations in some communities turned into super spreader events. The Jewish penalty in these communities could arise as a joint outcome of a chance event (the existence of one or more infected individuals in the community), the effect of which was enhanced by the types of intense social contact we have mentioned, resulting in high rates of infection. Thus, in our view, a Jewish penalty is not a destiny. It is an outcome of specific circumstances: a meeting point of a chance (infection) and a risk factor (sociability). This understanding accommodates the fact that some Jewish communities display a Jewish penalty, while others do not. It also clarifies the presence and the role of strong and short-lived surges in excess Jewish mortality in some communities – the surges that critically shape Jewish penalty.
The last caveat is the issue of household size and the special situation of the strictly Orthodox Jews. Excess mortality in two strictly Orthodox Jewish populations – in Antwerp, Belgium and Bnei Brak, Israel – was higher than in the surrounding populations, despite the very young age structure of strictly Orthodox Jews. The especially intense religious lives of strictly Orthodox Jews mean that they are situated at the higher end of sociability. In addition, their households are much larger than households of other Jews and non-Jews: the average household size of strictly Orthodox Jews is situated in the range of 5–6 persons, in contrast to 2–3 persons characteristic of most Western populations (Staetsky and Paltiel Reference Staetsky and Paltiel2020, p. 28). Very large households mean increased interaction, especially in enclosed spaces, and constitute another risk factor in the context of communicable diseases. The high excess mortality from coronavirus among strictly Orthodox Jews is not surprising. It is important to note, however, that in Israel, strictly Orthodox Jews constitute about 17% of the Jewish population, in Austria and the UK – they are about 20%–25% of all Jews, and in Belgium 35% of Jews (Staetsky Reference Staetsky2022). These are minority populations that cannot have a critical impact on the Jewish penalty where and when it is observed. Strictly Orthodox Jews may contribute to the Jewish penalty, but it is non-strictly Orthodox Jewish populations that shaped it exclusively or even predominantly.
Contribution
There was no single pattern of ‘victimisation by coronavirus’ that all Jewish communities followed. Both in absolute and in a relative sense, a wide variation in excess mortality was observed both across and inside Jewish communities in 2020. Some communities were significantly affected, others very lightly or not at all. In relative terms, some Jewish communities were more affected than non-Jews around them, others less so. We labelled the phenomenon of relatively high excess mortality as a Jewish penalty. The pattern of Jewish penalty was not dominant globally: less than a half of all Jewish communities who made their data available to us displayed it. Yet it required an explanation. To date, research on ethnic and religious differences in mortality has identified Jews as a low mortality group. Their relatively high mortality in the coronavirus pandemic did not correspond to this understanding.
We proposed that the Jewish penalty may have arisen from the greater Jewish sociability (i.e. a relatively intense social life of Jews), their greater interconnectedness which is interwoven with, or a part and parcel of, their religious activities. We consolidated evidence in support of a relatively high Jewish social religiosity and dismissed some competing explanations (e.g. the age structure of Jewish communities). Thus, the status of Jews as a low mortality group under a Western epidemiological regime, when mortality and morbidity are dominated by non-communicable diseases, does not stand in contradiction to a higher vulnerability among Jews to coronavirus.
In fact, our findings fit well into the notion of a ‘Jewish pattern of mortality’ developed by Staetsky and Hinde (Reference Staetsky and Hinde2015). The underlying mortality of Jews is indeed low, as a rule. Still, certain factors may temporarily suppress this tendency. Specifically, coronavirus managed to have a relatively high impact on certain Jewish communities because of the developed social ties which facilitated the spread of infection. Metaphorically speaking, socio-economic and cultural factors shaping relatively low Jewish mortality ‘locked horns’ with sociability during the pandemic in determining the Jewish death toll in the pandemic. The latter won, but for a short time and only in some locations. In certain Jewish communities, coronavirus momentarily caused a significant elevation of mortality, beyond the levels seen among non-Jews. Ironically, the very social ties that spread the infection constitute an asset, a protective factor, in the context of non-communicable diseases (Cohen and McKay Reference Cohen, McKay, Baum, Taylor and Singer1984).
It is important to mention in this context that non-Jewish populations, used here as comparators, were themselves rather heterogenous with respect to coronavirus mortality and with respect to sociability. Some non-Jewish subgroups in any particular location, for example, London, may have shown patterns similar to those shown by Jews, but these will not be large enough to be visible in the data for London as a whole. The London average, for example, will be necessarily a mixture of different realities: hotspots of coronavirus infection and mortality on the one hand, and coronavirus-free populations, on the other hand. Jewish penalty cannot and should not be construed as a disadvantage relative to the surrounding non-Jewish society as a whole and uniformly but, rather, as Jews turning into a hotspot of coronavirus mortality in a particular context, existing alongside other possible hotspots. Our proposed explanation, as above, tackles this question precisely: what turned Jewish communities into hotspots of coronavirus mortality in certain contexts?
Outside of the field of Jewish demography, the hypothesis linking social and religious involvement to a greater prevalence of coronavirus has been already advanced in the context of European societies (Albertini et al. Reference Albertini, Sage and Scherer2020, Laliotis and Minos Reference Laliotis and Minos2020, Oksanen et al. Reference Oksanen, Kaakinen, Latikka, Savolainen, Savela and Koivula2020, Sage et al. Reference Sage, Albertini and Scherer2021). Over and above developing the notion of a ‘Jewish pattern of mortality’, our findings lend further support to this line of thinking. The fate of Jewish communities displaying a Jewish penalty should serve as a cautionary tale, when it comes to policy, for other ethnic and religious minorities which are characterised by vibrant social religiosity. It should also serve as an analytical insight when it comes to epidemiology. To understand the role of sociability properly, data on religious attendance and other types of religious and cultural involvement predicated on social contact ought to be routinely included in epidemiological datasets. If indeed religious sociability is an important factor shaping Jewish and other ethnic penalties, a modification of behaviour in religious settings could help mitigate the risks. Attributing penalty to ‘stress-induced conditions resulting from religious prejudices’, as some have done (see Gaughan et al. Reference Gaughan, Ayoubkhani, Nafilyan, Goldblatt, White, Tingay and Bannister2021, p. 513), is not only data-free but may be counterproductive to efforts to control the spread of the pandemic. Blaming religious prejudices in society for an ethnic/religious penalty in coronavirus mortality may prevent the development of sensible and life-saving strategies in dealing with the coronavirus pandemic.
It is appropriate to finish on a note of humility. The chief contribution of this article is its thorough documentation of the coronavirus pandemic in Jewish communities across the globe. No other pandemic was documented in a similar way. In our interpretation of the pandemic’s effects on Jewish mortality, we highlight ‘Jewish sociability’, expressing itself in high levels of participation in religious and communal activities, as a major explanatory factor. We emphasise here that the interpretive part of our contribution remains a hypothesis, for which we presented some supporting evidence. Yet, the evidence is exactly that: supporting, and not confirmatory. To come up with confirmatory evidence, individual-level data are needed which would have to include information on religion, religious attendance, social involvement, socio-economic status and demographic characteristics. It is for future research to produce and analyse such data. Further, even remaining at a level of supportive evidence, we cannot unambiguously explain certain specific scenarios observed in the data. Hungarian and Italian Jews, for example, are both relatively aged populations; further, both Jewish populations are not too different from the general population when it comes to the level of religious attendance. Yet, a very significant Jewish penalty is present in Hungary, and no such penalty exists in Italy. Thus, while the possibility of a connection between religious sociability and Jewish penalty is easy to see in some cases (e.g. England and Belgium), it is not so easy to see in others, like Hungary and Italy. Different factors affecting the spread of pandemic and its intensity are likely to intervene in each case, some affect just mortality, others morbidity, still others both, but no more than a speculation can be offered about their interactions or exact paths. The larger context too matters: major social events, for example, sporting events and political rallies, may play a decisive role introducing the virus into the Jewish community. Rather than speculating further, we point out this complexity and call on the scholarly community to closely consider the Jewish sociability hypothesis and bring to the table data and research designs that would help to generate confirmatory evidence for or against the hypothesis.
Acknowledgements
The author also wishes to express his deep gratitude to the many operators of the Jewish burial societies (Hevrot Kadisha) all over the world who made data available to them and who enhanced their understanding with explanations and advice. The author is thankful to the editors and two reviewers, whose comments improved the paper significantly.
Disclosure statements
Funding statement
The author is grateful to the Rothschild Foundation Hanadiv Europe for its generous support for the European Jewish Demography Unit at the Institute for Jewish Policy Research/JPR (London).
Competing interest
The authors have no conflicts of interest to declare.
Ethical approval
The authors assert that all procedures contributing to this work comply with the ethical standards of the relevant national and institutional committees on human experimentation and with the Helsinki Declaration of 1975, as revised in 2008.