NOMENCLATURE
- AFS
-
analogue fidelity scale, %
- fx, fy, fz
-
surge, sway, heave specific force, ft/s2
- g
-
gravitational acceleration, ft/s2
-
 $\dot{h}_{td}$
-
sink rate of main gear at touchdown, ft/s
- H
-
OMCT frequency response
- Hm
-
washout-filter frequency response
- Ht
-
tilt-coordination frequency response
- K
-
washout-filter gain
- Kt
-
tilt-coordination gain
- MFS
-
motion fidelity scale
- N 1
-
engine fan speed, %
- Ns
-
number of stick shakers
- p, q, r
-
roll, pitch, yaw rate, deg/s
- qmax
-
maximum pitch rate, rad/s
- RMSgs
-
RMS of glideslope deviation, dot
- RMSV
-
RMS of indicated airspeed deviation, Kn
- RMS ϕ
-
RMS of roll deviation, deg
- RMS ψ
-
RMS of heading deviation, deg
- s
-
Laplace variable
- tp
-
pedal-response time, s
- V 2
-
take-off safety speed, Kn
- Vr
-
rotation speed, Kn
- Vref
-
reference speed, Kn
- x, y, z
-
surge, sway, heave

Greek Symbols
- Δxtd
-
longitudinal touchdown deviation of main gear, ft
- Δytd
-
lateral touchdown deviation of main gear, ft
- ζ
-
washout-filter damping ratio
- ζ t
-
tilt-coordination damping ratio
- ω
-
washout-filter break frequency, rad/s
- ω t
-
tilt-coordination break frequency, rad/s
Abbreviations
- CAVU
-
ceiling and visibility unlimited
- FL
-
flight level
- GS
-
glideslope
- LOC
-
localiser
- OMCT
-
objective motion cueing test
- RMS
-
root mean square
- RWY
-
runway
- VMS
-
vertical motion simulator
1.0 INTRODUCTION
This paper addresses the question “what fidelity criteria should accompany the diagnostic that quantifies simulator motion cues?” Actuator hardware and software algorithms determine motion cues. Today, during a simulator qualification, engineers objectively measure only the hardware(1). Pilot inspectors subjectively assess the software, but attributing fidelity weaknesses to that software is challenging in a simulator’s integrated cueing environment. ICAO 9625 has an Objective Motion Cueing Test (OMCT) that evaluates the software and hardware together, but it lacks accompanying fidelity criteria(2). Hosman has documented OMCT results for a statistical sample of eight simulators(Reference Hosman and Advani3), which is useful, but having validated criteria would be an improvement.
Sinacori suggested simple criteria(Reference Sinacori4,Reference Schroeder5) , which are in reasonable agreement with much of the literature(Reference Stapleford, Peters and Alex6-Reference Shirachi and Shirley15). These criteria often necessitate motion displacements greater than most training simulators can provide. While some of the previous work has used transport aircraft in their studies, the majority used fighter aircraft or helicopters(Reference Stapleford, Peters and Alex6-Reference Jex, Jewell and Magdaleno11). Those that used transport aircraft considered degraded flight characteristics(Reference Bray12-Reference Shirachi and Shirley15). So, it would be fair to say that earlier criteria lean more towards being sufficient, rather than necessary, criteria for typical transport aircraft training applications. Considering the prevalence of 60 inch, six-legged hexapod training simulators, a relevant question is “what are the necessary criteria that can be used with the ICAO 9625 diagnostic?”
This study adds to the literature as follows. First, it examines well-behaved transport aircraft characteristics but in challenging tasks. Second, it uses the Vertical Motion Simulator (VMS), the world’s largest vertical displacement simulator. This allows inclusion of a relatively large motion condition, much larger than a typical training simulator can provide, so that variations in the conditions can be compared against conditions closer to flight. This ensures some perspective is kept on potentially small motion differences across the configurations. Third, a sufficiently large pilot pool added statistical reliability to the results.
2.0 FLIGHT TASKS
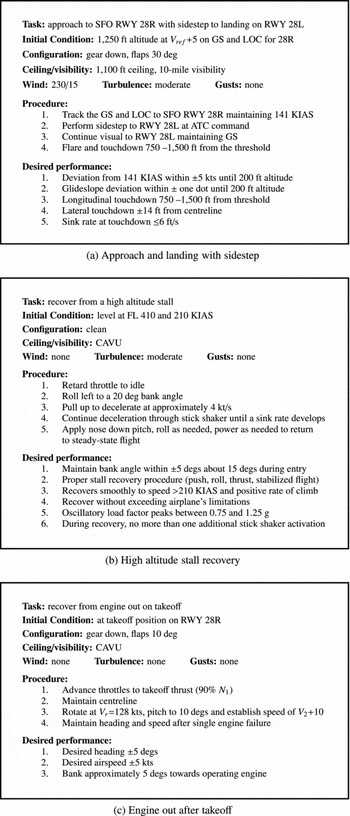
The study had three tasks: a sidestep approach and landing, a high-altitude stall recovery and an engine-out after take-off. The tasks were similar to three of the tasks used in Zaal et al(Reference Zaal, Schroeder and Chung16). The assumption was that varying the motion cues would affect how pilots perform these challenging tasks. Figure 1 shows the flight cards for the three tasks, which the following sections describe.
Experiment flight cards.

2.1 Approach and landing with sidestep
This task began at an altitude of 1250 ft on a − 3° glideslope approach to RWY 28R at San Francisco International Airport. Moderate turbulence, simulated using the Dryden turbulence model, existed throughout(17). After breaking out of the cloud ceiling at 1100 ft, air traffic control instructed the pilots to sidestep to RWY 28L. Pilots tried to maintain a − 3 deg glideslope during the approach followed by landing within a 750-ft-long box with a sink rate of 6 ft/s or less. An audio call-out began at a main gear height of fifty feet and repeated in decrements of 10 ft until touchdown.
This task evaluated if changes in motion cues affect (1) lateral-directional control in the sidestep manoeuvre, (2) speed and flight path control along the glideslope and (3) touchdown performance.
2.2 High altitude stall recovery
The task started during cruise at 210 Kn (M = 0.75) at an altitude of 41,000 ft. Pilots were instructed to initiate a self-induced stall by setting the throttles to idle, rolling 20° left and pitching approximately 15° nose up, decelerating through the stall warning until a negative sink rate was developed (as the aircraft model did not have a pronounced pitch break). To recover from the stall, pilots had to follow the correct recovery sequence of reducing the angle-of-attack (by pitching to approximately 15° nose down), levelling the wings, and applying full throttle until establishing a safe positive climb rate. The task called for the pilots to pull the nose up gently and smoothly so as not to activate the stall warning during the recovery. Moderate turbulence was present.
This task evaluated if changes in motion cues affect the recovery performance by helping a pilot damp the flight path response, as well as stabilise the progressively less-stable roll dynamics near stall.
2.3 Engine out after take-off
During the take-off roll, the task required pilots to rotate at 128 Kn, establish a 10° nose-up pitch attitude, and maintain a steady climb speed of 145 Kn. Either the left or right engine failed randomly at a random altitude after lift-off but below 100 ft. After identifying the failed engine, the pilots needed to apply near full rudder pedal towards the good engine, roll approximately 5° into the direction of the good engine to maintain the desired track and modulate the remaining thrust to maintain speed.
This task evaluated if changes in motion cues affect a pilot’s ability to detect the failed engine promptly and recover using appropriate lateral-directional control.
2.4 Aircraft model
The experimenters modified an existing mid-size twin-engine commercial transport aircraft model with a gross weight of 185,800 lbs for this study. The enhancements allowed for a more representative aircraft response in the stall task. Most significantly, modifications to the lift coefficient as a function of angle-of-attack allowed for typical transport post-stall characteristics. Modifications to the rolling moment coefficient due to roll rate allowed for satisfactory representation of reduced roll stability near stall.
The simulated aircraft had six degrees of freedom and a two-crew cockpit. The aircraft model included a landing gear model, allowing it to taxi, take off and land. The aircraft could operate in the typical transport envelope up to a maximum cruising altitude of 42,000 ft.
3.0 MOTION TUNING
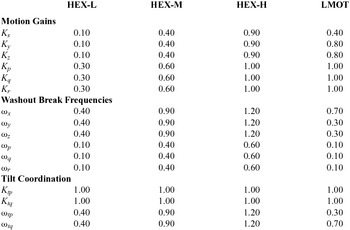
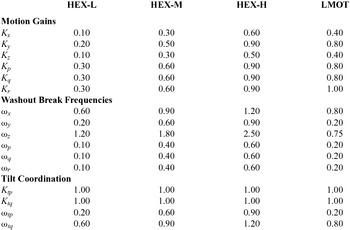
Pilots performed each flight task with four different motion configurations: three hexapod motion configurations (HEX-L, HEX-M and HEX-H) and a large motion configuration (LMOT), see Table 1. The four motion configurations were optimised for each of the three tasks, giving 12 motion configurations in total.
Motion configurations

The experiment used the standard VMS motion algorithm and hardware for all motion configurations (Fig. 2). The equivalent time delays of the VMS motion system for the pitch, roll, yaw, longitudinal, lateral and vertical axes are 47, 68, 48, 50, 69 and 67 ms, respectively. More details about the motion algorithm are provided in the appendix and Beard et al(Reference Beard, Reardon, Tobias and Aponso18). A hexapod algorithm took the accelerations from the VMS motion algorithm and calculated the leg extensions of a typical hexapod motion platform with 60 inch legs(Reference Dieudonne, Parrish and Bardush19). The algorithm accounted for the inherent constraints when trying to simultaneously move a hexapod in several degrees of freedom. Mass and inertia effects of the hexapod system were not taken into account. The hexapod algorithm was used for motion tuning and monitoring purposes only; that is, it was not used to calculate motion inputs for the VMS motion system.
Simulator motion block diagram.

A simulation model of the motion logic, shown in Fig. 2, and a representative test run for each flight task, allowed the tuning of the motion configurations offline by first calculating all possible motion settings that would keep the simulator from hitting motion limits. The various OMCT fidelity regions (determined by a statistical sample of eight simulators) and the Sinacori criteria guided the motion tuning process(2,Reference Sinacori4) . The main tuning goal was to cover a reasonable area of the OMCT fidelity region, while adhering to the hexapod or VMS motion limits. Tuning the parameters of motion washout filters constitutes a trade-off between magnitude and phase error of the simulator motion with respect to the aircraft model motion. A higher gain (smaller magnitude error) generally requires a higher break frequency (larger phase error at lower frequencies). The three hexapod motion configurations employed this trade-off. HEX-L had a low-gain and, consequently, a low-break frequency, HEX-H had a high-gain and high-break frequency, and HEX-M had a gain and a break frequency approximately halfway in between the low- and high-gain and -break frequency values. The large motion configuration, LMOT, had the highest possible gain and lowest break frequency, while adhering to the VMS motion limits.
As the three different tasks had different motions in each degree of freedom, the four motion configurations were optimised for each task. However, the tuning approach for each of the four motion configurations was the same for all tasks; for example, HEX-L was tuned to provide low-gain/low-break-frequency hexapod motion in all three tasks. Gains and washout filter break frequencies for each motion configuration are given in the appendix.
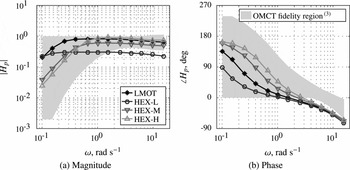
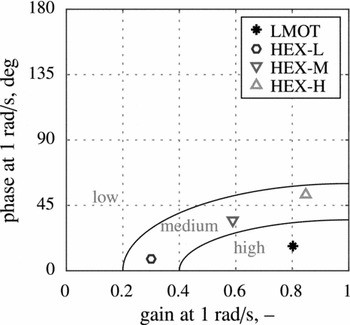
The inputs and outputs of the block diagram in Fig. 2 define the OMCT responses for every degree of freedom. The OMCT was performed for all 12 motion configurations employed in the experiment. Figure 3 provides an example of the OMCT responses for the roll degree of freedom in the high-altitude stall task. Figure 4 depicts the corresponding Sinacori diagram. Note that for this degree of freedom and task, all the hexapod motion configurations have the same predicted fidelity in the Sinacori diagram, in this case, medium fidelity. The large motion configuration has the highest fidelity according to Sinacori.
OMCT roll responses for the stall task.

Stall task roll Sinacori diagram.

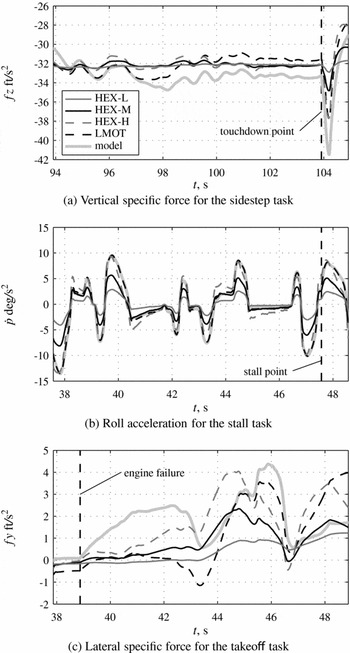
Figure 5 shows time traces of specific forces and angular accelerations of important degrees of freedom for each task to illustrate the differences between motion configurations. The specific forces and angular accelerations from the aircraft model are also shown. Figure 5(a) depicts the vertical specific force at the pilot station for a representative run of the sidestep task near touchdown. The differences in gain between the motion configurations is particularly evident just after touchdown. Figure 5(c) depicts the lateral specific force in the engine out on take-off task near the engine failure. Note that large changes in lateral specific force occur after the engine failure. The simulator lateral specific forces for LMOT are closest to those from the aircraft model. HEX-H produces lateral specific forces with a high gain, but with large phase errors, while HEX-L produces lateral specific forces with a low gain, but with small phase errors. HEX-M is halfway in between HEX-L and HEX-H. Similar observations can be made for the roll acceleration in the high-altitude stall recovery task near the stall (Fig. 5(b)).
Comparison of motion filter accelerations against model accelerations.

4.0 EXPERIMENT DESIGN
4.1 Method
4.1.1 Independent variable
The only independent variable was the motion condition. Each pilot flew all of the motion conditions for each task. Four different motion configurations were used for each of the three tasks: HEX-L, HEX-M, HEX-H and LMOT.
4.1.2 Apparatus
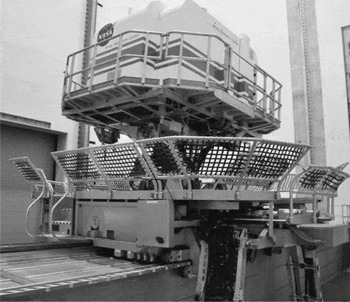
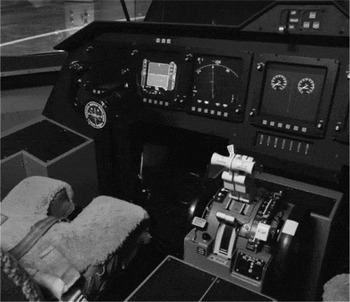
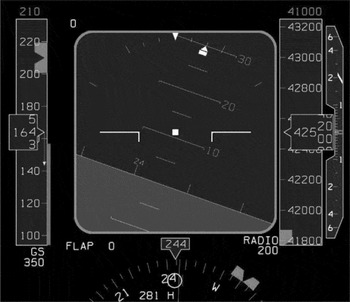
The experiment used the VMS with the transport cab (T-CAB) (Fig. 6)(Reference Beard, Reardon, Tobias and Aponso18). Pilots flew from the left seat; the instructor occupied the right seat. A Primary Flight Display (PFD) was positioned in front of each pilot (Fig. 7). The navigation displays were positioned next to the PFDs towards the centre of the cab. An additional display in the centre of the cab showed the engine parameters. This display changed to showing task performance after each run.
VMS.

Cockpit setup.

A column and wheel controlled the aircraft pitch and roll, respectively. A thumb switch on the wheel controlled the elevator trim. Conventional rudder pedals controlled the rudder deflection in the air and nose wheel steering on the ground. Two throttle levers controlled the power of the two engines. The instructor pilot configured flaps and gear with representative controls before each task.
The PFD symbology was similar to that on a Boeing 777 (Fig. 8). Speed and heading bugs indicated the desired speed and heading for each task. In addition, typical symbology on the speed tape indicated the minimum and maximum speeds, and V-speeds. The PFD also depicted conventional localiser and glideslope error indicators. A green speed trend vector originating from the indicated airspeed showed what the airspeed would be in 10 s. The control columns in the cockpit had stick shakers to warn pilots of an impending stall. The activation of the shakers occurred simultaneously when the minimum speed tape, also known as the “barber pole,” coincided with the indicated airspeed.
Primary flight display.

The collimated out-the-window display of T-CAB consisted of a projection system projecting a high-quality image on six spherical mirrors. The mirrors formed a dome-like section providing a continuous field-of-view image to both pilots. The out-the-window visual had a 220° horizontal field of view and a 28° vertical field of view (10° up and 18° down). A Rockwell-Collins EPX5000 computer image generator created the out-the-window visual scene. The visual system equivalent time delay was 62 ms(Reference Beard, Reardon, Tobias and Aponso18). This was in line with the equivalent time delays of the motion system (Section 3).
4.1.3 Procedures
The pilot pre-briefing explained the purpose of the experiment, the procedures, conditions and performance criteria for each flight task. Pilots were informed they would perform each task with four different motion configurations and that the configurations would be presented randomly. However, no specifics about the motion configurations were given.
Pilots performed all three tasks, each with the four different motion configurations. Each motion configuration was repeated eight times for a total of 32 runs per task. The motion configurations were presented randomly. The first 12 runs were used as training runs in which the four motion conditions were presented three times each. The remaining 20 runs were used for data analysis. A randomised Latin square determined the order of the tasks and motion configurations. All runs for a particular task were performed in a single session. Each task session lasted 1.5-2 hours, and breaks were taken in between sessions.
Before each task, the instructor pilot reviewed the procedures, performance criteria, the relevant controls and the displays. The instructor evaluated a pilot’s performance after each run using task performance information displayed in the cab. An experiment observer in the control room verified the evaluation. After completing each run, participant pilots rated the motion with two different rating scales (Section 4.1.5).
4.1.4 Participants
Twelve experienced airline transport pilots participated. Each had a B757/B767 type rating, as the aircraft model used in the simulation was of an aircraft similar to a B757 in terms of configuration, size and weight. All pilots had experience on many other aircraft types. The average number of flying hours pilots had on a B757/B767 was 4,503 hours, with a standard deviation of ± 4,463. The average number of flying hours on other aircraft types was 8,579 with a standard deviation of ± 4,458. All pilots were male and eight were captains.
4.1.5 Dependent measures
Two subjective dependent measures and 11 objective dependent measures were recorded and analysed. Pilots rated the simulator motion in each run with two different ratings in all three tasks. For the first rating, pilots assigned a specific fidelity level out of three levels on a Motion Fidelity Scale (MFS)(Reference Sinacori4,Reference Schroeder5) :
-
1. High (H): motion sensations like those of flight.
-
2. Medium (M): motion sensations are noticeably different from flight, but not objectionable.
-
3. Low (L): motion sensations are noticeably different from flight and objectionable.
For the second rating, pilots answered the following question: “How would you rate motion fidelity for this condition with respect to what you would expect from the visual motion?” by drawing a vertical marker on an Analogue Fidelity Scale (AFS). The analogue scale ranged from 0% (low fidelity) to 100% (high fidelity).
Several objective measures determined the effect of motion on task performance. Many measures related directly to the performance criteria (Fig. 1). For the approach and landing with sidestep, the RMS of the glideslope, RMSgs
, and speed deviation during the approach, RMSV
, were calculated. Calculations for these variables used data from the last 60 s before reaching the decision altitude of 200 ft. When the main gear touched the runway, data captures occurred for the sink rate,
 $\dot{h}_{td}$
, and the longitudinal and lateral deviations, Δxtd
and Δytd
, from the desired touchdown point.
For the stall recovery, the RMS roll error, RMS ϕ, applied to the 30 s before the start of the stall recovery. The maximum pitch rate deviation, qmax , and the number of stick shakers, Ns , applied to the stall recovery segment. Pitch rate was substituted as a partial surrogate to analyse load factor oscillations in the stall recovery, as it was more suitable for analysing oscillatory behaviour. Finally, for the engine out on take-off task, the RMS of the heading and speed deviations after the engine failure, RMS ψ and RMSV , used data from the last 15 s after the engine failure. The reaction time of the initial pedal input after the engine failure, tp , was from the time of the engine failure to the time when the pedal input was 10% of the maximum input.
4.2 Hypotheses
The null hypothesis was assumed. Consistent with this hypothesis, the three hexapod motion configurations were designed to deliberatively trade off gain and naturally frequency while trying to stay within the same fidelity region as predicted by the Sinacori criteria for each degree of freedom. The large motion configuration used as much of the VMS motion space as possible, generally leading to a higher predicted motion fidelity than the hexapod conditions. This higher-fidelity condition was included as a quasi-truth case to lessen the tendency to subjectively exaggerate differences between hexapod conditions if they are small.
5.0 RESULTS
This section presents the mean results of the 12 pilots for the approach and landing with sidestep and engine out on take-off tasks. The mean results of 11 pilots are presented for the high-altitude stall recovery task, as one pilot did not complete this task due to technical difficulties. For every pilot, data from the last five runs for each task and motion configuration were averaged. Error-bar plots present the continuous-interval dependent measures, with means and 95% confidence intervals for each motion condition. Bar plots present the ordinal dependent measures, with the number of occurrences for each dependent measure level and the median for each motion condition. Wherever appropriate, grey dashed lines depict the task performance criteria.
A repeated-measures Analysis of Variance (ANOVA) detected possible statistically significant differences in the continuous interval dependent measures(Reference Field20). A Friedman test was used for the ordinal dependent measures. For the ANOVA to produce accurate results, the data must meet three assumptions: (1) there should be no significant outliers, (2) data should be approximately normally distributed for each level of the independent variable and (3) variances of the differences between all combinations of levels of the independent variable must be equal (i.e., assumption of sphericity).
Box plots identified outliers, normality was checked using the Shapiro-Wilk test, and Mauchly’s test checked the assumption of sphericity. Few outliers were detected, so they were kept in the data analysis. Data were generally normally distributed. In the few cases they were not, we did not correct for it, as an ANOVA is fairly robust to deviations from normality. When the assumption of sphericity was violated, the degrees of freedom of the ANOVA were corrected using the Greenhouse-Geisser adjustment.
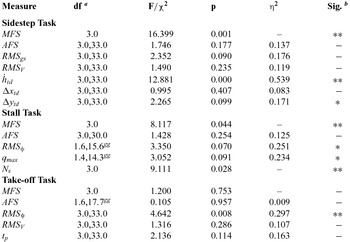
Post-hoc tests with Bonferroni adjustment were performed for pairwise comparisons of motion conditions when the ANOVA indicated an overall significant difference. All statistical tests had a significance level of 0.05. Table 2 gives a summary of the statistical test results for all the repeated measures (Section 4.1.5). In this table, df are the degrees of freedom, F or χ2 is the test statistic for the ANOVA or Friedman test, respectively, p is the probability of observing an effect, and η2 is the partial eta-squared, indicating sample effect size. Next, details of the motion fidelity rating results are presented, followed by the task performance results.
Summary of statistical test results

(a) gg = Greenhouse-Geisser sphericity correction
(b) ** = significant (p < 0.05)
* = marginally significant (0.05 ≤ p < 0.1)
– = not significant (p ≥ 0.1)
5.1 Motion fidelity ratings
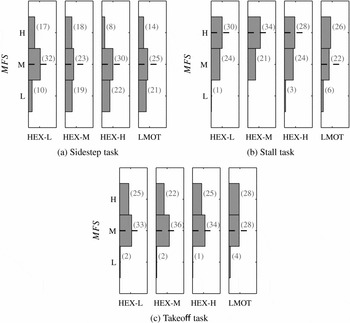
Figure 9 shows the MFS ratings. The bars indicate the number of times pilots gave a certain rating. Note that 60 ratings (12 pilots × 5 runs) should be given for each motion condition in the sidestep and take-off tasks, and 55 ratings (11 pilots × 5 runs) for each motion condition in the stall task. However, HEX-L for the sidestep task and LMOT for the stall task contain only 59 and 54 ratings, respectively, as two pilots forgot to rate one run in each condition. For the approach and landing with sidestep task, the MFS ratings were significantly different between the different motion conditions, as indicated by the Friedman test. The post-hoc analysis revealed a marginal difference between the ratings for HEX-L and HEX-H (p = 0.083). More lower ratings were given for HEX-H compared to HEX-L (Fig. 9(a)).
Pilot motion fidelity scale ratings.

Statistically significant differences were found in MFS ratings between motion conditions for the high-altitude stall recovery task. Pairwise comparisons did not reveal significant differences between specific motion condition pairs. However, Fig. 9(b) shows that more low fidelity ratings were given for the HEX-H and LMOT motion configurations. No significant differences were found in MFS ratings between motion conditions for the engine out on take-off task (Fig. 9(c)). Comparing the different tasks, pilots generally provided higher MFS ratings for the high-altitude stall task and engine out on take-off task.
Figure 10 depicts the AFS rating results for each task. No statistically significant differences were found in AFS ratings between motion conditions for any of the tasks. However, it can be observed that ratings for the stall and take-off tasks are higher (around 80%) compared to the sidestep task (around 60%). This is consistent with the MFS ratings.
Pilot analogue motion fidelity scale ratings.

5.2 Task performance results
5.2.1 Approach and landing with sidestep
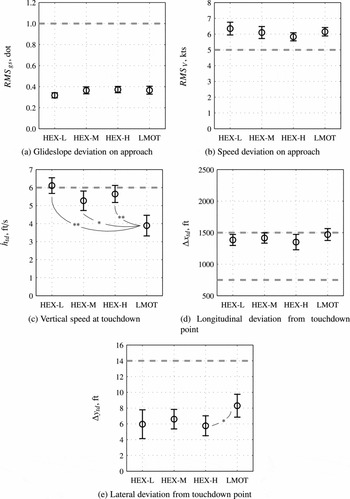
Figure 11 provides the task performance results for the approach and landing with sidestep task. Figures 11(a) and (b) depict the RMS of the glideslope and speed deviation in the approach, respectively. No statistically significant differences between motion conditions were found for both variables. Note that pilots were able to meet the glideslope-deviation performance requirement easily, as they deviated around 0.2 dots from the glideslope on average. However, the average airspeed deviation was above 5 Kn, indicating that pilots had difficulties meeting the speed-deviation performance requirement. This was mainly caused by the significant airspeed perturbations introduced by the atmospheric turbulence.
Performance data of the approach and landing with sidestep task.

The repeated-measures ANOVA revealed that the sink rate at touchdown was significantly different between motion conditions. A post-hoc analysis with Bonferroni adjustment revealed that
 $\dot{h}_{td}$
in the LMOT condition was significantly different from
 $\dot{h}_{td}$
in the HEX-L (p < 0.001) and HEX-H (p = 0.009) motion conditions, and marginally different from
 $\dot{h}_{td}$
in the HEX-M condition (p = 0.052). No effect of sink rate at touchdown was found between the hexapod motion conditions. The average sink rate at touchdown in LMOT was well below the maximum desired value of 6 ft/s; however, the average value in the hexapod motion conditions was around the maximum desired value.
The longitudinal deviation from the desired touchdown point was not significantly different between motion conditions. Pilots generally touched down long, close to the maximum allowable 1,500 ft from the runway threshold. The ANOVA found that the lateral deviation from the desired touchdown point was marginally different between motion conditions. Post-hoc analysis found that Δytd was marginally different between the HEX-H and LMOT motion conditions only (p = 0.080).
5.2.2 High-altitude stall recovery
Figure 12 presents the task performance results for the high-altitude stall recovery task. Figure 12(a) depicts the RMS roll deviation during the approach to stall. The RMS roll deviation was marginally different between the motion conditions. Post-hoc analysis with Bonferroni adjustment revealed that the RMS roll deviation was significantly different between HEX-H and LMOT (p = 0.029). The RMS roll deviation was not significantly different between the hexapod motion configurations. Note that pilots met the roll deviation performance requirement without difficulty.
Performance data of the high altitude stall recovery task.

Figure 12(b) depicts the maximum pitch rate deviation during the stall recovery. Overall, this variable was marginally different among motion configurations. Post-hoc analysis found a marginal difference between HEX-L and HEX-M (p = 0.097) and a significant difference between HEX-M and HEX-H (p = 0.008). No significant differences were found between other motion condition pairs.
The bars in Fig. 12(c) indicate the number of times a pilot activated 0, 1 or 2 additional stick shakers during the stall recovery. A Friedman test revealed that the number of additional stick shakers during the stall recovery was significantly different between motion conditions. Post-hoc analysis did not reveal significant differences between specific motion condition pairs. However, Fig. 12(c) indicates that LMOT is the only motion configuration where none of the pilots activated additional stick shakers, while in the hexapod motion conditions, at least one additional shaker was triggered seven or eight times.
5.2.3 Engine out on take-off
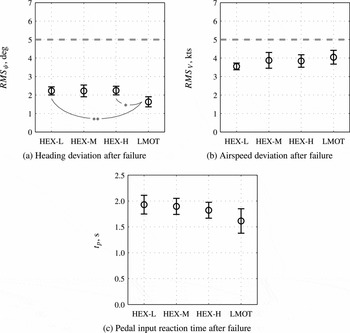
Figure 13 provides the task performance results for the engine out on take-off. The RMS heading deviation after the engine failure was significantly different between the motion configurations (Fig. 13(a)). Post-hoc analysis with Bonferroni adjustment revealed a significant difference between HEX-L and LMOT (p = 0.019), and a marginal difference between HEX-H and LMOT (p = 0.073). No statistical differences were found between other motion condition pairs.
Performance data of the engine out on take-off task.

The RMS speed deviation after the engine failure is depicted in Fig. 13(b). The ANOVA did not detect a statistically significant difference between motion conditions. Note that pilots were able to meet the heading and airspeed performance criteria with ease. Figure 13(c) depicts the reaction time of the initial pedal input after the engine failure. This measure was not significantly different between motion conditions.
6.0 DISCUSSION
6.1 Effects of motion on task performance
Our previous quasi-transfer-of-training study evaluated whether different levels of training motion fidelity affect the initial training of commercial transport pilots(Reference Zaal, Schroeder and Chung16). The study found only a limited number of significant effects of training motion, with some in the direction not predicted. We hypothesised that this was mainly caused by the fact that the group of general aviation pilots who participated in the experiment had no prior experience with the aircraft type used. This made it difficult for pilots to meet all task performance criteria. Furthermore, the experiment had a between-subjects design with pilots training for each task with only a single motion configuration, reducing the statistical power to detect differences between configurations.
The experiment described here used three of the four tasks of the previous experiment with minor modifications. However, this time, we used experienced commercial airline transport pilots, representing pilots receiving recurrent training, in a within-subjects experiment in which pilots performed each task with all motion configurations. Contrary to the first experiment, these pilots met virtually all performance criteria for each run. More significant differences between motion configurations were found here compared to the previous experiment, and the effects found were more in line with what was expected, based on previous research investigating the effects simulator motion on pilot control behaviour and performance.
Pilots used two different motion fidelity ratings for subjective evaluation of the simulator motion after each run. One compared the simulator motion to real flight (MFS ratings) and the other to visual motion in the out-the-window view (AFS ratings). A large spread in motion ratings was found for each task, a common issue with subjective ratings. Despite the different nature of the two ratings, they produced similar results overall. For the sidestep task, the MFS ratings showed the largest variation in fidelity ratings, and pilots gave more lower ratings across all conditions compared to the other tasks. This result was also found for the AFS ratings. Pilots tended to rate motion fidelity lower in the high-gain motion conditions (HEX-H and LMOT). This effect was significant in the MFS ratings and most likely caused by the more abrupt changes in simulator accelerations in these conditions due to atmospheric turbulence. A similar significant effect in MFS ratings was found in the stall task, which was the only other task where atmospheric turbulence was present. A plausible reason for the overall lower ratings in the sidestep task is that false tilt motion cues due to rolling were increasingly apparent closer to the ground, as increasingly larger roll motions were induced at lower altitudes due to the increase in atmospheric turbulence intensity.
In the sidestep landing task, the main objective measure affected by the motion condition was the sink rate at touchdown. Pilots touched down with a significantly lower sink rate in the LMOT compared to the hexapod motion conditions (HEX-L, HEX-M, HEX-H). This effect has been observed in previous research(Reference Bray13). Pilots generally touched down long in all motion configurations due to the strong ground effect of the simulated aircraft. The lateral deviation from the desired touchdown point was marginally greater in the LMOT condition compared to HEX-H. This was most likely also an effect of the more pronounced false tilt motion cues due to rolling deliberately designed into the LMOT condition. The false tilt cues introduced a motion sensation similar to a lateral wind gust, causing pilots to use large rudder inputs just before touchdown.
Roll deviation RMS during the approach to the stall was significantly affected by the motion condition in the stall recovery task. Pilots deviated significantly less from the desired roll angle of 20° in LMOT compared to HEX-H. This is an effect generally observed in compensatory control tasks when the fidelity of motion feedback is increased(Reference Jex and Magdaleno10). The maximum pitch rate during the recovery from the stall was significantly lower in HEX-M compared to HEX-L and HEX-H. This result does not seem to be consistent with changes in the motion configurations. Finally, motion introduced a significant difference in the number of additional stick shakers during the stall recovery. No specific differences were found between motion configurations; however, in the large motion condition, no additional shakers were triggered by any of the pilots, compared to seven to eight additional shakers in the hexapod motion conditions. This is in line with our previous experiment(Reference Zaal, Schroeder and Chung16). Pilots may have been able to use the higher-fidelity pitch motion in LMOT to provide lead compensation in pitch, thereby resulting in less angle-of-attack oscillations during the recovery and, in turn, less stick shaker activations.
For the take-off task, only the heading deviation RMS was significantly affected by the motion condition. The deviation from the desired heading after the engine failure was significantly lower in LMOT compared to HEX-L and HEX-H. In the large motion condition, pilots were able to stabilise the heading after the engine failure more effectively using the higher-fidelity yaw and lateral motion cues.
In summary, we found significant effects of motion on task performance for all of the flight tasks. Contrary to the first experiment, higher motion fidelity as predicted by the Sinacori diagram or OMCT criteria always helped pilots in performing the task. Overall, the biggest differences in performance were between the large motion condition and the high-gain/high-break-frequency hexapod motion condition. Performance in the three hexapod motion configurations was similar. Note that, for the motion tuning strategy we adopted in this experiment, this result was predicted by the Sinacori criteria; that is, all hexapod motion conditions had the same predicted fidelity and the large motion condition had a higher predicted fidelity (Fig. 4). Finally, note that better task performance did not result in higher motion fidelity ratings. This suggests that objective measures, such as task performance, are more appropriate to assess simulator motion fidelity than subjective motion ratings.
6.2 Objective motion cueing criteria
Based on results to date, interim OMCT motion fidelity boundaries are proposed here. More data are needed to draw precise boundaries, so the interim fidelity boundaries should be considered a work in progress. The approach to developing them was twofold. First, statistically significant results from this experiment, if found and applicable to a particular degree of freedom, defined the boundaries. Second, if such results were not found or applicable, then information from the literature defined the boundaries. Specifically, the boundary between low and medium fidelity from the Sinacori criteria was used(Reference Sinacori4,Reference Schroeder5) , as those criteria are in broad agreement with the results of many other motion studies(Reference Schroeder and Grant21).
Motion fidelity boundaries were defined by first assigning a task performance result to each degree of freedom. Then, using significant differences in task performance between different motion configurations, fidelity boundaries were defined using the OMCT responses of those motion configurations. The HEX-L and LMOT motion configurations mainly differed in motion filter gain; that is, the motion filter break frequency between the two conditions was similar (Fig. 4). Hence, HEX-L was used to suggest fidelity boundaries for magnitude only. On the other hand, HEX-H and LMOT mainly differed in motion filter break frequency. Therefore, HEX-H was used to suggest boundaries for phase only. HEX-M was used in both magnitude and phase plots when significant differences arose in the objective measures.
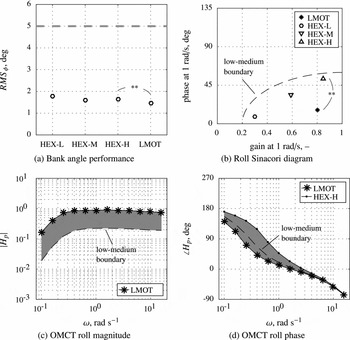
As an example for applying this experiment’s results, Fig. 14 shows how the roll fidelity boundaries were developed using the following steps:
-
(1) Roll deviation RMS in the stall task was used to develop roll OMCT fidelity boundaries. As indicated in Fig. 14(a), roll deviation RMS was significantly different between HEX-H and LMOT only. Therefore, we assume that a fidelity boundary exists between the OMCT responses of those motion configurations.
-
(2) The roll Sinacori diagram is depicted in Fig. 14(b), showing the gain/break-frequency trade-off between the hexapod motion configurations. Again, the only significant difference was found between HEX-H and LMOT, which mainly differed in motion filter phase.
-
(3) As HEX-H was designed to keep a hexapod to stay within its leg limits by accepting phase errors while retaining a high gain similar to LMOT, task performance differences between HEX-H and LMOT should not then be used to specify gain boundaries. Instead, the Sinacori low-to-medium boundary and the LMOT configuration set the roll gain fidelity boundary (Fig. 14(c)). The difference between the HEX-H and LMOT configurations set the roll phase fidelity boundary (Fig. 14(d)).
Development of the OMCT roll fidelity boundaries.

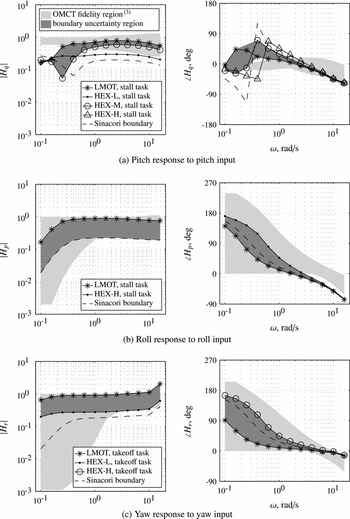
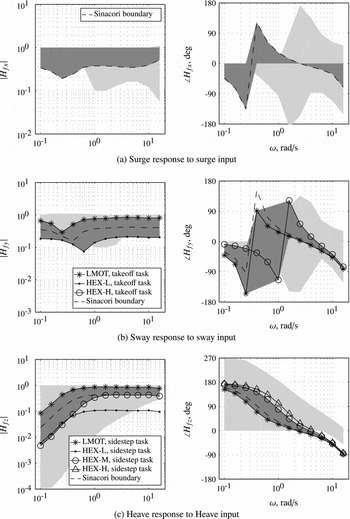
Figures 15 and 16 present fidelity boundaries based on the approach discussed above for primary responses in the six degrees of freedom. The Sinacori low-to-medium boundary is shown on all plots, but was used as a fidelity boundary only when no differences were found among our motion configurations, or when those differences were meaningful in drawing only gain or only phase fidelity boundaries. The figure also depicts the OMCT fidelity regions based on the statistical sampling of eight simulators for reference(Reference Hosman and Advani3).
Initial objective motion cueing fidelity boundaries for the rotational degrees of freedom.

Initial objective motion cueing fidelity boundaries for the translational degrees of freedom.

For the pitch OMCT fidelity boundary, significant differences in the number of additional stick shaker activations in the stall recovery (Fig. 12(c)) have been used. Significant differences in roll deviation RMS (Fig. 12(a)) defined the fidelity boundaries for the roll response. Significant differences in heading deviation RMS in the take-off task (Fig. 13(a)) were used for both the sway and yaw OMCT fidelity boundaries. For the heave OMCT fidelity boundary, significant differences in sink rate at touchdown (Fig. 11(c)) were used to define the task-performance fidelity boundary. No experimental differences were found for defining the surge OMCT fidelity boundary. Instead, the Sinacori low-to-medium boundary and the one-to-one motion boundary defined the surge OMCT fidelity boundary. The responses defining the cross coupling between translational and rotational degrees of freedom have been omitted for brevity.
Note, again, that the dark-grey areas in Figs 15 and 16 are believed to contain a motion fidelity boundary, but are not fidelity regions themselves like the light-grey fidelity regions developed by Hosman. The dark-grey areas are the regions of uncertainty for one side of a motion fidelity region. The other side of the region would be defined by the magnitude-of-one or zero-phase-error lines. Results from this experiment allow us to draw relatively wide fidelity boundaries only. Future experiments will refine these fidelity boundaries; that is, they will reduce the width of the dark-grey areas.
7.0 CONCLUSIONS
This study used the VMS with three flight tasks and four different motion configurations per task for an initial investigation into objective motion cueing criteria based on task performance. Three motion configurations were tuned to fit a hexapod motion platform, and the fourth was tuned to the large motion space of the VMS. Twelve experienced airline transport pilots participated, performing each task with all four motion configurations.
Both subjective and objective experimental measures were affected by the motion condition. For the subjective measures, pilots rated motion fidelity lower in the high-gain motion configurations in the tasks with atmospheric turbulence. The task performance results indicate that pilots touched down on the runway softer in the large motion condition compared to the hexapod motion conditions, and had a higher lateral deviation from the centreline in the large motion configuration compared to the high-gain hexapod configuration. Pilots deviated less from the desired roll angle in the stall task in the large motion condition compared the high-gain hexapod condition. In the stall recovery, pilots had a lower maximum pitch rate in the medium-gain hexapod motion condition compared to the low- and high-gain hexapod conditions. Pilots had fewer stall warnings when recovering from the stall with the large motion configuration compared to the hexapod configurations. Finally, pilots deviated less from the desired heading after an engine failure in the large motion condition compared to the low and high-gain hexapod conditions.
The statistically significant differences found between the motion conditions helped suggest initial objective motion cueing fidelity boundaries. In cases where differences were not found, results from the literature suggested the initial boundaries. Future experiments now underway will refine these boundaries further.
ACKNOWLEDGEMENTS
The authors thank the VMS simulation engineers who contributed to the experiment. We especially thank Emily Lewis and Nick Riccobono for their valuable contributions in setting up and running the experiment. We also thank Gordon Hardy for being our test pilot and instructor pilot. Finally, we would like to thank Dr. Andrew Cheng from the FAA Technical Center for the continued program support.
APPENDIX
A.0 MOTION LOGIC CHARACTERISTICS
This appendix provides some details about the VMS motion logic and parameter values for each motion configuration. A more general overview of the motion logic and motion system are given in the work of Beard et al(Reference Beard, Reardon, Tobias and Aponso18).
The VMS motion logic is completely linear in its operating envelope; that is, the only non-linear element is the motion limiting near the edges of the envelope. The motion configurations of the experiment were tuned such that motion limits were never reached.
Motion filtering is performed in the inertial reference frame. Aircraft model accelerations are transformed from the aircraft body reference frame to the inertial reference frame using small-angle approximations. The logic uses gains and second-order high-pass washout filters to attenuate accelerations in the translational and rotational degrees of freedom. The washout filter for the lateral degree of freedom y is given by:
 $$\begin{equation}
H_{my} = K_y\frac{s^2}{s^2+2\zeta _{y}\omega _{y}s+\omega ^2_{y}},
\end{equation}$$
Tilt coordination in the VMS motion logic is provided by third-order low-pass filters. These filters tilt the simulator cab to provide steady-state longitudinal and lateral accelerations at low frequencies. Tilt coordination in the lateral degree of freedom is provided by:
 $$\begin{equation}
H_{ty} = K_y \frac{K_{tp}}{g}\ \frac{\omega ^2_{tp}}{s^2+2\omega _{tp}s+\omega ^2_{tp}}\ \frac{2\zeta _{t1}\omega _ys+\omega ^2_y}{s^2+2\zeta _{t2}\omega _{y}s+\omega ^2_{y}}
\end{equation}$$
Tilt coordination in the longitudinal degree of freedom is given by:
 $$\begin{equation}
H_{tx} = K_x \frac{K_{tq}}{g}\ \frac{\omega ^2_{tq}}{s^2+2\omega _{tq}s+\omega ^2_{tq}}\ \frac{\omega _{tq}}{s+\omega _{tq}}
\end{equation}$$
In Equations (2) and (3), Ktp and Ktq are the tilt-coordination gains, g is the gravitational acceleration, ω tp and ω tq the tilt-coordination break frequencies, and ζ t1 and ζ t2 are damping ratios. The motion logic also includes a turn-coordination channel that takes advantage of the large lateral motion capability of the VMS. This channel induces additional lateral accelerations using roll rate to reduce false tilt cues. The turn-coordination channel was switched off for the current experiment.
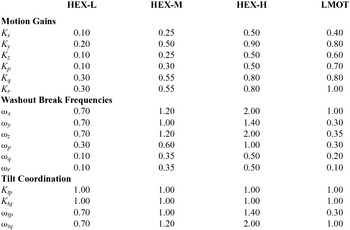
Tables A.1–A.3 provide the motion gains and washout break frequencies of all motion configurations for the sidestep, stall and take-off tasks, respectively. All damping ratios were set to 0.707. Note that the tilt-coordination gains were set to 1.00 for each motion configuration. This means the specific-force responses at low frequencies due to tilt coordination had the same magnitude as the specific-force responses at high frequencies due to the high-pass washout. Also note that the tilt-coordination break frequencies were set to the same values as the corresponding high-pass washout-filter break frequencies.
Motion parameters for the sidestep task

Motion parameters for the stall task

Motion parameters for the take-off task