


INTRODUCTION
Molecular data continue to enhance our understanding of the evolutionary history of life at all hierarchical levels. Nevertheless, many questions about cnidarian phylogenetic relationships remain unanswered (Daly et al., Reference Daly, Brugler, Cartwright, Collins, Dawson, Fautin, France, McFadden, Opresko, Rodrigues, Romano and Stake2007). To address these questions, and thereby provide a robust phylogenetic framework for addressing biological questions involving cnidarians, is the primary aim of the Cnidarian Tree of Life project (http://cnidarian.info). To achieve this goal, this large, collaborative effort is compiling molecular data from both nuclear and mitochondrial markers from as many cnidarian species as possible. This paper summarizes progress in understanding the phylogeny of Trachylina and provides greater insight into the evolution of several problematical cnidarians.
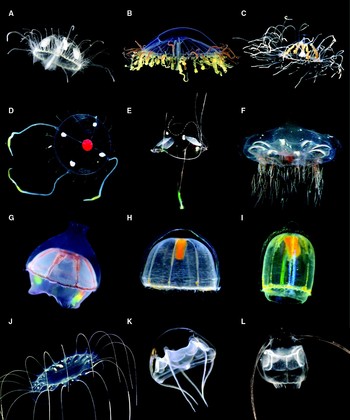
Within Hydrozoa (Cnidaria), an ancient phylogenetic divergence appears to have given rise to two primary clades with extant representatives, Trachylina and Hydroidolina (Collins, Reference Collins2002; Collins et al., Reference Collins, Schuchert, Marques, Jankowski, Medina and Schierwater2006a). In terms of species richness, the vast majority of hydrozoan diversity is contained within Hydroidolina (=Leptolina sensu Schuchert, Reference Schuchert2007). Trachylina encompasses roughly 150 valid species, whereas Hydroidolina contains more than 3000 (Schuchert, Reference Schuchert1998). Nevertheless, because of lack of study and generally simple and plastic morphology, the true species richness of Trachylina remains obscure, and significant levels of crypsis are possible. Interestingly, the numbers of higher taxa classified within Trachylina and Hydroidolina are comparable. Limnomedusae, Narcomedusae, Trachymedusae and Actinulida (though it has not been sampled for molecular data until this study) are the main taxa, usually ranked as orders, within Trachylina (Figures 1–3). Hydroidolina (see Cartwright et al., this volume) contains three relatively diverse clades, Anthoathecata (athecate hydroids and anthomedusae), Leptothecata (thecate hydroids and leptomedusae) and Siphonophora.
Images of representative trachyline species. Note that the specimens depicted are not the ones DNA samples were obtained from. (A–C) Limnomedusae; (D–I) Trachymedusae; (J –L) Narcomedusae. (A) Craspedacusta sp.; (B) Olindias sambaquiensis; (C) Gonionemus vertens; (D) Tetrorchis erythrogaster; (E) Liriope tetraphylla; (F) Halicreas minimum; (G) Botrynema brucei; (H) Pantachogon ‘white-red’; (I) Pantachogon ‘orange’; (J) Solmissus incisa; (K) Aegina rosea; (L) Solmundella bitentaculata. A, B and E from A.E. Migotto (Centro de Biologia Marinha, Universidade de São Paulo); C from P. Schuchert (Muséum d'Histoire Naturelle de la Ville de Genève); D and L from S.H.D. Haddock (images captured in California); F–K from D. Lindsay (images captured in Japan).
(A) Polyp of Craspedacusta sowerbii; (B) polyp of Astrohydra japonica; (C) Microhydrula limopsicula modified from Jarms & Tiemann (Reference Jarms and Tiemann1996); left: cauliflower shaped polyp; right: polyps closely attached to their bivalve host.

Still image taken from a video of Halammohydra sp. by J. Norenburg.

The diversity of life history and morphological features across Trachylina makes the group particularly interesting from an evolutionary perspective. For instance, the trachyline species that perhaps first come to mind are the oceanic, holopelagic members of Trachymedusae and Narcomedusae, which usually develop directly from planula to adult. Even within these groups there are exceptions, e.g. the bentho-pelagic trachymedusans of the family Ptychogastriidae, narcomedusans with secondarily derived polypoid, parasitic life stages (Bouillon, Reference Bouillon1987; Collins, Reference Collins2002), and the highly unusual worm-shaped narcomedusan Tetraplatia (Hand, Reference Hand1955; Collins et al., Reference Collins, Bentlage, Matsumoto, Haddock, Osborn and Schierwater2006b) that bears four sets of swimming flaps. The only species of Trachylina that possess a true polyp stage are those classified within Limnomedusae. Limnopolyps are generally tiny (less than 1 mm in length) and simple, laterally bud medusae like those of the hydroidolinan groups, and usually produce frustrules, creeping asexual larvae that disperse and metamorphose into additional polyps. Because the medusa stages of limnomedusans are very similar in morphology to those of Trachymedusae, the presence of a polyp stage is critical to differentiating the two taxa. Limnomedusae is also of note because several species live in fresh water, a relatively unusual habit for cnidarians (Jankowski et al., Reference Jankowski, Collins and Campbell2008).
Perhaps the most unusual trachyline species are those of Actinulida. These minute tentacled, ciliated and solitary forms spend their lives creeping between sand grains. Actinulidans, which develop directly from planulae to adults, were hypothesized to be living remnants of interstitial ancestral hydrozoans (Swedmark & Tessier, Reference Swedmark, Teissier and Rees1966). In contrast, however, their possession of ecto-endodermal statocysts, and sometimes brood chambers have led most researchers in recent decades to conclude that they are more likely derived medusae that have been highly modified for their interstitial existence (e.g. Werner, Reference Werner1965; Salvini-Plawen, Reference Salvini-Plawen1987; Bouillon & Boero, Reference Bouillon and Boero2000; Marques & Collins, Reference Marques and Collins2004). However, their simple and derived morphology has prevented any definitive conclusions about their precise phylogenetic position within Trachylina, hindering our understanding of how these interesting species evolved.
A key step in understanding the evolution of trachyline diversity is the development of a robust hypothesis of phylogenetic relationships within and between the various trachyline taxa. By sampling numerous new species (including a member of Actinulida), for sequences of mitochondrial and nuclear markers, this study continues the effort to unravel the phylogeny of Trachylina, thereby providing insight into the evolutionary patterns underlying the diversity of trachyline life cycles and life history strategies.
MATERIALS AND METHODS
Sampling
Specimens included in this study have come from a diversity of sources (Table 1). Tissue samples were preserved in pure ethanol or frozen in liquid nitrogen and stored at −80°C. DNA was extracted using either commercially available extraction kits (DNAzol, Molecular Research Center, Inc.; Invisorb Spin Tissue kit, Invitek) or phenol/chloroform. For the latter, a small amount of tissue was incubated at 55°C for several hours or overnight in 500 µl lysis buffer (10 mM Tris–HCl [pH 8.0], 1 mM EDTA), 25 µl SDS (20%) and 12.5 µl of Proteinase-K (20 mg/ml). An equal volume of equilibrated phenol/chloroform (1:1) was then added to the homogenate. The reaction tube was subsequently inverted several times to allow mixing of the solution followed by 5 min of centrifugation at maximum speed. The upper, aqueous layer was then transferred into a new reaction tube. Optionally, 200 µl of TE (10 mM Tris–HCl [pH 7.4], 1 mM EDTA [pH 8]) were added to the leftover layer of phenol/chloroform also followed by mixing and centrifugation in order to increase the overall yield of the extraction (‘back-extraction’ of the residual aqueous phase). An additional washing step with chloroform was then performed by adding solely chloroform to the recovered aqueous phases followed by mixing and centrifugation for five minutes. The aqueous phases of initial and ‘back-extraction’ were pooled and the dissolved DNA was precipitated with ethanol (e.g. Mühlhardt, Reference Mühlhardt2003 for a protocol), and the resulting pellet was eluted in 15–30 µl of TE.
Samples with GenBank accession and voucher numbers when available; *, derived for this study.

USNM, National Museum for Natural History, Smithsonian Institution; KUMIP, University of Kansas Natural History Museum, Division of Invertebrate Paleontology; MHNG INVE, Muséum d'Histoire Naturelle de la Ville de Genève.
Genes coding for the large subunit of the mitochondrial ribosome (16S) and the nuclear genes coding for both the small (18S or SSU) and large (28S or LSU) ribosomal subunits were amplified and sequenced as described below. All PCR reactions contained 50 vol% Taq PCR Master Mix (Qiagen, Valencia, California) and 0.5 µM of each respective primer. A region of mitochondrial 16S (approximately 640 bp) was amplified and sequenced with the primers F2 and R2 (Cunningham & Buss, Reference Cunningham and Buss1993), using a modified PCR profile (94°C/5 min; (94°C/50 s, 45°C/50 s, 72°C/60 s) × 5; (94°C/50 s, 50°C/50 s, 72°C/60 s) × 30; 72°C/5 min). Near complete SSU (approximately 1800 bp) was amplified and sequenced according to Medlin et al. (Reference Medlin, Elwood, Stickel and Sogin1988). The original PCR profile was modified to 94°C/4 min; (94°C/20 s, 57°C/20 s, 72°C/1 min 45 s) × 35; 72°C/7 min. Nearly complete LSU (approximately 3200 bp) was amplified in two parts using the primers F63mod (Medina et al., Reference Medina, Collins, Silberman and Sogin2001) and R2084 (5′-AGA GCC AAT CCT TTT CC-3′) in one PCR reaction and the primers F1383 (5′-GGA CGG TGG CCA TGG AAG T-3′) and R3238 (5′-SWA CAG ATG GTA GCT TCG-3′) in a second reaction. The temperature profile of each PCR was the following: 94°C/5 min; (94°C/30 s, 45°C/60 s, 72°C/3 min) × 30; 72°C/10 min (modified from Medina et al., Reference Medina, Collins, Silberman and Sogin2001). The LSU sequences were obtained with the previously published primers F63sq, F635, R635, R1411sq, R1630, F2076sq, F2766 (all from Medina et al., Reference Medina, Collins, Silberman and Sogin2001), R2800 (Voigt et al., Reference Voigt, Collins, Pearse, Hadrys and Schierwater2004) and the newly developed primers F1383, F1689 (5′-CTA AGM SRY AGG GAA AYT C-3′), R2084 and R3238. Purification of PCR products and sequencing were carried out at the laboratories of Cogenics (Houston, Texas). Sequences and collection data for the source specimens have been deposited to GenBank (see Table 1).
Datasets
In order to investigate different phylogenetic questions, assess levels of correspondence among the different phylogenetic markers, and derive the most robust phylogenetic hypothesis of Trachylina possible, we created five datasets. First, partial mitochondrial 16S, nuclear SSU, and nuclear LSU data for all taxa (Table 1) were aligned using MUSCLE (multiple sequence alignment with high accuracy and high throughput) (Edgar, Reference Edgar2004). No adjustments were made by eye. ‘Conserved’ positions for each of the alignments were identified using Gblocks v0.91 (Castresana, Reference Castresana2000) with default parameters, except that half the taxa were allowed to be gaps for any given position. Positions deemed non-conserved by Gblocks were excluded from phylogenetic analysis.
The first dataset analysed was constructed in order to conduct initial investigations of the phylogenetic placement of the actinulidan Halammohydra sp., which had been hypothesized by some authors to represent an anciently diverging lineage of Hydrozoa (Swedmark & Tessier, Reference Swedmark, Teissier and Rees1966). Therefore, for this dataset, we combined both SSU and LSU data (for the regions over which we were able to derive data from Halammohydra, 1298 and 1032 nucleotides, respectively) from a diverse set of trachylines, seven representatives of Hydroidolina, and six non-hydrozoan representatives of Medusozoa, used as outgroups (see Figure 4). Non-hydrozoans were not included in any of the other datasets, which were constructed to conduct more detailed analyses of Trachylina phylogeny and to investigate the degree of correspondence between the different markers. The second through fourth datasets consisted of all available trachyline sequences for mitochondrial 16S, SSU, and LSU markers (Table 1), along with seven species representing the breadth of hydroidolinan (non-trachyline hydrozoan) diversity for outgroups (Figures 5–7).
Phylogenetic hypothesis with non-hydrozoan medusozoan outgroups to investigate the position of Halammohydra sp. within Hydrozoa. Note also the position of Microhydrula limopsicola. Phylogram of ML topology based on combined SSU and LSU data (dataset 1) with bootstrap indices under both ML and MP at each node. ‘ < ’ indicates a bootstrap index of less than 61; a single 100 or < was placed at nodes if indices under both criteria were 100 or less than 61, respectively. For ML analyses, the assumed model of nucleotide evolution was GTR + I + G. Scale bar is equivalent to 0.1 substitutions per site.

Phylogenetic hypothesis based on mitochondrial 16S data (dataset 2). Phylogram of one of the 20 most parsimonious trees, with bootstrap indices under both ML and MP at each node. ‘ < ’ indicates a bootstrap index of less than 61; a single 100 or < was placed at nodes if indices under both criteria were 100 or less than 61, respectively. For ML analyses, the assumed model of nucleotide evolution was K81uf + I + G. Scale bar is equivalent to 20 substitutions.

Phylogenetic hypothesis based on SSU data (dataset 3). Strict consensus of the 21 most parsimonious trees, with bootstrap indices under both ML and MP at each node. ‘ < ’ indicates a bootstrap index of less than 61; a single 100 or < was placed at nodes if indices under both criteria were 100 or less than 61, respectively. For ML analyses, the assumed model of nucleotide evolution was GTR + I + G.

Phylogenetic hypotheses based on LSU data (dataset 4). Left: strict consensus of the 12 most parsimonious trees with bootstrap indices under both ML and MP at each node. ‘ < ’ indicates a bootstrap index of less than 61; a single 100 or < was placed at nodes if indices under both criteria were 100 or less than 61, respectively. For ML analyses, the assumed model of nucleotide evolution was GTR + I + G. Right: ML topology with ML bootstrap indices for three nodes receiving support under ML but not under MP; terminal taxa in the same order as shown on the left.

The fifth and final dataset was used to derive the most robust phylogenetic hypothesis possible for Trachylina. This dataset combined data from all three markers for which at least SSU or LSU had successfully been derived (Table 1; Figure 8), as well as the seven outgroup hydroidolinans for which all three markers were available. For this dataset, two chimerical sequences were constructed. Mitochondrial 16S from Solmundella bitentaculata from Antarctica was combined with nuclear SSU and LSU of S. bitentaculata from the Mediterranean Sea. Mitochondrial 16S from Pantachogon haeckeli from the central coast of California was combined with un-vouchered Genbank SSU and LSU sequences derived from P. haeckeli from Californian coastal waters.
Phylogenetic hypothesis based on combined 16S, SSU, and LSU data (dataset 5). Phylogram of ML topology, with bootstrap indices under both ML and MP at each node. ‘ < ’ indicates a bootstrap index of less than 61; a single 100 or < was placed at nodes if indices under both criteria were 100 or less than 61, respectively. For ML analyses, the assumed model of nucleotide evolution was GTR + I + G. Scale bar is equivalent to 0.1 substitutions per site.

Phylogenetic analyses
Phylogenetic hypotheses were constructed under both maximum likelihood (ML) and maximum parsimony (MP) optimality criteria. Modeltest (Posada & Crandall, Reference Posada and Crandall1998) was used, employing the Akaike information criterion, to choose the most appropriate model for each of the datasets. Assuming these models, PAUP* (Swofford, Reference Swofford2002) was used to search (with 100 random addition replicates) for the topology with the greatest likelihood and GARLI v0.951 (Zwickl, Reference Zwickl2006) was used to calculate ML bootstrap indices from searches for 500 replicate datasets. PAUP* was further employed to find most parsimonious topologies, with 100 random replicate searches and to calculate bootstrap indices (500 replicates, with 10 searches per replicate).
RESULTS
In general, ML and MP topologies are congruent, only differing where bootstrap values are low under one or both criteria. Topologies, either ML or MP, for each of the five datasets are presented as Figures 4–8. In addition, both ML and MP bootstrap indices are reported on these figures at each of the relevant nodes. Two main results are drawn from Figure 4 showing the ML topology for the combined SSU and LSU analysis including non-hydrozoan taxa as outgroups. First, the representative of Actinulida, Halammohydra sp., does not appear to be an early diverging lineage of Hydrozoa, but is instead revealed as a member of Trachylina. Second, Microhydrula limopsicola (classified in the family Microhydrulidae within Limnomedusae) is shown to not be a member of Hydrozoa at all, but instead to have a very close relationship to the stauromedusan Haliclystus octoradiatus.
Figure 5 presents one of 20 MP trees based on our 16S data. Generally, nodes in the topology do not receive high support. There is a well-supported split between two clades, one containing species of Limnomedusae plus species of the trachymedusan family Geryoniidae and the other comprising all the remaining trachymedusans, narcomedusans and the actinulidan Halammohydra sp. Other phylogenetic associations that receive method-independent (i.e. both MP and ML) support include: the limnomedusan genera Limnocnida and Craspedacusta; the trachymedusan genera Geryonia and Lirope (Geryoniidae); the trachymedusan genera Haliscera, Halicreas and Botrynema (Halicreatidae); the trachymedusan genera Rhopalonema and Pantachogon; the trachymedusan genera Amphogona, Aglaura and Aglantha; and, the narcomedusan genera Aegina, Solmundella and Solmissus.
Figure 6 shows the strict consensus of 21 MP trees found in searches using the SSU dataset. With three exceptions, all of the relationships strongly supported by the mitochondrial 16S analyses (Figure 5) receive method independent support from the SSU data. The first exception is that there is no support for the splitting of Trachylina into two main clades. The second exception is that the ML bootstrap support for the node linking Haliscera, Halicreas and Botrynema (Halicreatidae) is only 54. The third exception is that the clade linking Aegina citrea, Solmundella and Solmissus also includes Tetraplatia volitans, which had an uncertain position based on the 16S data. Additional clades receiving support, as measured by both MP and ML bootstraps are: the limnomedusan taxa Aglauropsis (marine) and Maeotias (brackish) with the freshwater Craspedacusta and Limnocnida; the limnomedusan genus Olindias with Geryoniidae; and, the two trachmedusan clades (Rhaopalonema + Pantachogon and Amphogona + Aglaura + Aglantha).
The strict consensus of 12 MP trees based on the LSU data supports many of the relationships also indicated by the 16S and SSU analyses (Figure 7). One of the two main trachyline clades (non-geryoniid trachymedusans, narcomedusans and the actinulidan Halammohydra sp.) suggested by 16S is also supported by LSU data. Two additional clades that receive high bootstrap support from LSU data under both MP and ML criteria are: all sampled representatives of Rhopalonematidae plus Halammohydra sp.; and, all sampled representatives of Narcomedusae.
Finally, Figure 8 shows the ML topology using the combined dataset. Given the great amount of correspondence between the different single-marker analyses, it is not surprising that this combined analysis contains nearly all of the associations enumerated above. In total comparing across all the single-marker analyses, there is only one instance of relationships receiving strong contradictory support. The SSU, LSU and combined data support an alliance of Aegina citrea, Solmundella, Solmissus and Tetraplatia volitans, whereas the 16S analyses suggested that the first three taxa form a well-supported clade exclusive of Tetraplatia.
DISCUSSION
Scope of Limnomedusae
Limnomedusae has a somewhat complicated taxonomic history that reflects uncertainty about the phylogenetic affinities of the groups that constitute it, as well as confusion arising from the historical use of separate taxonomic systems by experts on hydromedusae and hydroids. The taxon was created in the late 1930s (Kramp, Reference Kramp1938; Browne & Kramp, Reference Browne and Kramp1939) for species of the families Moerisiidae, Olindiasidae (=Olindiidae) and Proboscidactylidae. The underlying concept of Limnomedusae was that it should receive species with a biphasic life cycle, whose medusae did not fit the Anthoathecata (=Anthomedusae or Athecata) because they had either ecto-endodermal statocysts or gonads along their radial canals, and whose polyps did not fit the Leptothecata (=Leptomedusae or Thecata) because they lacked a theca. Subsequently, Monobrachiidae, which also meets the criteria above, has been added to Limnomedusae (Naumov, Reference Naumov1960), as have the small and simple species of Armorhydridae and Microhydrulidae, for lack of better alternatives (Bouillon, Reference Bouillon1985). More detailed analysis that included information on the cnidome indicated that Moerisiidae is more likely to share a recent common ancestry with members of the anthoathecate group Capitata (Rees, Reference Rees1958; Petersen, Reference Petersen1990). Likewise, the absence of statocysts and the presence of desmonemes strongly favour the hypothesis that Proboscidactylidae is closely related to anthoathecate species classified as Filifera (Edwards, Reference Edwards1973; Schuchert, Reference Schuchert1996). Recently, molecular data have confirmed that Moerisidae and Proboscidactylidae do not belong in Limnomedusae (Collins et al., Reference Collins, Schuchert, Marques, Jankowski, Medina and Schierwater2006a), thereby limiting its scope to Armorhydridae, Microhydrulidae, Monobrachidae and Olindiasidae. To a certain extent, our results (Figures 4–8) challenge this view of Limnomedusae, as further discussed below.
Microhydrula limopsicola is a species of Stauromedusae
Microhydrula limopsicola (originally classified within Limnomedusae) is an Antarctic species that possesses minute polyps found living on bivalve shells (Jarms & Tiemann, Reference Jarms and Tiemann1996; Figure 2C). The polyps are less than 0.5 mm in length and 0.35 mm in diameter and solitary, though they do form aggregates. The morphology of the polyps is quite simple as they lack tentacles and possess just a single type of nematocyst, microbasic euryteles. These polyps were observed to rest on a thin periderm and produce creeping, asexual frustules (Jarms & Tiemann, Reference Jarms and Tiemann1996). The polyps of Limnomedusae (where known) are tiny, often without tentacles (e.g. Figure 2A), capable of producing frustules, and typically armoured with microbasic euryteles. This suite of features therefore suggests that M. limopsicola should be part of Limnomedusae. Thus, it is quite surprising that genetic data taken from samples of M. limopsicola strongly indicate that it is actually part of the non-hydrozoan Stauromedusae (Figure 4).
Concern that this result was a product of contamination prompted a re-sampling of a culture of Microhydrula limopsicola maintained in the Jarms laboratory. This yielded the same data, indicating that M. limopsicola is a member of Stauromedusae. In fact, in an ongoing study of Stauromedusae, mt16S data (Collins et al., unpublished data) identify M. limopsicola as a member of the genus Haliclystus, with a very close relationship to the species of Haliclystus from southern Chile reported on by Zagal (Reference Zagal2004).
The most straightforward way to reconcile the interpretation of M. limopsicola as described by Jarms & Tiemann (Reference Jarms and Tiemann1996) is that it likely represents a microscopic life cycle stage not previously known in Stauromedusae. This would explain why no gonads were observed by Jarms & Tiemann (Reference Jarms and Tiemann1996). Life cycles of stauromedusans (and indeed most cnidarians) are not well known or documented. In particular, the juvenile stages of very few stauromedusan species are known. The only case for which the actual habitat of juvenile stauropolyps is known is for two species of Stylocoronella, whose polyps live interstitially (Salvini-Plawen, Reference Salvini-Plawen1987; Kikinger & Salvini-Plawen, Reference Kikinger and Salvini-Plawen1995). Euryteles are widely distributed across Medusozoa, including Stauromedusae, so this character is not difficult to reconcile. However, this would appear to be the first time that a periderm and frustules have been recognized in any species of Stauromedusae. Both features are known from species within Discomedusae (Scyphozoa) and Limnomedusae (Hydrozoa) suggesting that they have evolved independently at least two times.
It is unclear if this result could be extended to other species of Microhydrulidae, the limnomedusan family to which M. limopsicola was assigned. The family contains just three species in two genera, and no adults or sexual reproduction have been reported from any of them. Microhydrula pontica is very similar in morphology to M. limopsicola and it may be that this species too, known from the northern Atlantic, represents another species of Stauromedusae. Rhaptapagis cantacuzeni, the third representative of the family, is differentiated from the other species by the possession of an unusual form of microbasic euryteles known as semiophores (Bouillon & Deroux, Reference Bouillon and Deroux1967). DNA sampling of these taxa should help to resolve phylogenetic affinities of these species.
Freshwater limnomedusans
We present some new mt16S data for freshwater limnomedusans. These data further reinforce (albeit with low support) the hypothesis that freshwater limnomedusans had a single evolutionary origin (Figure 5, but note the robust support in Figure 8). Among our 16S samples is a representative of Craspedacusta ziguensis. As reviewed by Jankowski (Reference Jankowski2001), the validity of this species has been in doubt. However, our mt16S data, which include representatives of two other readily accepted species of Craspedacusta, C. sowerbii and C. sinensis, indicate that C. ziguensis has comparable divergences from these two species (P distances of 7.4% and 6.1%, respectively) as they do from each other (8.8%). The SSU and 16S data show Craspedacusta to have a close relationship to the freshwater genus Limnocnida. The polyps of the two genera are nearly indistinguishable: they are diminutive (1 mm or less in length), form small colonies up to seven individuals, lack tentacles, possess papillae with eurytele nematocysts at their oral ends, and produce creeping frustules that develop into additional polyps (Bouillon, Reference Bouillon1957). The other freshwater species sampled here, Astohydra japonica, also produces frustules, but the polyps are smaller (up to 0.3 mm in length), solitary, and have 10 to 20 nematocyst-rich tentacles composed of single cells that may be homologous with the papillae of Craspedacusta and Limnocnida polyps (Hashimoto, Reference Hashimoto1981). The polyps of Astrohydra japonica and those of another freshwater genus, Calpasoma (not yet sampled for molecular data), are indistinguishable, and if it were not for the presence of a poorly known medusa stage in the former (Hashimoto, Reference Hashimoto1985), the two would have to be considered conspecific.
Geryoniidae (Trachymedusae) is derived from within Limnomedusae
The medusae of Trachymedusae and Limnomedusae are quite similar, with gonads typically on the radial canals and statocysts of ecto-endodermal origin. The two differences between the groups are the presence or absence of a polyp stage and hollow or solid marginal tentacles in Limnomedusae and Trachymedusae, respectively (Schuchert, Reference Schuchert2007). As a practical matter, the two groups can often be separated based on the number of radial canals, with most species of Limnomedusae possessing four (rarely six) and most species of Trachymedusae having eight (but some with four or six). We have found strong evidence that Geryoniidae is the sister group to species of the limnomedusan genus Olindias (Figures 4–8), whereas our analyses weakly favour the hypothesis that Limnomedusae plus Geryoniidae forms a clade with Monobrachium as its earliest diverging lineage (Figures 4 & 8).
Interestingly, Geryoniidae is one of the two families of Trachymedusae with species not characterized by having eight radial canals, but rather four (Liriope) or six (Geryonia). Moreover, species of Geryoniidae have both solid and hollow marginal tentacles, as well as centripetal canals. Therefore, in most respects Geryoniidae can readily be incorporated within Limnomedusae. It has long been known that members of Geryoniidae lack a polyp stage (e.g. Brooks, Reference Brooks1886) and this appears to be the major difference between the group and members of Limnomedusae. Given our phylogenetic results, it would appear that a polyp stage was likely lost independently in Geryoniidae and the lineage leading to the other trachymedusans.
Scope of Trachymedusae
As presently constituted, Trachymedusae comprises five families, Geryoniidae, Halicreatidae, Petasidae, Ptychogastriidea and Rhopalonematidae. Our analyses contain members of three of these families; we have yet to sample Petasidae and Ptychogastridae. Besides Geryoniidae, the other group of trachymedusans without eight radial canals is Petasidae. Petasids have four radial canals, raising the possibility that they could potentially fall with Geryoniidae within Limnomedusae. However, they lack other features (hollow tentacles, centripetal canals) that could give credence to such a hypothesis. Ptychogastriids are somewhat more typical of Trachymedusae, possessing eight radial canals. But these species are bentho-pelagic and have features (such as tentacles with adhesive discs) that appear to be adapted for such an existence. Several members of Limnomedusae (Olindias, Gonionemus and Vallentinia, etc.) also spend considerable time resting on substrates, prompting one to question if ptychogastriids too might be closely related to or derived from within Limnomedusae.
Our analyses find strong support for the hypothesis that Halicreatidae and Rhopalonematidae form a clade with Narcomedusae and the interstitial Halammohydra sp. (Figures 7 & 8). The best sampled family in our analyses is Rhopalonematidae. A close alliance appears to exist between Aglantha, Aglaura and Amphogona, all of which have a gastric peduncle and pendant gonads. Our data also suggest a relatively close relationship between Pantachogon and Rhopalonema, and that these two genera form a clade with Aglantha plus Aglaura plus Amphogona. Among our samples of Rhopalonematidae, Crossota appears to be the earliest diverging lineage. Interestingly, in many of our analyses, the unusual interstitial Halammohydra (Actinulida) is shown as having had an origin within Rhopalonematidae. In all of our analyses, representatives of Halicreatidae form a well supported clade. Our combined data analyses suggest that this family is the sister group of a clade containing Narcomedusae, Halammohydra and the rhopalonematids (Figure 8).
Halammohydra may be derived from within Rhopalonematidae (Trachymedusae)
Species of Halammohydra were among the first cnidarians discovered to inhabit the interstices of sand grains (Remane, Reference Remane1927). Subsequent studies have led to the discovery of additional species of interstitial hydrozoans (e.g. Swedmark, Reference Swedmark1964; Clausen, Reference Clausen1971; Norenburg & Morse, Reference Norenburg and Morse1983). Otohydra, discovered off Roscoff, was grouped with Halammohydra in the order Actinulida by Swedmark & Tessier (Reference Swedmark and Teissier1958). In their view (Swedmark & Tessier, Reference Swedmark, Teissier and Rees1966), these small and simple animals were representatives of the earliest diverging hydrozoan lineages, which themselves were inhabitants of the interstitial environment. In contrast, the presence of features including solid tentacles, ecto-endodermally derived statocysts, and lack of asexual reproduction, have been regarded as evidence that actinulids may be related to free-swimming Narco- and Trachymedusae (e.g. Remane, Reference Remane1927; Werner, Reference Werner1965; Salvini-Plawen, Reference Salvini-Plawen1987; Bouillon & Boero, Reference Bouillon and Boero2000; Marques & Collins, Reference Marques and Collins2004). In particular, it has been suggested that the small and simple bodies of adult actinulids resemble early developmental stages of trachylines (e.g. Swedmark, Reference Swedmark1964; Bouillon & Boero, Reference Bouillon and Boero2000). Gould (Reference Gould1977), for example, holds that actinulids and other interstitial organisms may have attained small body sizes by accelerating sexual maturation (paedomorphosis through progenesis), which he regarded as an important adaptive response for inhabiting minute interstitial spaces.
Paedomorphic species have been notoriously difficult for phylogenetic analyses based on morphology (Wiens et al., Reference Wiens, Bonett and Chippindale2005) and molecular data can be particularly important for such cases. Our analyses consistently place Halammohydra within Trachylina (Figures 4–8) and confirm earlier suggestions that actinulids are related to Narco- and Trachymedusae. Specifically, ML analyses of LSU (Figure 7, right) and combined data (Figure 8) indicate that Halammohydra falls within the family Rhopalonematidae (Trachymedusae). Although adult rhopalonematids are typical planktonic trachyline medusae, some early developmental stages are similar to the adult Halammohydra. For example, developing medusae of the rhopalonematid Aglaura hemistoma resemble adult actinulids in having an elongated and flagellated actinuloid body shape bearing long tentacles (Metschnikoff, Reference Metschnikoff1886). Although trachyline medusae are usually planktonic, the evolution of the interstitial Halammohydra from a trachyline ancestor may have followed a shift from a holopelagic to a pelago-benthic or holobenthic life cycle. As mentioned above, several trachyline species live pelago-benthic lifestyles. It is conceivable that the evolution of a similar epibenthic habitat in the ancestor of actinulids may have preceded the invasion of the interstitial environment.
It remains to be seen how our understanding of actinulidan evolution will be refined when samples of Otohydra become available for DNA-based analyses. Species of the latter genus share with Halammohydra the flagellated/ciliated actinuloid body with ontogenetically similar (ecto-endodermal) statocysts. However, the two groups have some significant differences, with Otohydra lacking a nerve ring and an adhesive organ, being hermaphroditic, and possessing two types of tentacles (Swedmark & Teissier, Reference Swedmark and Teissier1958; Swedmark, Reference Swedmark1964; Clausen, Reference Clausen1971). Elucidating the phylogenetic placement of Otohydra remains an important step towards a better understanding of the patterns and processes that resulted in the invasion of the interstitial environment within Trachylina.
Scope of Narcomedusae
The enigmatic intracellular parasitic cnidarian Polypodium hydriforme (see Raikova, Reference Raikova1994) has sometimes been referred to Narcomedusae (e.g. Hyman, Reference Hyman1940), but unpublished analyses suggest that it is not part of this group (Evans et al., in preparation). Therefore, just four families make up Narcomedusae (Schuchert, Reference Schuchert2007). Three families, Aeginidae, Cuninidae and Tetraplatiidae, are sampled here, whereas Solmarisidae is not. The name Tetraplatiidae first appeared in print in Daly et al. (Reference Daly, Brugler, Cartwright, Collins, Dawson, Fautin, France, McFadden, Opresko, Rodrigues, Romano and Stake2007) as a nomen nudum, but the taxonomic authority was erroneously stated to be Schuchert, Reference Schuchert2007 in reference to Schuchert's (2007) Hydrozoan Directory website. We take the opportunity to formally establish the new family Tetraplatiidae, with its type genus being Tetraplatia Busch, 1851. Its members are readily distinguished by the possession of four distinctive swimming lappets arising from a groove that divides their worm-like bodies into aboral and oral halves.
Our analyses suggest that our sampled representatives of Narcomedusae are monophyletic, though support for this hypothesis is only moderate (Figures 6–8). We find no strong evidence for the monophyly of Aeginidae or Cuninidae. However, support for most relevant nodes is weak and so it does not appear that our analyses contradict monophyly of these families, with one exception. In most of our analyses, the worm-shaped Tetraplatia is shown to have a close relationship with Aegina citrea and Solmundella bitentaculata. The sister to these three species, among our samples, appears to be Solmissus marshalli. Thus, Tetraplatia and by extension the family Tetraplatiidae appears to fall within Aeginidae. As with all the subgroups dealt with in the present paper, additional sampling should further enhance understanding of the phylogeny and evolution of Narcomedusae.
Concluding remarks
Important questions remain about how to best classify trachyline taxa in light of the phylogenetic analyses presented here. Because our taxon sampling is relatively sparse, formal recommendations seem inappropriate at this time. However, our limited sampling suggests that Trachymedusae is (at least) diphyletic, suggesting that this taxon will need to either have its meaning modified or be discarded. Because Limnomedusae is paraphyletic with respect to the trachymedusan family Geryoniidae, Limnomedusae will also need to have its meaning altered to take these, and forthcoming, findings into account.
Finally, future sampling of molecular data will no doubt be used to clarify species boundaries within trachyline cnidarians. Our data are extremely limited in this regard, but reporting of a few observations are warranted. We note several substantial genetic divergences within what are currently thought to be single species. First, both mitochondrial 16S and nuclear SSU data taken from Liriope tetraphylla collected in California and the Caribbean (Panama) show significant divergences (P distances >11% for 16S and >0.3% for SSU) likely indicating at least some crypsis in this cosmopolitan species. Similarly, Tetraplatia volitans and Tetraplatia sp. from California and Japan, respectively, have mitochondrial 16S sequences that differ by nearly 6%, exceeding typical intraspecific differences measured for other hydrozoans (Schuchert, Reference Schuchert2005; Govindarajan et al., Reference Govindarajan, Halanych and Cunningham2005; Miglietta et al., Reference Miglietta, Piraino, Kubato and Schuchert2007). Visual inspection of Tetraplatia sp. specimens from Japan suggests that these do not fit the description of T. chuni, the only other named species in the genus, but rather that of T. volitans, suggesting that this latter name may be being used to refer to at least two distinct species. In contrast, very little to no genetic divergence was revealed in samples of Crossota rufobrunnea and Pantachogon haeckeli (including some unusual colour forms; Figure 1H, I) from California and Japan, and Aglaura hemistoma samples from Japan and the Mediterranean Sea. The geographical distributions of trachyline hydrozoans, as well as the factors controlling them, remain open and interesting questions for further research.
ACKNOWLEDGEMENTS
We gratefully acknowledge support from the US National Science Foundation (NSF) Assembling the Tree of Life Grant 0531779 (to P.C., A.G.C., and D. Fautin). We also thank: three anonymous referees for reviewing an earlier version of the MS; P. Schuchert for providing DNA extractions; C. Mah and K. Halanych for collecting medusae in Antarctica through support from a NSF grant (OPP-0338218 to KH); the Smithsonian's Marine Science Network and R. Collin for supporting the collection of specimens; the Smithsonian's Laboratory of Analytical Biology for the use of its computer cluster to conduct phylogenetic analyses; E. Strong for the use of a computer to conduct phylogenetic analyses; N. Evans for developing several new LSU primers; Lynne Christianson, the David and Lucile Packard Foundation and the ROVs ‘Tiburon’ and ‘Ventana’ for support used to collect specimens; D. Calder, P. Schuchert, S. Cairns and A. Kohn for consultation on how best to handle the nomenclatural issues surrounding the name Tetraplatiidae; and, NSF (PEET DEB-9978086) and FAPESP (06/02960-8/05821-9/60327-0) for financial support for A. Lindner.



