




No CrossRef data available.
Article contents
Purification and characterization of two iron superoxide dismutases of Phytomonas sp. isolated from Euphorbia characias (plant trypanosomatids)
Published online by Cambridge University Press: 10 June 2004
Abstract
Two superoxide dismutases (SODI and SODII) have been purified by differential centrifugation, fractionation with ammonium sulphate followed by chromatographic separation (ionic exchange and affinity), from a plant trypanosomatid isolated from Euphorbia characias, and then characterized for several biochemical properties. Both enzymes were insensitive to cyanide but sensitive to hydrogen peroxide, properties characteristic of iron-containing superoxide dismutase. SODI had a molecular mass of approximately 66 kDa, whereas the molecular mass of SODII was approximately 22 kDa, both enzymes showing single bands. The isoelectric points of SODI and SODII were 6·8 and 3·6, respectively. The enzymatic stability persisted at least for 6 months when the sample was lyophilized and preserved at −80 °C. Digitonin titration and subcellular fractionation showed that both enzymes were in the cytoplasmic fraction, although part of SODII isoenzyme was also associated with glycosomes. We assayed these activities (SOD) in 18 trypanosomatid isolates on isoelectric focusing gels, and have demonstrated that the SOD is a biochemical marker sufficient to identify a trypanosomatid isolated from a plant as belonging to the genus Phytomonas and to distinguish between a true Phytomonas and other trypanosomatids that are capable of causing transient infections in plants.
Keywords
Information
- Type
- Research Article
- Information
- Copyright
- © 2004 Cambridge University Press
INTRODUCTION
Many plants are known to be parasitized by members of the family Trypanosomatidae and, more concretely, by species of the genus Phytomonas (Dollet, 1984). In crops such as coffee, coconut and oil palm, infection by Phytomonas can have devastating consequences (Dollet, 1984). These infections not only inflict economic losses, but also carry important ecological implications from intensive crop treatments with insecticides against the vector in the absence of effective treatments against these parasites (Dollet et al. 1979).
During its cycle, the pathogen can be located in different types of hosts (reservoir, vector and ‘definitive’ host), and, in the case of trypanosomes, the detection and identification of the parasite in these different hosts are essential to evaluate epidemiological situations, to monitor the impact of campaigns against the disease, and to take preventive and therapeutic measures. This is a complex problem, given that the trypanosomatid in question may coexist for instance in their insect vector, with one or many other morphologically indistinguishable trypanosomatids (Podlipaev, 2001). Both the study of the circulation of parasites as well as the demonstration of infection in hosts therefore require a precise identification of trypanosomatids. The description of new Trypanosomatid species has traditionally been based on morphological characteristics and on the host. Today, these criteria are considered inadequate, leading researchers to seek other parameters to identify these protozoa. Different experiments have identified specific markers (Texeira et al. 1996; Sánchez-Moreno et al. 1998), which can be highly useful in classifying and differentiating the species within the trypanosomatids isolated from plant or insects.
The presence of a pathogen in a host is known to trigger a series of mechanisms meant to repel the invasion. These defence mechanisms include highly conserved processes of the evolutionary chain, such as the production of free radicals, which are extremely unstable and reactive and can alter the integrity of the membranes or the nucleic acids of the pathogens (Docampo, 1995). Parasites, meanwhile, have developed highly efficient detoxifying mechanisms to adapt to their host. These mechanisms include a number of enzymes (catalase, glutathione peroxidase, superoxide dismutase, etc.) which act as powerful detoxifying agents. The enzymes known as superoxide dismutases (SOD; EC 1.15.1.1) constitute the first line of defence against the toxic superoxide radical (O2−) (Liochev & Fridovich, 1997). In this sense, SOD activity has been detected in the main species belonging to the family Trypanosomatidae, in Trypanosoma cruzi (Ismail et al. 1997), in T. brucei brucei (Kabiri & Steverding, 2001), in several species of the genus Leishmania (Ismail et al. 1994), in some lower Trypanosomatids, and in plant trypanosomes (Quesada et al. 2001). However, very few species have been biochemically characterized, and none in the case of Phytomonas spp.
Therefore, the aim of the present work was to characterize, at the molecular and biochemical level, the SODs of a plant trypanosomatids, Phytomonas sp. isolated from Euphorbia characias. The eventual goal is to develop a molecular tool that will enable the reliable identification and diagnosis of these trypanosomatids.
MATERIALS AND METHODS
Parasites and culture
Promastigotes of Phytomonas isolated from latex vessels of Euphorbia characias were grown in axenic Grace's medium (Gibco) supplemented with 10% heat-inactivated foetal bovine serum at 28 °C in Falcon tissue-culture flasks. Cells were collected at the late logarithmic-phase of growth by centrifugation (1500 g for 5 min at room temperature). The pellet of cells was washed twice and resuspended in ice-cold STE buffer (0·25 M sucrose, 25 mM Tris–HCl, 1 mM EDTA, pH 7·8) (Buffer 1).
Nine other trypanosomatids, previously described as belonging to the genus Phytomonas according to various criteria, were cultured in a similar way. The Phytomonas isolates were from: mango (Mangifera indica), clover (Trifolium sp.) and tomato (Lycopersicon esculentum), all from Spain (Sanchez-Moreno et al. 1995, 1998); from latex plant E. pinea (EpiM1) (Guerrini et al. 1992); from the phloem of coconut palm (Hart1) (Menara et al. 1988); from the insects Veneza zonata (Coreidae, 40/460, TCC-203) and Fabrictilis gonagra (Coreidae, 19/231G41, TCC-110) (Teixeira et al. 1996); and Brazilian tomato isolates (9T, 10T) (Fernandez-Becerra et al. 1996). In a similar way, 2 species from the genus Herpetomonas (H. samuelpessoai, ATCC 30252; H. davidi, TCC 048) were grown, as was 1 species from the genus Crithidia (C. luciliae, ATCC 14765) another from the genus Leptomonas (L. collosoma, ATCC30261).
Other Trypanosomatids were cultured according to the protocol of Miralles et al. (2002). Three strains of the genus Trypanosoma (T. cruzi, maracay strain, an isolate from an asymptomatic case in Brazil and another isolate from Peru and Leishmania (L. donovani, LCR-L133) were used.
Extraction and purification of the SOD isoenzymes
The cells were suspended (0·5–0·6 g wet weight/ml) in 3 ml of Buffer 1, and disrupted by 3 cycles of sonic disintegration, 30 s each to 60 volts. The sonicated homogenate was centrifuged at 1500 g for 5 min at 4 °C, and the pellet was washed 3 times with Buffer 1, to obtain a total supernatant fraction of 9 ml (Fraction H). This fraction was centrifuged (2500 g for 10 min at 4 °C), the supernatant collected, and solid ammonium sulphate added. The protein fraction, which precipitated at between 30 and 85% salt concentration, was centrifuged (9000 g for 20 min at 4 °C), redissolved in 2·5 ml of 20 mM potassium phosphate buffer, pH 7·8, containing 1 mM EDTA (Buffer 2) and dialysed in a Sephadex G-25 column (Pharmacia, PD 10), previously balanced with Buffer 2, bringing it to a final volume of 3·5 ml (Fraction P85). This fraction was applied to a QAE-Sephadex A-50 column (30×2 cm) balanced with Buffer 2. The column was extensively washed with the same buffer, and the absorbed proteins were eluted with a linear gradient of KCl (0–0·6 M). Fractions exhibiting SOD activity (peaks Q1 and Q2) were pooled, concentrated by ultrafiltration in Centriprep-10 tubes (Amicon) at 3000 g, separately. The two fractions were applied separately to the G-75- Sephadex column (1·6×75 cm) balanced with Buffer 2. The enzyme was eluted with the same buffer solution (200 ml); the fractions with the highest specific activity (SODI and SODII) were pooled, concentrated by ultrafiltration in Centriprep-10 tubes (Amicon) at 3000 g, and used for the experiments described.
Digitonin treatment of intact cells
The cell suspension was diluted at a density corresponding to a protein content of 2 mg/ml in Buffer 1 containing an increased concentration of digitonin. After incubation for 5 min at 0 °C, suspensions were centrifuged. Aliquots of the supernatants were used to assay the various enzymatic activities.
Enzyme assay
SOD activity was determined by NAD(P)H oxidation according to the method of Paoletti & Mocali (1990). One unit was the amount of enzyme required to inhibit the rate of NAD(P)H reduction by 50%.
Pyruvate kinase and hexokinase activities were determined according to Bergmeyer (1974) and isopropanol dehydrogenase activity was carried out precisely as described by Uttaro, Sánchez-Moreno & Opperdoes (1997).
Protein determination
The protein content was determined in all the fractions using the Bio-Rad test, based on the method of Bradford (1976), with BSA as a standard.
Gel electrophoresis
Native-PAGE was performed with 20% homogeneous polyacrylamide gel in the Phast System (Amersham Pharmacia Biotech, Uppsala, Sweden). Isoelectric focusing in polyacrylamide Phast gel pI 3-9 was performed as described previously (Bécuwe et al. 1996). The gels were stained according to the method described by Beyer & Fridovich (1987). The gels were stained for protein with silver nitrate as described in the Phast System handbook.
Determination of molecular weights of purified enzymes
Apparent molecular weights of the purified enzymes were determined by 20% homogeneous native-PAGE as described above. Molecular weights of standard proteins were: phosphorylase b (94000), bovine serum albumin (67000), ovalbumin (43000), carbonic anhydrase (30000), soybean trypsin inhibitor (20100), and alpha-lactalbumin (14400) (Pharmacia, Uppsala, Sweden). The gels were stained for protein with silver nitrate and for SOD activity as described above.
Determination of the isoelectric point
Isoelectric points were determined in the Phast System as described above, using as markers, trypsinogen, lentil-lectin acidic band, horse-heart myoglobin, carbonic anhydrase II, alpha-lactoglobulin A, soybean trypsin inhibitor and amyloglucosidase from Aspergillus niger (pI values of 9·3, 8·15, 6·8, 5·9, 5·1, 4·6 and 3·6, respectively). The gels were stained for protein with silver nitrate and for SOD activity as described above.
Determination of the SOD metal cofactor
For the determination of the types of purified SOD on the isoelectric focusing with gel pI 3-9, the purified enzymes were mixed with potassium cyanide (KCN, 20 mM), or 5 mM H2O2, 0·1 mM disodium EDTA, and incubated at room temperature for 15 min. The samples were applied to isoelectric focusing in polyacrylamide Phast gel pI 3-9 and stained SOD activity as described above.
Effect of temperature in the preservation of SOD activity
The stability of SOD activity was assayed at different temperatures (4 °C, −20 °C, −80 °C, lyophilized and preserved at −80 °C), using the P85 fraction as a sample. The SOD activity was assayed according to the method of Paoletti & Mocali (1990) and the protein concentrations were determined by the Bradford (1976) method. For the assay at 4 °C, the activity was determined daily for 8 days, and, in the case of −20 °C and −80 °C, determinations were made weekly for the first month and a half, and afterwards every 30 days to the sixth month. For the P85 fraction, lyophilized and preserved at −80 °C, the determinations were made monthly, for 6 months. All cases started with an initial protein concentration of 2 mg/ ml.
Subcellular localization of SODs
Homogenates of Phytomonas spp. were prepared by grinding the cell paste with silicon carbide abrasive grain, as described previously (Steiger, Opperdoes & Bontemps, 1980). After differential centrifugation following the method described by Quesada et al. (2001). The SOD activity was determined in the different fractions according to the method of Paoletti & Mocali (1990).
RESULTS
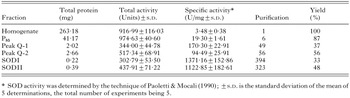
When lysate from promastigote forms of Phytomonas isolated from E. characias was used for isoelectric focusing polyacrylamide-gel electrophoresis followed by SOD activity staining, 2 different SOD bands were detected. The 2 SODs were separated by QAE-Sephadex ion-exchange chromatography (Fig. 1A and B): peaks Q1 (fractions 3–15) and Q2 (fractions 19–30). The 2 active peaks were collected, desalted and concentrated, and further purified using Sephadex G-75 molecular sieve chromatography. The 2 new active peaks (Fig. 1C and D), SODI (fractions 14–21) and SODII (fractions 11–20), were collected, desalted, and concentrated. Table 1 summarizes the purifications of the SODs. SODI was purified to a specific activity of about 1371·16 U/mg protein, with a yield of 33%. SODII was purified to a specific activity of about 1122·85 U/mg protein with a yield of 48%.
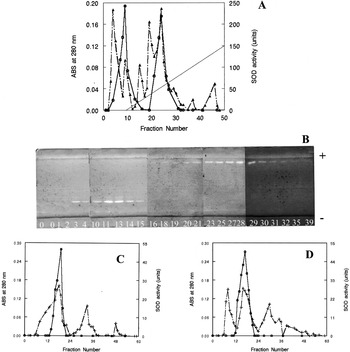
Fig. 1. Purification profiles of SODs from Phytomonas isolates from Euphorbia characias. (A) QAE-Sephadex ion-exchange chromatography. (B) Isoelectric focusing gel electrophoresis pI 3-9 of the fractions eluted by QAE-Sephadex, the SOD activity was stained following the protocol of Beyer & Fridovich (1987). (C) Sephadex G-75 molecular sieve chromatography of SODI. (D) Sephadex G-75 molecular sieve chromatography of SODII. (-[utrif ]-, -+-) Protein concentration; (-□-) SOD activity (——) gradient 0–0·6 M KCl.
SODI had a molecular mass of approximately 66 kDa, whereas the molecular mass of SODII was around 22 kDa, as determined by native gel-electrophoresis analysis (Fig. 2A). Both SODI and SODII showed single bands (Fig. 2B) that coincided with those of the enzymatic activity stained according to the method of Beyer & Fridovich (1987). The isoelectric points of SODI and SODII were 6·8 and 3·6, respectively (Fig. 2C).
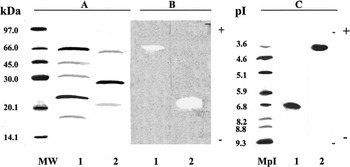
Fig. 2. Electrophoresis of the purified enzymes. (A) Native gel electrophoresis, stained by silver nitrate. (B) Activity staining in native electrophoresis. (C) Isoelectric focusing gel stained according to the protocol of Beyer & Fridovich (1987). Lane 1, SODI (2 μg); lane 2, SODII (2 μg). MW, molecular weight marker proteins; MpI, isoelectric point marker.
To determine the metal cofactor of the SODs, we performed studies with inhibitors having known effects on SODs containing various cofactors (Cu/Zn, Mn, or Fe). Both SODs were inhibited by hydrogen peroxide but not by cyanide (Fig. 3), indicating that both enzymes were Fe-SOD.
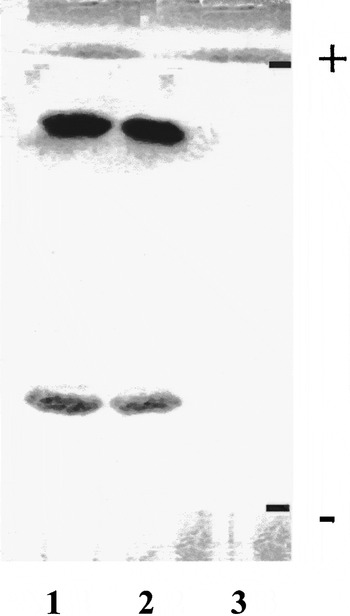
Fig. 3. Determination of the metal cofactor of Phytomonas isolates from Euphorbia characias SODs by inhibition studies performed in isoelectric focusing gel electrophoresis. Lane 1 purified SOD (fraction P85) only; lane 2 with 20 mM KCN; lane 3 with 5 mM H2O2.
At 4 °C the enzymatic activity declined almost linearly to day 8, when the values reached a low. At −20 °C and −80 °C these values declined more or less gradually till day 85, after which the activity values stabilized. Meanwhile, after lyophilization and preservation at −80 °C, the SOD-activity values remained stable for at least 6 months (data not shown).
To determine the subcellular localization of these SODs, we fractionated Phytomonas cells from E. characias by differential centrifugation. Both isoenzymes were located in the cytoplasmic fraction, although part of SODII was also present in the small-organelle fraction (glycosomes) (Fig. 4A). This distribution was also demonstrated by isoelectric focusing (pIs 3-9) and by revelation of the activity by the above-mentioned technique (Fig. 4B). This observation was corroborated in a digitonin-titration experiment where SOD activity showed a bimodal activation curve (data not shown). Using pyruvate kinase and hexokinase as markers for soluble and glycosomal localizations, respectively, we estimated that approximately 15% of the SOD activity was associated with the glycosomes. It was noteworthy that 20% of the activity was not solubilized even to high digitonin concentration, indicating that part of the SOD activity could be associated with membranes.
The SOD activity was detected in 18 different trypanosomatid species (Fig. 5). This analysis enables us to determine whether SOD can clearly differentiate the genus Phytomonas from the rest of the members of the same family. A total of 10 isolates from different plants and insects were used, these isolates being considered members of the genus Phytomonas (lanes 1–9 and 12), 2 species of the genus Herpetomonas (lanes 10 and 11), a species belonging to the genus Crithidia (lane 17), another to the genus Leptomonas (lane 18), 3 isolates from T. cruzi (lanes 13–15), and 1 species belonging to the genus Leishmania (lane 16).
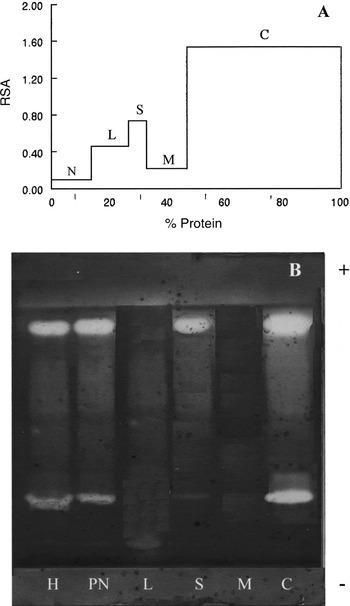
Fig. 4. Distribution profile of SOD activity in the fractions from the differential centrifugation. (A) SOD activity was determined in the different fractions according to the method of Paoletti & Mocali (1990). The relative specific activity (RSA), ratio between the percentage of total activity and percentage of total protein for each fraction (Y-axis) is plotted against the cumulative percentage of protein (X-axis). (B) Activity staining by isoelectric focusing. H, homogenate; PN, postnuclear fraction; N, nuclear; L, large organelle fraction; S, small organelle fraction; M, microsomal; C, cytoplasmic fraction.
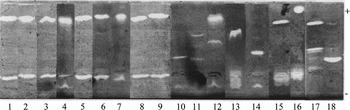
Fig. 5. IEF 3-9. Activity of SOD as determined by the method of Beyer & Fridovich (1987). (1) Phytomonas hartrot, (2) Phytomonas isolated from Euphorbia pinea, (3) Phytomonas isolated from Euphorbia characias, (4) Phytomonas isolated from Trifolium spp., (5) Phytomonas serpens, (6) Phytomonas isolated from Lycopersicum esculentum de Brazil, (7) Phytomonas isolated from Lycopersicum esculentum from Spain, (8) Phytomonas isolated from Fabrictilis gonagra, (9) Phytomonas isolated from Veneza zonata, (10) Herpetomonas samuelpessoai, (11) Herpetomonas davidi, (12) Phytomonas isolated from Mangifera indica, (13) Trypanosoma cruzi strain maracay, (14) Trypanosoma isolated from a human from Brazil, (15) Trypanosoma cruzi isolated from Peru, (16) Leishmania donovani, (17) Crithidia luciliae, (18) Leptomononas collosoma.
All the isolates deemed members of the genus Phytomonas presented identical isoenzymatic profiles, except for the isolates from clover and mango (lanes 4 and 12, respectively), they presented 3 isoenzymatic bands, in the case of the clover isolate, 2 of them had a pI equal to that of the SODI and SODII of P. characias and, in the case of the mango only 1 of them had a pI equal to that of SODII.
In the rest of the trypanosomatids studied, different activity bands appeared with different pI with respect to species in the genus Phytomonas. In the case of C. luciliae and L. collosoma (lanes 17 and 18, respectively) various activity bands were found, one of these coinciding in its pI with the SODII band of Trypanosomatids from plants.
DISCUSSION
In this work, we purified and characterized 2 SOD isoenzymes from Phytomonas sp. isolated from E. characias (SODI and SODII), by differential centrifugation, precipitation with ammonium sulphate 35–85%, followed by chromatographic separation, first ionic exchange and afterwards affinity. To our knowledge, this is the first study to focus on the characterization of SOD in Phytomonas spp., although previous studies have described SOD activity in other plant trypanosomatids (Marín et al. 2000; Quesada et al. 2001).
The behaviour of specific inhibitors, cyanide and hydrogen peroxide, revealed that SODI and SODII are FeSODs, a characteristic that these share with all the SODs studied in other trypanosomatids: T. cruzi (Ismail et al. 1997), T. b. brucei (Kabiri & Steverding, 2001) and different Leishmania species (Docampo, 1995). This characteristic has also been found in other protozoan parasites.
Throughout the purification process, activity was steadily lost due to the duration of the process. To quantify this loss, we performed preservation assays on the total enzymatic activity at different temperatures. At 4 °C the total SOD activity rapidly decreased, reaching a 50% loss at day 3, this being a fact to take into account in the purification process. The SOD activity maintained its levels for a longer time when frozen or lyophilized and preserved at −80 °C.
The 2 SODs presented different molecular weights, with 66 kDa and 22 kDa for SODI and SODII respectively. The molecular weight of FeSODs isolated from different parasitic protozoa are known to vary markedly: in T. cruzi and T. b. brucei 2 FeSODs with a molecular weight of aproximately 22 and 24 kDa have been detected (Ismail et al. 1997; Kabiri & Steverding, 2001), similar to the molecular weight estimated in the present work for SODII. The literature provides no reference comparable to the SODI purified by us.
The 2 activity bands of SOD (SODI and SODII) could be 2 different isoenzymes, or else partially degraded forms of a single enzyme. However, this latter possibility is less likely, as, in the purification process, protease inhibitors were used. In addition, there are precedents, as in the case of T. b. brucei, that have 2 FeSODs of different molecular weight and, according to the state of the parasite, the activity levels can rise or fall towards one isoform or another – that is, one of the isoenzymes is constitutive and the other is induced (Kabiri & Steverding, 2001). Another explanation for the existence of 2 isoenzymes would be cellular compartmentalization, a characteristic of these organisms, the glycosomes. In the case of Phytomonas, the SODI and SODII activity is located primarily in the cytosol fraction, although SODII activity occus in the glycosome as well.
The different location of these 2 SODs becomes significant if we accept that the main role of the SODs is to detoxify superoxide ions, and that the different biological reactions, producers of oxidizing agents within the cell, may need various SODs to protect the different macromolecules and organelles from oxidative damage. This would explain the location of the SODII in the glycosomes.
SODII is synthesized possibly in the cytoplasm and transported to the interior of these organelles in a way similar to that of other glycosomal enzymes in T. b. brucei (Parsons et al. 2001). Thus, being important for the functioning of the glycosome and therefore for the survival of the organism, this enzyme would represent a chemotherapeutic target. This strategy of the enzyme SOD is completely accepted in the case of Leishmania spp., T. cruzi and T. b. brucei (Temperton, Wilkinson & Kelly, 1996; Paramchuk et al. 1997).
Several facets prompt interest in research on the presence of SOD activity in the glycosomes. First, there are no conclusive data available on the subcellular location of this enzyme. Second, certain functions that have been attributed to mammalian peroxisomes are related to the glycosomes of kinetoplastids (Hammond, Gutteridge & Opperdoes, 1981), but the similarity between these two microbodies with respect to the defence mechanisms against oxygen toxicity has still not been studied. Therefore, fuller knowledge of the cellular distribution of the channels of internalization of this enzyme could lead to a therapeutic approach, not only for the diseases caused by species belonging to the genus Phytomonas, but also for the strong similarity with other trypanosomatids, to which these principles could be extrapolated in the interest of human and animal health (Uttaro et al. 1999). This research will be continued with the aim of establishing the active role of glycosomal SOD in the survival of plant trypanosomatids.
In addition, in this study, we have used this enzyme to analyse 18 trypanosomatid isolates and the isoenzyme polymorphisms that occurred enabled us to classify the plant flagellates. We demonstrated that enzymatic activity (SOD) is sufficient to identify a trypanosomatid isolated from plants as belonging to the genus Phytomonas and to distinguish between a true Phytomonas and other trypanosomatids that are capable of provoking transient infections in plants.
To our knowledge this is the second biochemical marker that has proved specific for the genus Phytomonas. Until now it was possible to identify Phytomonas from other trypanosomatids using the enzyme isopropanol dehydrogenase (iPDH) (Uttaro et al. 1997). Both enzymes (iPDH and SOD) present a high degree of isoenzyme polymorphism on isoelectric focusing. The use of these 2 enzymes may be adequate not only to distinguish between the plant isolates on the one hand and all other trypanosomatids on the other hand, but also to classify the plant isolates into distinct groups that coincide with host distribution. We propose that when SOD is used in combination with iPDH these 2 enzyme activities may serve for the rapid identification of particular isolates and, together with other enzymes, be useful in future taxonomic studies of Phytomonas sp.
This work was supported by ‘ATP 2002/30: Circulation of Trypanosomatidae’ CIRAD (FRANCE) project.
References
REFERENCES
BÉCUWE, P.,
GRATEPANCHE, S.,
FOURMAUX, M. N.,
VAN BEEUMEN, J.,
SAMYN, B.,
MERCEREAU-PUIJALON, O.,
TOUZEL, J. P.,
SLOMIANNY, C.,
CAMUS, D. &
DIVE, D.
(
1996).
Characterization of iron-dependent endogenous superoxide dismutase of Plasmodium falciparum.
Molecular and Biochemical Parasitology
76, 125–134.CrossRefGoogle Scholar
BERGMEYER, H. U.
(
1974).
Methods of Enzymatic Analysis,
2nd Edn. Academic Press,
New York.
BEYER, W. F. &
FRIDOVICH, I.
(
1987).
Assaying for superoxide dismutase activity: some large consequences of minor changes in conditions.
Analytical Biochemistry
161, 559–566.CrossRefGoogle Scholar
BRADFORD, M. M.
(
1976).
A refined and sensitive method for the quantification of microgram quantities of protein-dye binding.
Analytical Biochemistry
72, 248.CrossRefGoogle Scholar
DOCAMPO, R.
(
1995).
Antioxidant mechanisms. In
Biochemistry and Molecular Biology of Parasites
(
ed. Marr, J. J. &
Müller, M.), pp. 147–160.
Academic Press, London.CrossRef
DOLLET, M.
(
1984).
Plant trypanosomes case study. In
Identification and Characterization of Pest Organisms
(
ed. Hawksworth, D. L.
), pp. 415–426.
CAB International.
DOLLET, M.,
LÓPEZ, G.,
GENTY, P. &
DZIDO, J. L.
(
1979).
Récherches actuelles de l'I.R.H.O. sur les dépérissements du cocotier et du palmier á huile en Amérique du Sud, associés aux protozoaires flagellés intraphloémiques (Phytomonas).
Oléagineux
34, 449–451.Google Scholar
FERNANDEZ-BECERRA, C.,
OSUNA, A.,
MULLER, E.,
DOLLET, M. &
SANCHEZ-MORENO, M.
(
1996).
Characterization of Phytomonas isolated from fruits by electrophoretic isoenzymes and kinetoplast-DNA analysis.
FEMS Microbiology Letters
145, 463–468.CrossRefGoogle Scholar
GUERRINI, F.,
SEGUR, S.,
GARGANI, D.,
TIBAYRENC, M. &
DOLLET, M.
(
1992).
An isoenzyme analysis of the genus Phytomonas: genetic, taxonomic and epidemiologic significance.
Journal of Protozoology
39, 516–521.CrossRefGoogle Scholar
HAMMOND, D. J.,
GUTTERIDGE, W. E. &
OPPERDOES, F. R.
(
1981).
A novel location for two enzymes of de novo pyrimidine biosynthesis in trypanosomes and leishmania.
FEBS Letters
128, 27–29.CrossRefGoogle Scholar
ISMAIL, S. O.,
SKEIKY, Y. A.,
BHATIA, A.,
OMARA-OPYENE, L. A. &
GEDAMU, L.
(
1994).
Molecular cloning, characterization, and expresión in E. coli of iron superoxide dismutase cDNA from Leishmania donovani chagasi.
Infection and Immunity
62, 657–664.Google Scholar
ISMAIL, S. O.,
PARAMCHUK, W.,
SKEIKY, Y. A.,
BHATIA, A.,
REED, S. G.,
BATHIA, A. &
GEDAMU, L.
(
1997).
Molecular cloning and characterization of two iron superoxide dismutase cDNAs from Trypanosoma cruzi.
Molecular and Biochemical Parasitology
86, 187–197.CrossRefGoogle Scholar
KABIRI, M. &
STEVERDING, D.
(
2001).
Identification of a developmentally regulated iron superoxide dismutase of Trypanosome brucei.
Journal of Biochemistry
360, 173–177.Google Scholar
LIOCHEV, S. I. &
FRIDOVICH, I.
(
1997).
Lucigenin luminescence as a measure of intracellular superoxide dismutase in Escherichia coli.
Proceedings of the National Academy of Sciences, USA
94, 2891–2896.CrossRefGoogle Scholar
MARÍN, C.,
FERNÁNDEZ-RAMOS, C.,
QUESADA, J. M.,
ENTRALA, E. &
SÁNCHEZ-MORENO, M. (
2000).
Biochemical characterization of a trypanosomatid isolated from the plant Amaranthus retroflexus.
Memorias do Instituto Oswaldo Cruz
95, 641–647.CrossRefGoogle Scholar
MENARA, A.,
DOLLET, M.,
GARGANI, D. &
LOUISE, C.
(
1988).
Culture in vitro sur cellules d'invertébrés des Phytomonas sp. (Trypanosomatidae) associés au hartrot, maladie du cocotier.
Comptes Rendus de l'Académie des Sciences, Paris, série III
307, 597–602.Google Scholar
MIRALLES, D.,
MARÍN, C.,
MAGÁN, R.,
FERNÁNDEZ-RAMOS, C.,
ENTRALA, E.,
CORDOVA, O.,
VARGAS, F. &
SÁNCHEZ-MORENO, M.
(
2002).
In vitro culture and biochemical characterization of six trypanosome isolates from Peru and Brazil.
Experimental Parasitology
102, 23–29.CrossRefGoogle Scholar
PAOLETTI, F. &
MOCALI, A.
(
1990).
Determination of superoxide dismutase activity by purely chemical system based on NAD(P)H oxidation.
Methods in Enzymology.
186, 209–265.CrossRefGoogle Scholar
PARAMCHUCK, W. J.,
ISMAIL, S. O.,
BHATIA, A. &
GEDAMU, L.
(
1997).
Cloning, characterization and overexpression of two iron superoxide dismutase cDNAs from Leishmania chagasi: role in pathogenesis.
Molecular and Biochemical Parasitology
90, 203–221.Google Scholar
PARSONS, M.,
FURUYA, T.,
PAL, S. &
KESSLER, P.
(
2001).
Biogenesis and function of peroxisomes and glycosomes.
Molecular and Biochemical Parasitology
115, 19–28.CrossRefGoogle Scholar
PODLIPAEV, S.
(
2001).
The more insect trypanosomatids under study-the more diverse Trypanosomatidae appears.
International Journal for Parasitology
31, 648–652.CrossRefGoogle Scholar
QUESADA, J. M.,
ENTRALA, E.,
FERNÁNDEZ-RAMOS, C.,
MARÍN, C. &
SÁNCHEZ-MORENO, M. (
2001).
Phytomonas spp.: superoxide dismutase in plant trypanosomes.
Molecular and Biochemical Parasitology
115, 123–127.CrossRefGoogle Scholar
SÁNCHEZ-MORENO, M.,
FERNÁNDEZ-BECERRA, C.,
FERNÁNDEZ-RAMOS, C.,
LUQUE, F.,
RODRIGUEZ-CABEZAS, M. N.,
DOLLET, M. &
OSUNA, A.
(
1998).
Trypanosomatid protozoa in plants of southern Spain: characterization by analysis of isoenzymes, kinetoplast DNA, and metabolic behavior.
Parasitology Research
84, 354–361.CrossRefGoogle Scholar
SANCHEZ-MORENO, M.,
FERNANDEZ-BECERRA, C.,
MASCARO, C.,
ROSALES, M. J.,
DOLLET, M. &
OSUNA, A.
(
1995).
Isolation, in vitro culture, ultrastructure study and characterization by lectin-agglutination tests of Phytomonas isolated from tomatoes (Lycopersicon esculentum) and cherimoyas (Annona cherimolia) in southeastern Spain.
Parasitology Research
81, 575–581.CrossRefGoogle Scholar
STEIGER, R. F.,
OPPERDOES, F. R. &
BONTEMPS, J.
(
1980).
Subcellular fractionation of Trypanosoma brucei blood-stream forms with special reference to hydrolases.
European Journal of Biochemistry
105, 163–175.CrossRefGoogle Scholar
TEMPERTON, N. J.,
WILKINSON, S. R. &
KELLY, J. M.
(
1996).
Cloning of an Fe-superoxide dismutase gene homologue from Trypanosoma cruzi.
Molecular and Biochemical Parasitology
76, 339–343.CrossRefGoogle Scholar
TEIXEIRA, M. M. G.,
SERRANO, M. G.,
NUNES, L. R.,
CAMPANER, M.,
BUCK, G. A. &
CAMARGO, E. P.
(
1996).
Trypanosomatidae: a spliced-leader-derived probe specific for the genus Phytomonas.
Experimental Parasitology
84, 311–319.CrossRefGoogle Scholar
UTTARO, A. D.,
MIRKIN, N.,
RIDER, M. H.,
MICHELS, P. A. M. &
OPPERDOES, F. R.
(
1999).
Phytomonas sp. as a model of Trypanosomatid metabolism and drug.
Memorias do Instituto Oswaldo Cruz
94 (Suppl. II), C19.Google Scholar
UTTARO, A. D.,
SÁNCHEZ-MORENO, M. &
OPPERDOES, F. R.
(
1997).
Genus-specific biochemical markers for Phytomonas spp.
Molecular and Biochemical Parasitology
90, 337–342.CrossRefGoogle Scholar
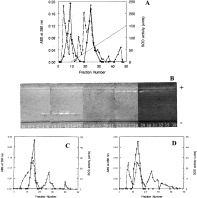
Fig. 1. Purification profiles of SODs from Phytomonas isolates from Euphorbia characias. (A) QAE-Sephadex ion-exchange chromatography. (B) Isoelectric focusing gel electrophoresis pI 3-9 of the fractions eluted by QAE-Sephadex, the SOD activity was stained following the protocol of Beyer & Fridovich (1987). (C) Sephadex G-75 molecular sieve chromatography of SODI. (D) Sephadex G-75 molecular sieve chromatography of SODII. (-[utrif ]-, -+-) Protein concentration; (-□-) SOD activity (——) gradient 0–0·6 M KCl.
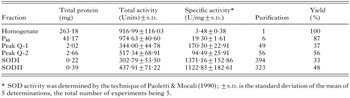
Table 1. Purification of the SOD of Phytomonas isolated from Euphorbia characias

Fig. 2. Electrophoresis of the purified enzymes. (A) Native gel electrophoresis, stained by silver nitrate. (B) Activity staining in native electrophoresis. (C) Isoelectric focusing gel stained according to the protocol of Beyer & Fridovich (1987). Lane 1, SODI (2 μg); lane 2, SODII (2 μg). MW, molecular weight marker proteins; MpI, isoelectric point marker.

Fig. 3. Determination of the metal cofactor of Phytomonas isolates from Euphorbia characias SODs by inhibition studies performed in isoelectric focusing gel electrophoresis. Lane 1 purified SOD (fraction P85) only; lane 2 with 20 mM KCN; lane 3 with 5 mM H2O2.
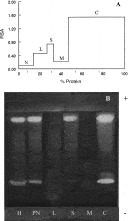
Fig. 4. Distribution profile of SOD activity in the fractions from the differential centrifugation. (A) SOD activity was determined in the different fractions according to the method of Paoletti & Mocali (1990). The relative specific activity (RSA), ratio between the percentage of total activity and percentage of total protein for each fraction (Y-axis) is plotted against the cumulative percentage of protein (X-axis). (B) Activity staining by isoelectric focusing. H, homogenate; PN, postnuclear fraction; N, nuclear; L, large organelle fraction; S, small organelle fraction; M, microsomal; C, cytoplasmic fraction.
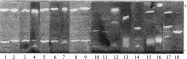
Fig. 5. IEF 3-9. Activity of SOD as determined by the method of Beyer & Fridovich (1987). (1) Phytomonas hartrot, (2) Phytomonas isolated from Euphorbia pinea, (3) Phytomonas isolated from Euphorbia characias, (4) Phytomonas isolated from Trifolium spp., (5) Phytomonas serpens, (6) Phytomonas isolated from Lycopersicum esculentum de Brazil, (7) Phytomonas isolated from Lycopersicum esculentum from Spain, (8) Phytomonas isolated from Fabrictilis gonagra, (9) Phytomonas isolated from Veneza zonata, (10) Herpetomonas samuelpessoai, (11) Herpetomonas davidi, (12) Phytomonas isolated from Mangifera indica, (13) Trypanosoma cruzi strain maracay, (14) Trypanosoma isolated from a human from Brazil, (15) Trypanosoma cruzi isolated from Peru, (16) Leishmania donovani, (17) Crithidia luciliae, (18) Leptomononas collosoma.
 You have
Access
- 4
- Cited by