


INTRODUCTION
Mal de Río Cuarto (MRC) disease, which was found to be associated with reovirus-like particles early in the 1980s (Nome et al. Reference Nome, Lenardón, Raju, Laguna, Lowe and Docampo1981), has become a significant disease problem in maize in several regions of Argentina. The worst epidemic of MRC occurred during 1996/97 and 2006/07, causing great economic losses. In 1997, the epidemic affected 300 000 ha with estimated losses of US$120 million (Lenardón et al. Reference Lenardón, March, Nome and Ornaghi1998).
The MRC virus (MRCV) cytopathology has similarities with other viruses from the genus Fijivirus, family Reoviridae (Arneodo et al. Reference Arneodo, Lorenzo, Laguna, Abdala and Truol2002). The reovirus is naturally transmitted in a persistent, propagative manner by the planthopper Delphacodes kuscheli Fennah (Homoptera: Delphacidae) (Ornaghi et al. Reference Ornaghi, Boito, Sanchez, March and Beviacqua1993). Vector transmission complicates the disease epidemiology: MRC epidemics occur when large populations of D. kuscheli migrate from winter cereals to the emerging maize crop. Early planting has been used to avoid peak vector populations during the highly susceptible coleoptile stage (Ornaghi et al. Reference Ornaghi, March, Boito, Marinelli, Beviacqua, Giuggia and Lenardón1999). Studies of the spatial pattern of the virus vector can provide relevant information to develop programmes for monitoring the vector abundance and epidemiology of MRC (Garat et al. Reference Garat, Trumper, Gorla and Perez-Harguindeguy1999). Applications of systemic insecticides and removing of weedy gramineae, which constitute vectors and virus reservoirs, can reduce the disease. However, the most economical, environmentally sustainable and effective means for controlling viral diseases is to deploy resistant germplasm.
Assessing MRC severity in the field is difficult. Breeding for resistance has been hampered by the obligate transmission of MRCV by the planthopper, and by environment-to-environment fluctuations in viral disease pressure. Field inoculations in the Río Cuarto region, where the disease is endemic, were used to partially overcome these difficulties. Previous studies in an early-generation F2:3 (Di Renzo et al. Reference Di Renzo, Bonamico, Diaz, Salerno, Ibañez and Gesumaria2002; Kreff et al. Reference Kreff, Pacheco, Díaz, Robredo, Puécher, Céliz and Salerno2006) demonstrated that resistance to MRC is a quantitative trait that involves a relatively small number of genes. The type of action of the MRC resistance genes ranged from partial dominance to additivity and the heritability estimates were moderate (Presello et al. Reference Presello, Céliz, Frutos, Avila and Céspedes-P1995; Di Renzo et al. Reference Di Renzo, Bonamico, Diaz, Salerno, Ibañez and Gesumaria2002). The progress in breeding for MRC resistance using traditional methods can be slow because of strong environmental effects, the high cost of field evaluations and the few resistance sources available. Marker assisted selection (MAS) has been proved to increase the rate of genetic gain significantly when compared with conventional breeding and thus would help to alleviate some of these problems. Mendelian genetics applied to crops has had a major impact on crop improvement, including breeding for disease and pest resistance. Traditional genetic approaches, however, are labour intensive and time consuming. The advent of molecular genetics provided new opportunities for mapping and tracking genes of agronomic interest, leading to more efficient marker-assisted selection (Lucas Reference Lucas2010). The development of DNA-based markers provides a powerful alternative method for the dissection of complex traits, including reaction to MRC in maize. The identification and mapping of quantitative trait loci (QTL) associated with virus resistance in maize have been reviewed by Redinbaugh et al. (Reference Redinbaugh, Jones and Gingery2004) and Redinbaugh & Pratt (Reference Redinbaugh, Pratt, Bennetzen and Hake2009).
In a previous study, DNA markers linked to genes governing MRC resistance were identified with F2:3 lines using traditional QTL mapping (Di Renzo et al. Reference Di Renzo, Bonamico, Diaz, Ibanez, Faricelli, Balzarini and Salerno2004; Kreff et al. Reference Kreff, Pacheco, Díaz, Robredo, Puécher, Céliz and Salerno2006) and with recombinant inbred lines (RILs) using discriminate analysis (Bonamico et al. Reference Bonamico, Balzarini, Arroyo, Ibañez, Díaz, Salerno and Di Renzo2010). Because of the complex genetic nature of MRC disease, the identification of QTL for resistance is not always consistent. Therefore, validation of these QTL for reaction to MRC (MRC-QTL) is important before implementing marker-assisted selection. The RIL population used in the present study was derived from the F2:3 population mentioned above (Di Renzo et al. Reference Di Renzo, Bonamico, Diaz, Ibanez, Faricelli, Balzarini and Salerno2004). Comparisons between the two different populations should allow comparison of the regions associated with MRC reaction detected in early and late selfing generations. Despite the inability to measure dominance effects of QTL, RILs are efficient and powerful tools for QTL detection because of the increased homozygosity and augmented recombination. The main purpose of the present study was to map MRC-QTL from a RIL population.
MATERIALS AND METHODS
Plant materials
Two homozygous inbred lines, BLS14 and Mo17, were used as the parental material. The resistant parent BLS14, a flint maize line, was selected from selfed plants of the open-pollinated, locally adapted, Argentine cultivar ‘Colorado La Holandesa’. Mo17, an American dent maize inbred line derived from the Lancaster Sure Crop population, was the susceptible parent. Mean yield of Mo17 is half that of the resistant parent. A total of 145 RILs derived from a BLS14×Mo17 cross were developed by self-pollinating a random sample of F2 plants through single seed descent method until the F2:6 generations. RIL families together with the parents, used as controls, were evaluated for reaction to the endemic MRC disease in the temperate semi-arid crop region of Argentina at four field environments. The field trials were carried out during two growing seasons, at Río Cuarto (64°20′W, 33°8′S, 334 m asl) and Sampacho (64°42′W, 33°19′S, 510 m asl), Argentina. Each location–season combination was used to define four environments: Río Cuarto 2005 (R5) and 2006 (R6), and Sampacho 2004 (S4) and 2005 (S5). The parents and RILs were grown under natural infection in the four environments. The experimental design at each environment was a randomized complete block design with two replications of single-row plot 0·70 m apart and 4 m long. Plants were thinned to a distance of 0·20 m and weeds were controlled with herbicides. Hand weeding was performed as necessary in all plots. Each trial was conducted under natural infection establishing the plots where the preceding crop was winter oat, which constitutes a vector and virus reservoir.
Description of variables
A total of 15 plants in the central rows of each plot were individually evaluated for symptoms at initial male flowering (2 months after planting). The plants at the end of each plot were not rated, to avoid possible border effects. Symptoms were measured visually on each plant using a scale based on the rating system proposed by Ornaghi et al. (Reference Ornaghi, March, Boito, Marinelli, Beviacqua, Giuggia and Lenardón1999): 0=no symptoms; 1=mild symptoms; 2=severe symptoms; 3=maximal development of the MRC disease. This rating allowed quantification of the reaction to MRC by means of three variables on a family-mean basis. Such variables are disease score (SCO) or mean rating of all plants in the family, disease incidence (INC) or proportion of plants presenting symptoms, and disease severity (SEV) or mean SCO of the plants presenting symptoms.
Data analysis
The experimental data were analysed for each variable (SCO, INC and SEV) by ANOVA using the MIXED procedure of SAS software (SAS Institute 2002). On a family-mean basis, the total phenotypic variation was partitioned as follows:

where Y is the response variable, μ is the overall mean, E is the environmental effect, B(E) is the block within environment effect, G is the genotype (RIL) effect, G×E is the genotype by environment interaction effect, and e is an error term. G and G×E terms were regarded as random and the other model terms as fixed. Restricted maximum likelihood (REML) was considered for estimating genotypic (σ g 2), G×E interaction (σ ge 2) and error (σ e 2) variance components. The Shapiro–Wilks test (Shapiro & Francia Reference Shapiro and Francia1972) was used to check the normality of the residual distributions. Further logarithmic transformations were required for SCO and SEV. Broad sense heritability (h 2) estimates on a family-mean basis were assessed for each environment and across the four environments according to Hallauer & Miranda (Reference Hallauer and Miranda1981). Exact 95% confidence intervals of h 2 were calculated from Knapp et al. (Reference Knapp, Stroup and Ross1985). Spearman (rank) correlation coefficients (r s) were calculated for each pair of variables at each environment and for each variable to correlate line rankings in different environments (Yan & Rajcan Reference Yan and Rajcan2003).
A mixed-model approach was used for assessment of RIL and parental genotypic effects, regarded as random and fixed, respectively. The means of best linear unbiased predictions (BLUP) of random RIL effects at each environment were compared with the parental means at the same environment by means of t test (P⩽0·05).
Population genotyping and marker linkage analysis
DNA was extracted from healthy leaves in order to determine the simple sequence repeat (SSR) genotype of a mapping population of 145 RIL families and parents for MRC-QTL detection. Tissue from leaf samples were lyophilized and ground to a fine powder. The isolation of total DNA was performed following the procedures described by Saghai-Maroof et al. (Reference Saghai-Maroof, Soliman, Jorgensen and Allard1984). DNA was quantified using the spectrophotometric readings at A 260 and A 280, and concentration was calculated according to Sambrook et al. (Reference Sambrook, Fritsch and Maniatis1989). A total of 140 SSR primer pairs, whose sequences were downloaded from the MaizeGDB website (http://www.maizegdb.org; verified 9 November 2011) and synthesized by Alpha DNA (http://www.alphadna.com; verified 9 November 2011), were screened for useful polymorphisms. Primers that were polymorphic in the parental inbred lines BLS14 and Mo17 were chosen as markers and used for testing against the whole population. Prior to linkage analysis, a chi-square analysis was performed for each RIL marker locus segregation ratios (1:1 for RIL). A linkage map was constructed using the program MapMaker/EXP 3.0 (Lander et al. Reference Lander, Green, Abrahamson, Barlow, Daly, Lincoln and Newburg1987). Recombinant frequencies between marker loci were estimated by a multi-point analysis that was performed by the ‘order’ command, and transformed into map distances (centimorgans: cM) by using the Kosambi mapping function. For declaration of significant linkage between two markers, a log10 likelihood of the odds (LOD) threshold of 3·0 and maximum distance of 30 cM was used.
Data analysis and QTL mapping
The position and effect of MRC-QTL were estimated for each variable by environment and across environments. Analyses were performed on RIL data averaged across replicates and BLUP values of the 145 families. For mapping QTL, the methods of single interval mapping (SIM) and composite interval mapping (CIM) were employed using PlabQTL software (Utz & Melchinger Reference Utz and Melchinger1996). Cofactor markers for CIM were selected by stepwise regression with the ‘cov’ statement in the PlabQTL software with a (LOD) score >3·0 to enter into the model.
The map was scanned at 5 cM intervals between markers and QTL controlling MRC resistance. The location of regions associated with MRC reaction corresponded to the location of peak LOD scores in the scan of the corresponding chromosome. QTL, which were designated by the corresponding chromosome bin in which they were found, are reported in relation to the nearest marker of the LOD score peak. QTL regions detected with a LOD score >2·5 were identified as significant and those with a LOD score between 2·0 and 2·5 were regarded as suggestive. Bin locations are designated by an X.Y code, where X is the linkage group containing the bin and Y is the location of the bin within the linkage group. The multiple regression method implemented in PlabQTL software was used to determine the significance of additive×additive epistatic interactions between QTL found to contribute to RIL data averages or BLUPs (Utz & Melchinger Reference Utz and Melchinger1996). The total phenotypic variance explained by a single QTL of each variable was estimated by the square of the partial correlation coefficient.
RESULTS
Field variable analysis
Across environments, the resistant parent BLS14 showed a high but not complete resistance to MRC and the susceptible parent Mo17 showed heavy symptoms (Table 1). No heterogeneity of error variance was detected across environments for the log transformed data of SCO and SEV variables.
Means (±s.e.) of disease assessment variables of parents BLS14 and Mo17 and of a derived mapping population of 145 RIL families; significance of the fixed effect environment and estimates of the variance components and heritabilities with RIL data for three analysed variables across four evaluation environments

* Disease assessment. SCO, disease score; INC, disease incidence; SEV, disease severity. For SCO and SEV, the results presented refer to the data obtained by logarithmic transformation.
† σ g 2, σ ge 2, σ e 2 are estimates of the variances between RIL families, of G×E interaction and within families, respectively. h 2 is the broad-sense heritability on a family-mean basis.
CI, confidence interval.
The estimated genetic variance component revealed the existence of significant differences (P<0·01) in MRC reaction between RIL families (σ g 2) for all disease variables. Heritability estimates at each environment were very high for the variables SCO and INC, which ranged from 0·71 to 0·92, and intermediate to low for the SEV variable, which ranged from 0·12 to 0·53. Across environments (Table 1), the variance due to G×E interaction (σ ge 2) was significant (P<0·01) and larger than the genotypic variance (σ g 2) for the three variables. Low heritability estimates were found averaged over all environments for SCO (0·21), INC (0·27) and SEV (0·20).
Table 2 shows Spearman correlation coefficients between the RIL rankings in different environments. Since coefficients were low (<0·40), it was concluded that the G×E interaction, for all variables, was mostly due to RIL rank changes between environments. Such environment differences in rank of RIL families between environments, as well as high G×E variance, probably reflect the complications of evaluating MRC disease, i.e. the screening process and the effect of environment on the expression of resistance.
Spearman (rank) correlation coefficients estimated between four evaluation environments with a 145 RIL families derived from the cross BLS14×Mo17, for three analysed variables
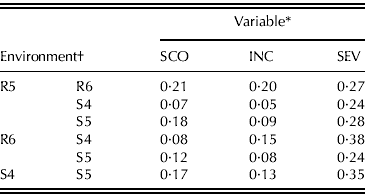
* Disease assessment. SCO: disease score; INC: disease incidence; SEV: disease severity.
† Location-season combination, R5: Río Cuarto 2005; R6: Río Cuarto 2006; S4: Sampacho 2004; S5: Sampacho 2005.
Phenotypic (r p) linear correlations between variables in each of the four environments were positive and highly significant (P<0·01) (Table 3). Coefficients of correlations between SCO and INC were higher than 0·90, thus only the results for INC are presented here.
Phenotypic correlation coefficients for pair-wise comparisons for three analysed variables, estimated at four evaluation environments with 145 RIL families derived from the cross BLS14×Mo17
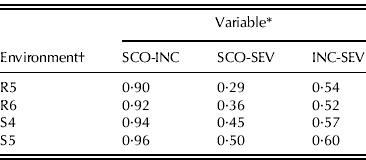
* Disease assessment. SCO: disease score; INC: disease incidence; SEV: disease severity.
† Location–season combination, R5: Río Cuarto 2005; R6: Río Cuarto 2006; S4: Sampacho 2004; S5: Sampacho 2005.
Best linear unbiased estimation (BLUE) values of the parental lines (BLS14 and Mo17) are compared with BLUPs of the RILs for INC and SEV at each environment in Table 4. For both variables, the BLUE values of parental lines were significantly different (P<0·05) to the expected BLUP of the RIL families, indicating that the parental reaction to MRC deviated from the population average, except for the parental line Mo17 for INC and SEV in the S4 environment. Transgressive segregation was not indicated, because only a small portion of RIL fell outside the range of the parental values.
Disease incidence and severity of MRC. BLUP of RIL families and BLUE of BLS14 and Mo17 parents with probability values for the hypothesis of no differences between RIL and the parental in four evaluation environments
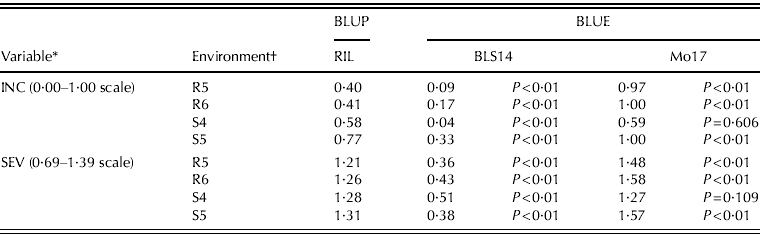
* Disease assessment. INC, disease incidence; SEV, disease severity.
† Location–season combination, R5: Río Cuarto 2005; R6: Río Cuarto 2006; S4: Sampacho 2004; S5: Sampacho 2005.
QTL analysis
Of the 140 SSR loci, 66 (0·47) were found to be polymorphic and 58 markers, with good amplification profile and even coverage of the genome, were employed for genotyping the entire RIL mapping population. Genotypic classes of 12 loci deviated from the expected Mendelian ratios (1:1). Markers were anchored on the linkage groups on the basis of their known locations. Linkage analysis resulted in a genetic maize map consisting of eight linkage groups and two unlinked markers. These linkage groups covered a genetic distance of c. 1019 cM of the maize genome, with 0·75 of the intervals between markers being near to 20 cM. The order of SSR markers in the map was in good agreement with their bins on the chromosomes of maize (MaizeGDB website http://www.maizegdb.org).
The chromosomal locations of markers for the QTL analysis across environments for both RIL data averages and BLUP values, such as the effect of each QTL, are presented in Table 5. Four MRC-QTL detected as significant with a LOD score >2·5 were located on chromosomes 1 (bins 1·01 and 1·06), 4 (bin 4·08) and 10 (bin 10·02). All four QTL regions were identified by the CIM method, employing four cofactor markers for INC and two for SEV. Two of these significant regions associated with MRC reaction were also identified using the SIM model. For the INC variable, the additive effects of QTL found on bins 1·01 and 1·06 were statistically significant and accounted for up to 0·08 and 0·13 of the phenotypic variation, respectively. These two QTL regions with significant additive effect were associated with alleles for MRC resistance. The QTL regions on bin 4·08 with significant additive effect were associated with alleles for MRC susceptibility which came from the resistant parent. For the SEV variable, QTL mapped to genetic bins 1·01 and 10·02 significantly contributed to variation for up to 0·06 and 0·14 of the phenotypic variation, respectively. QTL detected in bin 1·01 with significant additive effect, was associated with alleles for MRC resistance from BLS14. QTL detected in bin 10·02 did not have a statistically significant additive effect and thus, with uncertainty about the sign of the additive effect, were associated with alleles for susceptibility that probably originated from BLS14.
Parameter estimates associated with QTL for INC and severity to MRC, in a mapping population of 145 RIL families derived from the cross BLS14×Mo17, across four evaluation environments
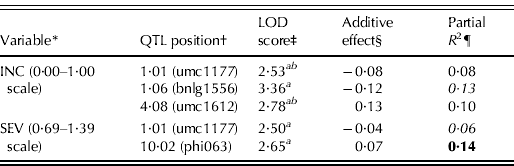
* Disease assessment. INC: disease incidence; SEV: disease severity.
† Chromosomal location: bin and nearest marker.
‡ Likelihood of odds (LOD) score. a and b QTL detected using CIM and using SIM, respectively.
§ Additive effect of the QTL. A negative value of additive effects reflects that parent BLS14 contributed QTL alleles increasing resistance.
¶ Phenotypic variation explained by the QTL. Bold type indicates QTL was only detected using BLUP values, italics indicate QTL was found using only RIL data averages. All other QTL were found using both RIL data averages and BLUP values.
Significant digenic epistatic (additive×additive) interactions among the detected regions associated with MRC reaction were found between QTL mapped to genetic bins 1·01 and 4·08 for the INC variable. QTL mapped to chromosome bins 1·06 and 4·08 appeared to be specific for the INC variable, and the QTL in bin 10·02 appeared to contribute preferentially to the SEV variability. The global test for QTL×E was not significant (P>0·05) for the four QTL mapped across environments, suggesting stability of QTL effects.
Table 6 shows that for the QTL mapped by environments, the range of phenotypic variation explained using both RIL data averages and BLUP values by all significant and suggestive QTL regions for each variable varied from 0·06 to 0·16. In addition to the three significant MRC-QTL identified across environments for the INC variable, three suggestive QTL regions with a LOD score between 2 and 2·5 were detected on chromosomes 1 (bins 1·04) and 4 (bins 4·03 and 4·05), and two QTL regions with a LOD >2·5 were located on chromosomes 8 (bins 8·03 and 8·08). In addition to the two significant MRC-QTL identified across environments for the SEV variable, four suggestive QTL regions were detected on chromosomes 1 (bin 1·02), 4 (bins 4·03 and 4·05) and 8 (bin 8·3), and five significant QTL regions were located on chromosomes 1 (bins 1·03 and 1·04), 6 (bin 6·02), 8 (bin 8·08) and 10 (10·02).
Parameter estimates associated with QTL for disease incidence and severity to MRC, in a mapping population of 145 RIL families derived from the cross BLS14×Mo17, in four environments

* Disease assessment. INC, disease incidence; SEV, disease severity.
† Chromosomal location: bin and nearest marker.
‡ Location-season combination, R5: Río Cuarto 2005; R6: Río Cuarto 2006; S4: Sampacho 2004; S5: Sampacho 2005.
§ Likelihood of odds (LOD) score. a and b QTL detected using CIM and using SIM, respectively.
¶ Additive effect of the QTL. A negative value of additive effects reflects that parent BLS14 contributed QTL alleles increasing resistance.
# Phenotypic variation explained by the QTL. Bold type indicates QTL was only detected using BLUP values, italics indicate QTL was found using only RIL data averages. All other QTL were found using both RIL data averages and BLUP values.
The QTL regions detected on chromosome 1 (bin 1·01) accounted for variation of both variables in S4 and across environments. The QTL mapped to bin 1·06 detected in R6, S4 and across environments, and the QTL mapped on chromosome 10 (10·02) in R6 and across environments were found to be exclusively involved in the INC and SEV variation, respectively. The SSR markers identified across environments that can be used to select for MRC resistance in maize are shown in Fig. 1.
Genetic map constructed with microsatellite markers, based on 145 RIL families derived from the cross BLS14×Mo17. The name of each marker is identified on the right side of each chromosome (C1, C2, C3, C4, C6, C8, C9 and C10); their lengths in centimorgans (cM) are shown on the left. The position of the QTL identified across environments for INC and SEV variables is presented in the figure with ○ and ●, respectively.

DISCUSSION
The present results are consistent with previous reports about the quantitative inheritance of MRC resistance (Presello et al. Reference Presello, Céliz, Frutos, Avila and Céspedes-P1995; Di Renzo et al. Reference Di Renzo, Bonamico, Diaz, Salerno, Ibañez and Gesumaria2002; Kreff et al. Reference Kreff, Pacheco, Díaz, Robredo, Puécher, Céliz and Salerno2006), suggesting an oligogenic or polygenic genetic control with low to moderate heritability. The inconsistency of the resistance phenotype was demonstrated by a high G×E interaction variance and low correlations between data collected in different environments, resulting in a low heritability across environments. Interactions among a competent vector, a virulent pathogen, a susceptible host and a suitable environment are necessary for disease development (Redinbaugh & Pratt Reference Redinbaugh, Pratt, Bennetzen and Hake2009; Lucas Reference Lucas2010).
Previous inheritance studies of reaction to MRC have shown the importance of additive and non-additive genetic effects (Presello et al. Reference Presello, Céliz, Frutos, Avila and Céspedes-P1995; Di Renzo et al. Reference Di Renzo, Bonamico, Diaz, Ibanez, Faricelli, Balzarini and Salerno2004; Kreff et al. Reference Kreff, Pacheco, Díaz, Robredo, Puécher, Céliz and Salerno2006). Since the regions associated with MRC reaction were mapped using homozygous RILs in the present study, only the additive and additive×additive effects were estimated. The current results suggest the presence of significant digenic epistatic interactions. Little evidence for epistatic interactions has been observed in other QTL mapping studies in maize (Berke & Rocheford Reference Berke and Rocheford1999). A small proportion of the progeny showed BLUPs larger than the susceptible parent. Such a small amount of transgressive segregation could be explained by environmental effects or by experimental errors rather than by the recombination of complementary QTL.
The use of RIL integrated with the known genomic positions of SSR markers proved to be highly efficient for QTL mapping. The SSR markers were deliberately chosen to cover the genome uniformly. The map used in the present study could be improved by increasing the marker density that would enable phenotypic variance for MRC reaction to be more fully explained in these maize genotypes. The resultant map, despite being incomplete, facilitated the mapping of MRC-QTL in the RILs population.
Analyses across environments by the CIM model resulted in the detection of two additional MRC-QTL. Using CIM models with cofactor markers appears to increase the power of QTL detection compared with SIM analysis (Jansen & Stam Reference Jansen and Stam1994; Zeng Reference Zeng1994). Interval SIM and/or CIM mapping has revealed two QTL regions on two chromosomes that affect the MRC incidence.
The small numbers of mapped major genes reveal the relatively low importance of major genes controlling field disease in maize (Wisser et al. Reference Wisser, Balint-Kurti and Nelson2006). In the present study, four significant QTL contributing to MRC reaction, mapped on chromosomes 1, 4 and 10, explained 0·06–0·14 of the total phenotypic variation, for both INC and severity. Further, QTL need to be detected for resistance gene-deployment or pyramiding effective strategies against MRC disease in maize regional breeding programmes.
Genes and QTL regions conferring resistance to various pathogens, such as fungi, bacteria and viruses often reside in clusters rather than being equally distributed on maize chromosomes (McMullen & Simcox Reference McMullen and Simcox1995; Redinbaugh et al. Reference Redinbaugh, Jones and Gingery2004; Wang et al. Reference Wang, Chen, Zhao, Li, Korban, Wang, Li, Dai and Xu2007; Redinbaugh & Pratt Reference Redinbaugh, Pratt, Bennetzen and Hake2009). Some regions associated with MRC reaction in the present QTL analyses may be compared with previously mapped disease and pest resistant loci. On bin 1·04/05, where an MRC-QTL linked to marker bnlg1811 for INC and SEV was mapped, three major QTL conferring resistance to maize streak virus and grey leaf spot have been previously identified (Bubeck et al. Reference Bubeck, Goodman, Beavis and Grant1993; Welz et al. Reference Welz, Schechert, Pernet, Pixley and Geiger1998; Pernet et al. Reference Pernet, Hoisington, Franco, Isnard, Jewell, Jiang, Marchand, Reynaud, Glaszmann and González de León1999a , Reference Pernet, Hoisington, Dintinger, Jewell, Jiang, Khairallah, Letourmy, Marchand, Glaszmann and González de León b ). Also, a MRC-resistant QTL on bin 4·02/03 linked to marker phi021 was found, and four QTL conferring resistance to grey leaf spot, southern corn rust and northern corn leaf blight have been mapped at the same position (Hoisington Reference Hoisington1989; Bubeck et al. Reference Bubeck, Goodman, Beavis and Grant1993; Chen et al. Reference Chen, Wang, Yang, Ye, Zhao, Jin, Weng and Wang2004). On chromosome bins 1·01 and 1·02, where two suggestive MRC-QTL linked to marker umc1177 and bnlg1627 were mapped, one major QTL conferring resistance to northern corn leaf blight was previously identified by Hoisington (Reference Hoisington1989).
As the variables INC and SEV were not determined by the same set of genetic factors, it is possible to infer that different sets of QTL may be involved in different resistance mechanisms to MRC disease. Some authors (Pernet et al. Reference Pernet, Hoisington, Franco, Isnard, Jewell, Jiang, Marchand, Reynaud, Glaszmann and González de León1999 b; Dintinger et al. Reference Dintinger, Verger, Caiveau, Risterucci, Gilles, Chiroleu, Courtois, Reynaud and Hamon2005) have argued that specific QTL to the INC in maize may be involved in several defence mechanisms that hamper the invasion of the plant by the virus, and that QTL related to the SEV may be involved in some resistance mechanisms affecting the virus multiplication rate in the plant.
In spite of the high interaction variance, no significant QTL×E interaction was observed for the four significant MRC-QTL identified in the present study.
By comparing the present results against those previously reported for MRC SEV in an early generation (Di Renzo et al. Reference Di Renzo, Bonamico, Diaz, Ibanez, Faricelli, Balzarini and Salerno2004), it was possible to contrast QTL detected in early and late selfing generations, and to demonstrate the advantage of RILs over F2:3 lines for QTL analysis. More QTL regions were detected in the RIL population than in the F2:3 lines. However, three putative QTL placed in the bins 1·03, 1·04 and 8·03 were detected in the same genomic regions in the RIL families and in the F2:3 lines. The agreement of findings between these two generations may be considered an indication of the existence of these QTL and may encourage the undertaking of more intensive research on these regions. In contrast, selection of a subset of RILs (e.g. genetic drift), loss of alleles during the development of RILs by insufficient population size, or natural selection can be associated with lack of consistency across generations. Other mapping studies have reported results in which few QTL were validated in different generations (Cardinal et al. Reference Cardinal, Lee, Sharopova, Woodman-Clikeman and Long2001).
Although the relative efficiency of MAS in comparison with phenotypic selection is close to 1 for the studied trait (Di Renzo et al. Reference Di Renzo, Bonamico, Diaz, Ibanez, Faricelli, Balzarini and Salerno2004), the mapped MRC-QTL could improve the breeding efficiency in resistance to MRC disease since the plants can be selected at a young age. Moreover, experiments involving planthopper vectors could be avoided and environmental effects controlled. Considering the high costs and technology input, only regions associated with MRC reaction consistently expressed across environments and different genetic backgrounds can be recommended for use in MAS.
As stated by Hogenhout et al. (Reference Hogenhout, El-Desouky, Whitfield and Redinbaugh2008) plant virus diseases may well increase in the future. In an increasingly unstable climate, which will have profound effects on virus vectors, pyramiding disease resistance genes from different sources of germplasm will allow provision of a more rapid response in the delivery of resistance and elevate the effectiveness by increasing the long-term stability of resistance (Lucas Reference Lucas2010). This approach, in combination with an integrated management, will help to set criteria for sustainable control of MRC in maize. The present study suggests that an increase of alleles controlling MRC resistance could be accomplished using a biparental recurrent selection scheme aided by MAS, and molecular markers associated with environmentally independent MRC-resistant QTL.
The authors would like to acknowledge the help of Ingrid Teich for improvements in the language editing. This work was supported by grants from Agencia Nacional de Promoción Científica y Tecnológica, PICT-02231/07-BID; Agencia Córdoba Ciencia, PID-38, CONICET and Universidad Nacional de Río Cuarto, Argentina.



