1. Introduction
A critical environmental issue facing governments of developing societies is land degradation, which is a crucial concern affecting, among other things, the wellbeing of their people. Hurni (Reference Hurni1985) noted well over 20 years ago that Ethiopia was the most environmentally distressed country in the Sahel belt. Studies have confirmed that land degradation undermines agricultural productivity primarily in the highlands of Ethiopia (cf. Genanew and Alemu, Reference Genanew and Alemu2012), where most (about 88 per cent) of the country's population lives, and involves more than 43 per cent of the country's area and 95 per cent of the cultivated land, and affects 75 per cent of Ethiopia's livestock. Estimates of the extent of land degradation differ, but they all highlight the importance of the problem. The Ethiopian Highland Reclamation Study (EHRS) estimated that by the mid-1980s about 50 per cent of the highlands area (27 million ha) was significantly eroded, while more than one-quarter was severely eroded (EHRS, 1986, cited in Gebremedhin and Swinton, Reference Gebremedhin and Swinton2003). Hurni (Reference Hurni1985) found that soil loss in cultivated areas averaged about 42 metric tons per ha per year, which far exceeds the soil formation rate of 3–7 metric tons per ha per year. More than 20 years ago, Stahl (Reference Stahl1990) estimated that the amount of land incapable of supporting cultivation would reach 10 million ha by the year 2010.
Until recently, the magnitude of land degradation (and deforestation) has far exceeded the conservation activities being carried out.Footnote 1 Indeed, it is only recently that public intervention in land conservation has become a priority in Ethiopia. Land degradation was largely neglected by policy makers until the 1970s and national conservation programs introduced since then have not had the opportunity to profit from much prior research (Shiferaw and Holden, Reference Shiferaw and Holden1999). Policies and programs were adopted based on incorrect assumptions and little understanding of the incentives and constraints related to land conservation, all of which could be misleading.
The rural land administration and land use proclamation No. 456/2005 of Ethiopia (the land certification in particular) has been a step towards land titling (Federal Democratic Republic of Ethiopia, 2005). Its legal ramifications are fundamental to the farm-household's decision to adopt land conservation investment strategies as well as to the intensification of conservation measures. The rural household survey used in this study shows that about 98 per cent of farm-households would like to undertake soil conservation work on their plots if they were provided with a land certificate. But questions remain: which form of land conservation investment do farm-households prefer to undertake on their plot, what determines their preferences, and which factors have a relatively stronger influence on their preference decisions? Land conservation investment promotion policies and programs with little or no understanding of these questions can be deceptive and may in fact exacerbate the land degradation process.
Objective and hypothesis
Research into both the incentives as well as the constraints governing farm-households' preferences among the various forms of land conservation investment measures is of interest for land conservation policy making. Understanding these incentives and constraints would fill an information gap and help program designers seeking policy instruments to encourage or discourage farmers' use of one form of land conservation measure over another.
This study may contribute to filling this knowledge gap as it examines the factors which lead to differences in farm-households' preferences among the various forms of land conservation investments. In particular, the study focuses on the role of poverty, land tenure security and market access factors in influencing these preference decisions.
A farm-household's preference among the different forms of land conservation investment measures can be influenced by the characteristics of the household, the plot and its environment, as well as issues related to the institutional setup relevant to the farm-household. These include level of poverty, land tenure security attached to the plot, access to markets, and other variables, including plot characteristics and village-level characteristics. This study makes the following three working hypotheses:
-
Hypothesis 1. The poor, because of their higher rates of time preference (RTPs) and risk preference, tend to prefer short-term benefits and cheaper land conservation measures over long-term, more sustainable measures. (See related arguments in Holden et al. Reference Holden, Shiferaw and Wik1998; Godoy et al. Reference Godoy, Kirby and Wilkie2001; Clay et al. Reference Clay, Kelly, Mpyisi, Reardon, Barrett, Place and Aboud2002; Holden and Shiferaw Reference Holden, Shiferaw, Barrett, Place and Aboud2002; Gebremedhin and Swinton Reference Gebremedhin and Swinton2003; Hagos and Holden Reference Hagos and Holden2006.)
-
Hypothesis 2. Farm-households cultivating tenure-secure plots have a greater incentive to undertake long-term beneficial land conservation measures; this is in contrast to farmers with tenure-unsecured plots who may have an immediate need for getting more crops rather than protecting the land. This follows from the Neoclassical economic theory which suggests that, ceteris paribus, reduced risk and longer time planning horizons should enhance expected return and encourage investment (cf. Feder et al. Reference Feder, Onchan, Chalamwong and Hongladarom1988;; Gebremedhin and Swinton Reference Gebremedhin and Swinton2003).
-
Hypothesis 3. Farm-households with better access to markets and infrastructure development expect higher return from land conservation measures and hence tend to undertake long-term, more sustainable measures.
It is our belief that this study makes a number of contributions to the existing literature on land conservation. The study is unique in the sense that it is – to the best of our knowledge – the first comprehensive plot-level assessment of unpooled preferences of land conservation measures by the farm-household using a theoretical and conceptual framework designed with the random utility model as a base. Its contributions are also related to the empirical application of a model of landowner decision making to a vast and comprehensive data set that enables investigation of several relevant aspects of the problem. In particular, its use of additional explanatory variables is what this study offers when compared with the previous literature. In contrast to other related studies, the richness of the data allowed us to incorporate a wider range of variables, including asset- and poverty-related factors as possible determinants of farm-households' preferences among the different forms of land conservation investment measures.
The balance of the paper is structured as follows: the conceptual framework used in this study is presented in section 2, and section 3 presents the methodology employed. Data, results and interpretations are presented in section 4. While section 5 summarizes and concludes, section 6 provides the policy and research implications.
2. Conceptual and theoretical framework
The framework for the analysis in this study makes use of the random utility model as a basis. In this model, it is assumed that the decision maker (the farm-household) will choose an outcome (i.e., a specific form of land conservation investment on a specific plot) which maximizes that household's utility. Since the household's utility is not observable – rather, only certain attributes of the alternatives as faced by the decision maker are observable – the utility of the household is decomposed into a deterministic (or a systematic) component V ij and a random component ξ ij of utility Greene (Reference Greene2011):
 $$U_{ij} =V_{ij} +\xi_{ij}\comma \; \quad \hbox{for all } \quad j =1\comma \; 2\comma \; \ldots\comma \; J \quad \hbox{and} \quad i =1\comma \; 2\comma \; \ldots\comma \; N $$
where U ij is the level of utility which decision maker i obtains from choosing alternative j. Since the unknown component ξ ij is not observable, the decision maker's choice cannot be predicted exactly; instead, the probability of any particular outcome is derived. Thus the probability that decision maker i chooses outcome j (i.e., P ij ) is equal to the probability that the utility of alternative outcome j is greater than the utilities of all other alternatives in the choice set:
 $$P_{ij} =\Pr \lpar U_{ij} \gt U_{ik} \rpar =\Pr \lpar V_{ij} + \xi _{ij} \gt V_{ik} +\xi _{ik}\rpar \comma \; \quad \hbox{for all} \quad k \ne j.$$
Equation (2) shows that the choice probability, P ij , depends only on the difference in utility, not on its absolute level. This implies that, in general, the only parameters that can be estimated or identified are those capturing differences across alternatives.
The specific form of the above discrete choice model is determined by the assumed distribution of the random component, ξ ij , and the specification of the deterministic component, V ij . While the latter is often treated as a linear function of explanatory variables and unknown vector of underlying parameters Q, the expectation of the former [i.e., E(ξ ij )] is assumed to be zero in random utility models, implying that E(U ij ) = V ij (Ivan and Katarina, Reference Ivan and Katarina2003). The specific forms of the assumptions related to V ij and ξ ij in the multinomial logit (MNL) model are described in the methodology section. Given these assumptions, the unknown parameter, Q, of the discrete choice model can be estimated to examine the way in which observed factors influence the choice of the decision maker. The log-likelihood estimator can be used to estimate the parameters, for which the log-likelihood function to be maximized over parameters Q can be given by:
 $$\ln L\lpar Q\rpar =\sum_{i=1}^N \sum_{j=1}^J {y_{ij} \ln P_{ij}}\comma \; $$
where y ij equals 1 if alternative j is chosen, and 0 for all other non-chosen alternatives.
3. Methodology
This section begins by presenting the rationale for the appropriateness of the MNL model for our study, and goes on to describe the MNL model and the methods of interpretation related to it. The section also sets the test equations for the hypotheses set forth in section 1 of this study.
3.1. Model appropriateness
There are three reasons for the MNL model's desirability for this study. The first is related to its appropriateness for analyzing the characteristics of individuals. This study examines how household-plot level characteristics affect a household's preference when choosing among different forms of land conservation investments measures. For a given individual plot, the values of the independent variables are the same for all outcomes. For instance, the poverty level of the household does not change with the choice of a certain form of land conservation. The data used in this study consist of such specific individual characteristics and the MNL model is well suited to analyzing the characteristics of individuals (Long, Reference Long1997). The second reason relates to the assumption of independence of irrelevant alternatives (IIA): the alternatives are distinct and independent of one another (Long and Freese, Reference Long and Freese2006). This assumption can only be empirically tested when certain respondents have different choice sets. That is, the IIA assumption is not a serious problem when everyone in the sample is presented with the same choice (Allison, 1999, cited in Han and Harrison, Reference Han and Harrison2004). In this study, the alternatives are presented to all respondents; hence, the IIA assumption holds. Moreover, the MNL model is enormously useful for the analysis of nominal variables and is easy to estimate, even for a large number of alternatives (Borsch-Supan, Reference Borsch-Supan1990; Long, Reference Long1997). Finally, the MNL model is more appropriate for this study given its practicality compared to alternative models such as the multinomial probit model (cf. Long, Reference Long1997) and the nested logit model. In particular, in studies like ours where many independent variables are considered, the MNL model seems most appropriate.Footnote 2
3.2. Econometric modeling: the multinomial logit model
This section formally presents the MNL model as it fits into our study. Proceeding from the random utility model developed earlier, the utility derived from choosing a land conservation investment type j by a farm-household i on its particular plot l is
 $$U_{ilj} =\mu _{ilj} +\xi _{ilj}\comma \; \quad \hbox{for all}\ j\comma \;$$
where μ ilj is the average utility associated with choice j (among the J alternatives) for farm-household i on its particular plot l, and ξ ilj is the random error associated with that choice. The probability of this choice (y) is the probability that the utility obtained from alternative j exceeds that of any other alternative; for example, k:
 $$\Pr \lpar y_{il} =j\rpar =\Pr_{ilj} =\Pr \lpar U_{ilj} \gt U_{ilk} \rpar =\Pr \lpar \xi_{ilk} \lt \mu_{ilj} -\mu_{ilk} +\xi_{ilj}\rpar \comma \; \quad \hbox{for all} \quad j.$$
The specific form of the discrete choice model is determined by the assumed distribution of ξ and the specification of how μ j is related to measured variables. The MNL model is obtained by letting (Long Reference Long1997) μ j be a linear combination of household-plot level characteristics of the farm-household (i.e., μ ilj = X il β j ) and by assuming (see McFadden Reference McFadden and Zarembka1974) each random component ξ ilj in equation (4) to be independently distributed and to have identical type I variance π2/6:
 $$f\lpar \xi _{ilj} \rpar =e^{-\xi _{ilj} }e^{-e^{-\xi _{ilj} }}\quad \hbox{and}\quad F\lpar \xi _{ilj}\rpar =e^{-e^{-\xi _{ilj} }}\comma \; $$
where f (.) is the density and F (.) is the cumulative distribution.
Combining equation (4) and the probability distribution for the random components ξ ilj in equation (6), and assuming independence among the random components of the alternatives, P ilj [equation (5)] is given by:
 $$P_{ilj} =\Pr \lpar U_{ilj} >U_{ilk} \rpar =\int \prod_{k\ne j} F\lpar \mu_{ilj} -\mu _{ilk} +\xi _{ilj} \rpar f\lpar \xi _{ilj} \rpar d_{ilj}\comma \; \ \hbox{for}\quad k \ne j.$$
Equation (7) has a closed-form solution and, after manipulating the logit probabilities with μ ilk = X il β j , becomes (Ivan and Katarina, Reference Ivan and Katarina2003):
 $$P_{ilj}=\displaystyle{{\exp \lpar X_{il} \beta_j \rpar } \over {\sum_k {\exp \lpar X_{il} \beta_k\rpar }}}.$$
Since the MNL model is a model where independent variables do not vary over choices, coefficients are estimated for any choice. Moreover, the model requires identification. To identify the model, the common method is to treat one of the preferences, say j, as the category (i.e., to impose constraint on β j to equal 0). The log-likelihood function will, therefore, be:
 $$ \ln L \lpar \beta \rpar = \sum_{i=1}^N \sum_{k=1}^J y_{ilj} \ln \displaystyle{{\exp \lpar X_{il} \beta _j \rpar } \over {\sum_j \exp \lpar X_{il} \beta _k \rpar}}$$
where the right-hand side of equation (8) is substituted for P ij in equation (3). Equation (9) can then be maximized to estimate the parameters β that are consistent, asymptotically normal and efficient. Thus, under conditions that are likely to apply in practice, the likelihood function is globally concave, ensuring the uniqueness of the MNL model (Amemiya, Reference Amemiya1985).
The MNL as an odds model
An alternative way to express the MNL model is in terms of odds. The odds of outcome j vs. outcome k, given X, are defined as (Long Reference Long1997):
 $$\Omega_{j \vert k} \lpar X_{il}\rpar =\displaystyle{{\Pr \lpar y_{il} =j \vert X_{il}\rpar } \over {\Pr \lpar y_{il} = k \vert X_{il}\rpar }}.$$
Placing equation (8) into equation (10) and taking logs yields:
 $$\Omega_{j \vert k} \lpar X_{il} \rpar =X_{il} \lpar \beta _j -\beta _k \rpar .$$
This result demonstrates that the MNL model is linear in the logit.
3.3. Interpretation of parameters
The number of parameters in the MNL model is often very large. As a result, their signs and magnitudes are not directly very informative. There are several ways to interpret the MNL model estimation results, including predicted probabilities and their changes, and the odds ratio (Long, Reference Long1997; Long and Freese, Reference Long and Freese2006). The factor change interpretation of the odds ratios, unlike the marginal and discrete changes, does not depend on the value of an independent variable, x k . This is the advantage of the odds model: interpretation of coefficients is simple. On the other hand, it is unsatisfactory, since it is difficult to convey the substantive meaning of a change in the log of the odds. The difficulty in interpreting odds ratios using the MNL model is that the coefficients for comparisons among all pairs of outcomes need to be examined in order to understand the effect of a given variable. In this respect, measures of discrete change in probabilities are effective methods of interpretation for both continuous and dummy independent variables. However, they do not indicate the dynamics among the dependent outcomes, and discrete changes are different for different values of the variables. Both of these disadvantages of discrete changes become advantages when the odds model is used. All in all, there are certain advantages to either way of interpreting the MNL model results, as each method provides useful information that the other does not. In this study, therefore, interpretation of parameters of the model is based on a discrete change in predicted probabilities as well as the odds ratio. Moreover, discrete change plots and odds ratio plots are also used for summarizing results and discerning patterns.
3.4. Test equations
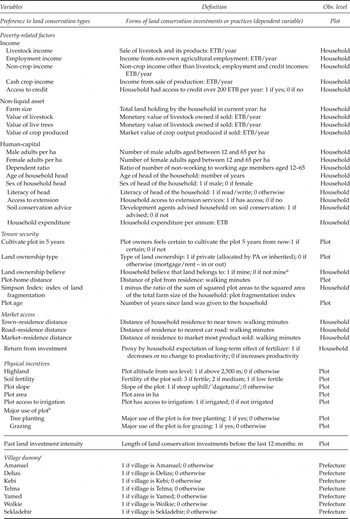
The survey used in this study solicited farm-households' preferences among the different forms of land conservation investments, which the authors recorded as seven alternative categories. These mutually exclusive and exhaustive alternatives include traditional terraces with rocks (TTR); modern terraces with rocks (MTR); traditional terraces with soil (TTS); modern terraces with soil (MTS); ditch digging (DD); ‘kitir’ works (KW)Footnote 3 ; and ‘other types’ such as grass cover, contour farming and forestation. These categories are used as outcomes of the dependent variable in the MNL model. Five vector-independent variables (see table 1) are considered: poverty, land tenure security, market access, plot characteristics (i.e., physical incentives) and residence in a certain village. Past land investment intensity is also considered as an independent variable.
Definition and observation level of the dependent and explanatory variables

Notes: a ‘Not mine’ refers to either land belonging to the peasant association or to the government. b The base group for the major use of plot dummy is ‘plot with major use for farming and/or fallowing’. c The base group for the village dummies includes villages named Kete, Godguadit, Ambamariam, Addismender, Chorisa, Indodber and Addisgulit.
We assumed that the following test equations fit our MNL model:
 $$\eqalign{\ln \Omega _{TTR \vert {Other}} \lpar X\rpar & = \gamma _{0\comma TTR \vert {Others}} + \gamma _{1\comma TTR \vert {Others}}\, \, Poverty \cr & \quad +\gamma_{2\comma TTR \vert {Others}} \, \, Tenure + \gamma_{3\comma TTR \vert {Others}}\, \, Market \cr & \quad + \gamma_{4\comma TTR \vert {Others}}\, \, Plot \, \, Characteristics \cr & \quad+\gamma_{5\comma TTR \vert {Others}}\, \, Village\, \, Characteristics \cr & \quad+\gamma_{6\comma TTR \vert {Others}} Past\, \, intensity}$$
Similar specifications are made for the remaining preferences (i.e., MTR, TTS, MTS, DD and KW), and the alternative ‘other types’ is set as the base category (i.e., the comparison group). These ‘other types’ are generally short-term measures involving less investment time, labor and money than the other six land conservation investment alternatives.
Based on the hypotheses set forth earlier (in section 1) in this study, we test whether:
-
Hypothesis 1. The poor tend to prefer short-term beneficial but cheaper land conservation measures over long-term, more sustainable measures,
 $$i.e.\, \, \gamma_{1\comma m \vert {Others}} \lt 0\comma \; \quad for\, \, m=TTR\comma \; MTR\comma \; TTR\comma \; MTS\comma \; DD\comma \; KW.$$
-
Hypothesis 2. Farm-households cultivating more secured plots have greater incentives to undertake long-term beneficial land conservation measures in contrast to farmers with unsecured plots,
$$i.e.\, \, \gamma_{2\comma m \vert {Others}}\quad for\, \, m=TTR\comma \; MTR\comma \; TTR\comma \; MTS\comma \; DD\comma \; KW.$$
-
Hypothesis 3. Farm-households with better access to market and infrastructure development tend to undertake long-term, more sustainable measures,
$$i.e.\, \, \gamma_{3\comma m \vert {Others}}\quad for\, \, m=TTR\comma \; MTR\comma \; TTR\comma \; MTS\comma \; DD\comma \; KW.$$


4. Data, results and interpretations
4.1. Data and descriptive statistics
This study utilized primary data collected through interviews of rural farm-households in the Ethiopian highlands of the East-Gojam and South-Wello zones of the Amhara region, with the general objective of studying farm-household behavior in relation to sustainable land use. The data gathering forms part of a collaborative research project between the Department of Economics at Addis Ababa University (Ethiopia) and Göteborg University (Sweden), with financial support from the department for Research Co-operation of the Swedish International Development Agency (Sida/SAREC).
Households who were interviewed in the first round (year 2000) were re-interviewed in the second round (year 2002) using the same set of questions. A total of 1,520 households from 12 sites/kebeles (with a minimum of 120 from each site) were interviewed in each of the two rounds. Two more sites (i.e., 318 households) and some new questions were included in the third round. This made a total of 1,838 households in 14 sites (villages or ‘kebeles’) to be interviewed in the third round in 2004/2005. The selection of the sites was purposive to ensure variation in the characteristics of the sites including agro-ecology and vegetative cover. Households from each site were then selected using simple random sampling.
Most of the variables of interest of our study were not included in the first two rounds and hence our study focused only on analyzing the data gathered in the third round, with the inclusion of poverty and asset-related variables from the second round. A sample comprising responses from 4,795 household-plots was examined, after dropping the remaining plots due to missing variables and values.
The data consolidated various household-related variables as well as plot-level data, including land conservation and input practices as well as questions pertaining to household poverty, land tenure security and market incentives. Farm-households were asked to state which form of land conservation investment they prefer to undertake on their specific plot. Their response became the observed dependent variable in the MNL model used in this study. The responses were distributed among seven mutually exclusive and exhaustive alternative preferences: TTR (40 per cent of households chose this alternative); MTR (6 per cent); TTS (20 per cent); MTS (3 per cent); DD (19 per cent); KW (6 per cent); and ‘other types’ (7 per cent). To explain the farm-household's preference among these alternatives, a range of explanatory variables (measuring the effects of poverty, land tenure security, access to market, plot characteristics and village characteristics) were used. The definition and specification of the independent variables used in the analysis are described in table 1.
4.2. Testing model parameters
The MNL model was estimated (see online appendix A, available at http://journals.cambridge.org/EDE Footnote 4 ) and model tests were carried out. The latter included testing the effect of the independent variables (online appendix B), testing the multiple independent of a set of explanatory variables (online appendix C), and tests for combining outcomes of the dependent variable (appendix D). The Wald test result suggests that the hypothesis (H1) stating that the effects of variables involving poverty are simultaneously equal to 0 can be rejected at the 0.01 significance level. The test also shows similar results for the effects of the variables addressing land tenure security, market access and plot characteristics. Moreover, the test confirms that any two alternative outcomes of the dependent variable are distinguishable,Footnote 5 suggesting that it is inappropriate to pool the different forms of land conservation investments in preference studies.
4.3. Determinants of preferences for forms of land conservation
4.3.1. Variations in predicted probabilities
We found that the range of the predicted probabilities is quite large for each alternative outcome (see online appendix E), suggesting that there is sufficient variation in each outcome category of the dependent variable to justify further analysis.
4.3.2. Discrete changes in probability
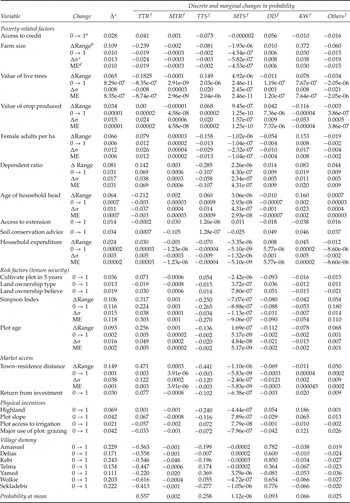
Table 2 presents estimates of the discrete and marginal changes in predicted probabilities. Setting the values of all the explanatory variables at their mean (see bottom of table 2), the probability of preferring TTR is the highest (56 per cent), followed by that of TTS (26 per cent) and DD (at 9 per cent). MTS is least preferred by farm-households.
Discrete and marginal changes in probability for the MNL model estimation of preference to forms of land conservation investment

Notes: Result is presented for selected (statistically significant at least at = 0.10 level) explanatory variables.
a
0 → 1 is discrete charge from 0 to 1.
b
Δ Range is the change from the minimum to its maximum.
c
σ is the central change of one standard deviation around the mean.
d
ME (marginal effect) is the centered change of one unit around the mean, all other variables held at their means.
 $^{e}\bar{\Delta}$
is the average absolute change.
f
TTR, traditional terraces with rocks; MTR, modern terraces with rocks; TTS, traditional terraces with soil; MTS, modern terraces with soil; DD, digging ditches, KW, ‘Kitir’ works; and Others represents other types of conservation practices including grass covers, contour farming and forestation.
Factors involving poverty
Holding all other explanatory variables at their means, having access to credit increases the probability of preferring TTR by 0.04, MTR by a margin of 0.001, and DD by 0.06. The tendency of the effect of farm size is to impede preference probabilities, with the exception of DD and KW, which have a positive impact on the probability of preferring TTR (0.02) and KW (0.03). If a household contains an additional adult female, this increases the probability of preferring KW by 0.008, while a household with more dependents shows less preference for TTS. Having access to extension services increases the probability of preferring MTR by 0.03, MTS by 0.01, ‘other’ types by 0.02, and decreases the probability of DD by 0.02 and KW by 0.04. In general, access to soil conservation advice produces effects which are contrary to those produced by access to extension services, with stronger changes in preference probabilities for the former. It is also demonstrated that having access to soil conservation advice increases the probability of preferring DD by 0.05.
As can be noted from the above, the large number of coefficients to interpret makes it a challenge to sort out all the relevant information. Plotting the discrete-change coefficients may help to discern patterns. Online appendix F summarizes the discrete changes in predicted probabilities for the statistically significant covariates. In order to allow comparison of the magnitude of the effect of independent variables, panels A through D are drawn at the same scale. Interpretations have been made while holding control variables at their mean. Clearly, panel A shows how a one-unit increase (for the dummy independent variables) or an increase in standard deviation (for the continuous independent variables) in each of the covariates affects the preference probability. Accordingly, the impact of credit access on the probability of preferring TTR or DD is the largest: households with access to credit are more likely to prefer TTR and DD than households without access. On the other hand, access to credit deters the probability of preferring TTS. Likewise, having access to soil conservation advice has a considerable negative effect on the probability of preferring TTS. All in all, panel A shows that the effect of poverty on the probability of preferring a particular form of land conservation investment is not quantitatively substantial.
Land tenure security factors
Holding all other variables constant at their mean, farm-households' belief that they are going to cultivate their plot over a five-year period increases their probability of preferring TTR by 0.07, and the probability of TTS by 0.05, while it decreases the probability of opting for DD by 0.09. For the household whose land is ‘private’ (allocated or inherited), the probability of preferring MTR decreases by a margin of 0.001. In contrast to land ownership type, belief in ownership triggers greater changes in preference probabilities. For the owner of a farm-household who believes that the land is his own, the probabilities of preferring TTR, TTS and DD increase by 0.03, 0.01 and 0.05, respectively, while the probabilities of opting for KW as well as ‘other types’ decrease by 0.02 and 0.02, respectively. Land fragmentation seems to have a considerable impact on land conservation preferences. A standard deviation increase (centered around the mean) in the land fragmentation index decreases the probabilities of choosing TTS, DD and KW by 0.03, 0.01 and 0.01, respectively, yet it increases the probability of TTR and ‘other types’ by 0.04 and 0.01, respectively. On the other hand, plot age only has a marginal effect on preference. Panel B (see online appendix F) summarizes the effect of land tenure security on preferences among the types of land conservation investment.
Market access
The expectation of households concerning their return on their land conservation investment turned out to be the only viable market access variable to affect their preferences. If households expect that their return from their land investment will reduce or bring about no change in productivity, this increases the probability of preferring TTR by 0.08, of preferring KW by 0.02, and of ‘other types’ by 0.01. This negative expectation also decreases the probability of TTS by about 0.10. Panel C (see online appendix F) summarizes the effect of market access factors on preferences among the forms of land conservation investment.
Plot characteristics (physical incentives)
Holding all other variables constant at their mean, the fact that a household has its plot in the highlands decreases that household's probability of preferring TTS by 0.24, and increases the probability of preferring KW by 0.19. Having a plot situated on steep uphill (‘dagetama’) slopes decreases the probability of choosing TTS by 0.12 and increases that of choosing DD by 0.07. Further, if a plot has access to irrigation, the probability of opting for MTR decreases while it increases for TTS. For plots used primarily for grazing (as opposed to plots being farmed or fallowed), the probability of preferring TTS is reduced by 0.07, and the probability of preferring DD is increased by 0.12. The above results concerning the effect of plot characteristics on the probability of land conservation preference are summarized in panel D (see online appendix F).
Looking at panels A–D of appendix F, preferences for modern terracing with both rock and soil seem not to be influenced by poverty, land tenure security, market access or plot characteristics. Moreover, market access does not explain the probability of preferring DD, KW and ‘other types’. All in all, the effects of physical incentive factors (i.e., plot characteristics) on preferences are the greatest, the impact of market access factors on preferences are about average, while factors related to poverty and land tenure security have the least influence on preferences.
Village characteristics
The results seem to suggest that village characteristic variables (or community-level factors) have effects on farm-households' preferences as to which type of land conservation investment the particular household wishes to undertake. In relative terms, the effect of village characteristics is greater on the probability of choosing DD and TTR and these factors change probabilities by more than 0.50. On the other hand, village characteristics exert the weakest effects on the probability of choosing modern terracing with both rock and soil.
4.3.3. Dynamism among the dependent outcomes: interpreting the odds ratio
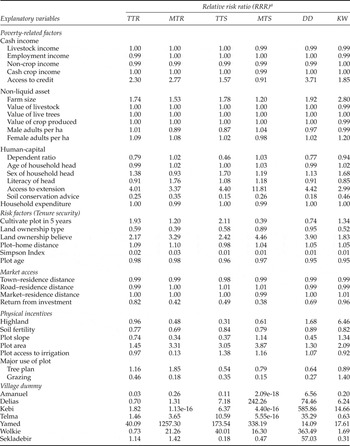
The dynamic interrelationship among the dependent outcomes is not immediately visible from the measures of discrete change discussed above. This dynamism is better explained by interpretations using an odds ratio. Table 3 presents the factor changes in the odds for change in the independent variables relative to the ‘other types’.
Factor changes in the odds for change in the independent variables

Notes: No. observations: 4,795. Wald χ2(258) = 91,370.92. Prob > χ2=0.0000. Log pseudo-likelihood = −5,263.73. Pseudo R 2 = 0.3205.
This table is comparable to results in table 2: standard errors and significance of coefficients are provided in table 2.
a The relative risk ratios (or the odds ratio) are obtained by exponentiating the MNL coefficients (i.e., eβ or exp(β)] presented in table 2. Accordingly, they are interpreted as referent group, ‘other’ types of land conservation.
Poverty
Households with access to credit are more likely to prefer TTR, MTR and DD than ‘other types’. The estimated odds for households with access to credit for preferring TTR, MTR and DD are, respectively, 2.30, 2.77 and 3.71 times higher than for preferring ‘other types’. The odds ratio for farm size is 1.74, 1.78, 1.92 and 2.80 for preferring TTR, TTS, DD and KW, respectively. This indicates that, as a household's total land holding increases, the odds of preferring TTR, TTS, DD and KW increases by a multiplicative factor of 1.74, 1.78, 1.92 and 2.80, respectively. For the farm-household with access to extension services, the odds of preferring TTR, MTR, TTS, MTS and DD are, respectively, 4.01, 3.37, 4.40, 11.81 and 4.42 times larger than of preferring ‘other types’. The odds ratios that a household with access to soil conservation advice prefers TTR, TTS and DD over ‘other types’ are 0.25, 0.15 and 0.18, respectively. This implies that these options are less preferred when compared to the choice of ‘other types’.
While interpretation of the odds ratio as discussed above (as can be noted by examining the results in table 3) is possible and can be done for all of the independent variables, the larger number of coefficients (and hence the larger number of comparisons) makes it difficult to see patterns. An odds-ratio plot (see online appendix G) not only makes it simpler to see patterns in the coefficients, but also helps to visualize the effect of the independent variables on the preference of one outcome relative to each of the other outcomes. It summarizes the odds ratio for the statistically significant (at least at 0.10 level) covariates. To allow comparison of the magnitudes of the effects of the covariates of poverty, land tenure security, market access and plot characteristics, panels I–IV are drawn with the same logit coefficient scale. In panel I, credit access orders land conservation preferences from MTS to ‘other types’ to TTS to KW to TTR to MTR to DD, but none of the adjacent outcome categories (shown by the connecting lines) are significantly differentiated by access to credit. Accordingly, having access to credit increases the odds of preferring KW, TTS or ‘other types’ relative to preferring MTS, but the effects are not statistically significant. On the other hand, having access to credit significantly increases the odds of preferring TTR, MTR and DD relative to preferring MTS. Compared to its impact on the other outcomes, the impact of credit access on the preference for DD is the largest. This can be seen by the greater spread in the scatter plot in panel I. Compared to other indicators of poverty, the effects of a change in the standard deviation for farm size are positive and exert their greatest effect on the preference for KW. The effect of a change in the standard deviation of the number of adult females per ha is generally much weaker. Overall, the effects on the preferences of access to extension are positive and those of access to soil conservation advice are negative, with both effects being greater than those previously mentioned. Exceptionally, access to extension assistance has the largest effect.
Land tenure security
The results in table 3 demonstrate that the odds of preferring TTR and TTS relative to ‘other types’ are, respectively, 1.93 and 2.11 times greater for households expecting to cultivate the plot over the five-year period than those who do not. On the other hand, the odds of preferring MTS relative to ‘other types’ is 0.39 times lower for households who expect to cultivate the plot in five years than those who do not. The odds of preferring MTR over ‘other types’ are 0.39 times lower for privately owned plots than for non-private plots. Furthermore, the odds of preferring TTR, MTR, TTS, MTS and DD relative to ‘other types’ are 2.17, 3.29, 2.42, 4.46 and 3.90, respectively, times greater among households who believe they own the land than those who do not. In terms of land fragmentation, the study reveals that the more household plots are fragmented, the less conservation investment will be undertaken. The graph in panel II of online appendix G summarizes the effect of the land security factors discussed above.
Market access
The study also reveals that the farther households reside away from town, the less likely they will be to prefer TTS and DD than ‘other types’. The odds are, respectively, 0.98 and 0.99 times lower for preferring TTS and DD than ‘other types’. These results indicate that the odds of households who expect returns from land investment to decrease or to have no effect on productivity preferring MTR is 0.42 times smaller than the odds of preferring ‘other types’. The graph in panel III of online appendix G summarizes the effect of market access factors discussed above.
Plot characteristics
The odds that TTS will be preferred relative to ‘other types’ are 0.31 times lower on plots situated in the highlands than plots situated elsewhere. On the other hand, the odds that KW will be preferred relative to ‘other types’ are 6.46 times greater for plots situated in the highlands than plots located elsewhere. The odds that MTR, TTS and DD are preferred relative to ‘other types’ are 0.34, 0.37, 0.45 times lower, respectively, on plots situated on steep uphill (‘dagetama’) slopes than on plots situated in other locations. The odds of plots with access to irrigation being preferred for MTR are 0.13 times smaller than those for ‘other types’. Plots primarily used for grazing are less likely to be preferred for TTS than ‘other types’. Finally, the odds of plots used primarily for grazing being preferred for TTS are 0.35 times smaller than for ‘other types’. The graph in panel IV of online appendix G summarizes the effect of the physical incentive factors discussed above.
All in all, a comparison of panels I–IV of appendix G reveals that the effect of market access on preference among the various forms of land conservation investments appears to be the weakest when compared to the impact of poverty, land tenure security or physical incentives. Among the poverty factors, female labor per ha seems to have the weakest effect on a household's preference. With regard to land tenure security factors, the impacts of plot age and land fragmentation on preference are the smallest. Among the market access factors, distance of residence from the nearest road (accommodating either car or truck traffic) or marketplace has the smallest impact on household preference. With regard to the physical incentive variables, the effects on preference of plot area and plot access to irrigation are the weakest.
5. Summary and conclusions
This study examines the factors leading to differences in farm-households' preferences for various forms of land conservation investment measures. It focuses on the role of poverty, land tenure security, market access and plot characteristics in making this choice. The study made use of a rural household-plot level survey of farm-household behavior involving sustainable land conservation use in the Ethiopian highlands.
Taking the random utility model as a basis, this study made use of the MNL model. The estimates of parameters were obtained using maximum likelihood. In addition, the Wald tests were carried out to test the model parameters.
The results demonstrate that variables pertinent to poverty, land tenure security, market access and plot characteristics jointly influence farm-households' preferences. They also confirmed the inappropriateness of pooling the different forms of land conservation investments, suggesting the need for separate treatment of each form in studying land conservation investment preferences.
In general, the message learned from this study is that a farm-household's preference for undertaking a particular land conservation measure on its specific plot is influenced by many variables. Specifically, the empirical evidence in this study shows that:
-
• Poverty seems to drive farm-households towards short-term land conservation measures (such as grass cover, contour farming and forestation) which are less expensive (in terms of labor and money) and which entail less skill than long-term land conservation measures (such as rock or soil terracing, DD and KW). An increase in farm size encourages farm-households to prefer traditional rock and soil terracing, DD and KW. Farm-households with more adult female members tend to prefer KW. Soil or rock terracing (both traditional and modern) and DD are more likely to be preferred by farm-households with access to extension services than those without that access. The effect of access to soil conservation advice, in contrast to what might be expected, is to detract from a farm-household's preference for traditional terracing (with rock or soil) and DD. This may be due to the fact that advice on soil conservation might have focused on discouraging traditional land conservation measures.
-
• Land tenure security has a mixed effect on a farm-household's preferences (regarding short-term vs. long-term measures). Expecting to operate the plot for the following five years is associated with a greater preference for traditional terracing with rock or soil, and a lesser preference for MTS. Privately owned (allocated by a peasant association or inheritance) plots are less likely to be preferred for MTR. Farm-households who believe the land belongs to them tend to prefer long-term land conservation investment measures (terracing, either traditional or modern, with rock or soil). Farmers cultivating more fragmented plots are less likely to prefer either TTR or MTR, TTS, DD or KW. A plot acquired (by the farm-household) for a long period is associated with a lesser preference for traditional terracing (with rock or soil), DD and KW.
-
• A farm-household's access to market, in general, seems not to matter in regard to that household's preference for a particular form of land conservation investment. While the distance of a farm-household's residence from town diminishes the household's preference for TTS and DD, a farm-household that expects an increasing return on land investment is more likely to prefer TTS.
-
• A farm-household also considers the characteristics of the plot when deciding which land conservation investment to prefer. Plots situated in the highlands are less likely to be chosen for TTS and are more likely to be chosen for KW than plots situated elsewhere. Plots situated on steep uphill (‘dagetama’) slopes are less likely to be preferred for TTS and DD. Moreover, farm plots with access to irrigation are less likely to be preferred for MTR, while plots primarily used for grazing are less likely to be preferred for TTS.
All in all, this study has demonstrated that a farm-household's preference as to which form of land conservation investment to undertake on its particular plot is a complex decision. This can be noted from the large number of statistically significant covariates in the model, each of which contributes marginally to the overall decision process.
6. Policy and research implications
Poverty
The results in this study suggest the importance of disaggregating the different components of poverty in assessing its effect on a farm-household's decision as to which type of land conservation to prefer. Policies and programs that do not consider which type of poverty affects farm-households' preference decisions (and how it affects them) may lead to erroneous conclusions. All in all, poverty seems to drive farm-households towards short-term land conservation measures (such as grass cover, contour farming and forestation) which are less expensive (in terms of labor and money) and which entail less skill than long-term land conservation measures (such as rock or soil terracing, DD and KW).
This study confirms that long-term land conservation investments such as rock terracing (both traditional and modern) and DD are likely to be preferred among farm-households with access to credit. This important role of access to credit on a farm-household's preference decision needs to be recognized by land conservation policy makers. This study also suggests the important role of access to extension services and soil conservation advice in creating awareness and knowledge among farm-households in their preference decisions. The policy lesson here is that extension service and soil conservation advice can serve as stimuli for guiding a farm-household's preference. In this regard, the drive in the current approach of the Ethiopian government to use extension service workers as agents of development (DAs) is a step forward, provided that these agents can further be capacitated to play a ‘multiplier’ effect in helping spread best land conservation measures.
Although larger farm sizes (as measured by households' total land holding) encourage traditional rock and soil terracing, DD and KW, large plot size does not. An important policy lesson in the Amhara regional state is, therefore, to be aware that it is the larger, rather than smaller, farm that is more preferred for traditional terracing.
Our result confirms that having more adult female members seems to encourage farm-households to prefer KW. This, perhaps, reflects the gender-specific nature of the division of labor in rural Ethiopia, where men are often more mobile (e.g., in search of a job) than females, and the female labor market tends to function poorly compared to the male labor market. Given such market imperfection and labor immobility among the females, the presence of more working-age female members in the household is expected to encourage land conservation in general, and KW (which is less labor and cost intensive) in particular. It is, therefore, important for those designing land conservation policies and programs to keep in mind not only the gender-specific nature of the division of labor but also the possibility that female labor availability can represent a different asset type and can be more important in a farm-household's decision as to which type of land conservation measure to prefer.
In terms of the quantitative importance of the poverty-related variables, the effect of changes in most of the statistically significant variables is quite small. Given the farm-household production in rural Ethiopia is often self-subsistence and that most of Ethiopia's farmers are by and large small farmers in terms of income (and also asset and capital), such marginal effects of the poverty-related variables may only be the picture as seen at present. As Ethiopian farmers begin selling more and more of their production and as agriculture becomes more commercial and plays a leading role in the country's overall development – as dictated in the country's ‘Agricultural Development Led Industrialization’ (ADLI) strategy – it is expected that the importance of these poverty-related variables in determining farm-households' preference decisions will increase. Therefore, future studies on the effect of poverty-related variables on preference seem vital.
Land tenure [in]security
Our result suggested a few policy lessons with regard to the effect of land tenure security on a farm-household's decision as to which type of land conservation measure to prefer. A farm-household's preference decision seems to be influenced by certainty to cultivate land over a five-year period (a measure of risk for the longer period), land ownership type (a measure of risk for the immediate period), and belief in land ownership (a measure of risk for the intermediate period). And noticeably both these factors seem to encourage terracing (with rock or soil). The policy lesson here is straightforward in that preference of long-term and costly (i.e., terracing) land conservation measures increases with perceived degree of tenure security. This confirms that farmers need confidence through secure land tenure in order to invest in long-term and costly land conservation investments.
In this regard, Ethiopia's recent rural land administration and land use proclamation No. 456/2005 Act is encouraging. The need to sustainably conserve and develop land and pass it on to the coming generation is stated in its preamble. Moreover, the proclamation is intended, among other things, to put in place legal conditions whereby rural landholding security is provided to the holder. Land in Ethiopia is not private. The right to ownership of land is exclusively vested in the state and in the people; it cannot be sold. The landholder has only use right, with no time limit (Article 7(1)). This proclamation (and the land certification in particular) has been a step towards land titling and its legal enforcement, which are fundamental in a farm-household's decision as to which type of land conservation investment measure to prefer. According to our data (the data on which this study is based), 97.6 per cent of farm-households would like to perform soil conservation practices if they were provided with the land certificate. On the other hand, the rural land administration and land use proclamation (as per Article 17(1)) needs the enactment of a rural land administration and land use law (consisting of detailed provisions necessary for its deliberation). Although miniature, still 2.4 per cent of the farm-households show no interest even if they are given the land certification. It may be possible that some farm-households do not believe it is their responsibility to take care of the land, which may be the case in Ethiopia where land is not privately owned, or perhaps they do not adopt land conservation because of their belief that their adoption will likely not make any real difference, or because they consider land conservation investment as a ‘bad’. This suggests the need for further research on identifying the factors determining farmers' willingness to conserve their land so as to identify better mechanisms that provide enough security over their land to justify long-term (and short-term) land improvements.
Market access
Our result implies that the role played by market access in affecting a farm-household's preference decision is relatively low. This can be inferred from the minimal effect of market access related factors. This result might be that all of our market access related variables (i.e., a farm-household's access to market, residence distance from town and the household's expectation of return on land investment) in our models are proxy variables for crop prices, cost of labor and materials used for conservation and the yield effect of conservation practices (which are considered to be ideal factors to represent market incentives). Thus, we refrain from making further policy recommendations with regard to the role of market access in land conservation preference decisions. However, two plausible lessons can be learned from our findings:
-
• Possibly the market-related variables used in our models do not adequately reflect indicators of market access. Therefore, further studies on the impact of market-related variables (including output and input prices and their variability) on preference decisions are necessary.
-
• An alternative is that market access factors do not play much of a role in farm-households' decisions as to which type of land conservation measure to prefer. This reflects the possibility that farm-households' preference decisions may be dictated not only by profit considerations but also by consumption choices – a situation that can reflect market imperfection, as is often the case in rural Ethiopia and in most developing countries in general. In such a setting, where markets do not fully function or are entirely missing, other factors than market incentives (such as poverty-related and household characteristics) may play a role in influencing preference decisions.
Another lesson that is worth considering is the fact that factors other than poverty, land tenure security and market incentives (which were the major focus of this study) are also important in determining farm-households' decisions as to which type of land conservation measure to prefer. This study shows that plot characteristics (such as plot altitude, plot slope, access to irrigation, being a plot primarily used for tree grazing) play an important role in farm-households' preference decisions. Although not directly implied from our study, village-level fixed variables or community-level factors (such as presence of community-led investments learning by example) might have a stimulating role in the decision to prefer a particular form of land conservation measure. Further research on the factors leading to such differences across villages may help to learn from good examples.
All in all, the major lesson for land conservation investment promotion policy makers and program designers is that major changes in land conservation investment will require attention to all of these factors, since no single factor exerts enough control to be used single-handedly as a major policy leverage instrument. Much work remains to be done going forward if Ethiopia is to control the problem of land degradation. It is hoped that the lessons drawn from this study will help policy makers and program designers in their endeavor to encourage farmers to adopt and intensify appropriate land conservation investment measures. With regard to policy- and program-related questions, such as how each land conservation investment measure affects soil conservation and which type of land conservation measure is the optimal method, the authors would like to advocate for:
-
• All types of land conservation investment measures affect soil conservation by reducing or containment of the physical soils loss (in specified place, soil type and time) and change in soil fertility (as reflected in physical nature of the soil or change in production per unit area). The degree of their effect varies with the level of technology and quality of the construction. While direct measure of the level of soil conservation reduction by each land conservation method may be difficult at farmers' fields, a systematic measure of farmers' perception and assessment data from on-farm experimentations or demonstration may help to measure the effectiveness of the various land conservation measures and their comparisons.
-
• Defining or identifying the optimum practice is a complex task that involves ways of comparing the effectiveness of conservation measures not only in physical terms (how much soil losses are reduced or land productivity is improved) but also the costs and benefits of the conservation measures. When comparing the various land conservation measures, an optimum type is a practice whose net benefit in reducing soil degradation and/or increasing crop production is the highest (i.e., comparing the value of outputs with the investment and running costs of adopting and using the conservation measure). Consideration for sustainability (sustainable use) of a practice and its adaptability (practicability, skill requirement, etc.) at the farmers' level is also important to call a certain practice an optimal type. Rock terracing, for instance, can be cheap and optimal in rocky areas while such terracing is unaffordable in other areas.
This study represents an addition to the existing literature on land conservation. It is hoped that the lessons from this study as well as lessons from past research and experience will contribute to the country's efforts to curb the problem of land degradation as well as to enhance the country's development.
Supplementary materials and methods
The Supplementary materials referred to in this article can be found online at journals.cambridge.org/EDE.