1 Introduction
Unsteady flow over streamlined surfaces produces interesting but usually undesirable phenomena such as flutter, buffeting, gust response and dynamic stall (McCroskey Reference McCroskey1982). Dynamic stall is a nonlinear fluid dynamics phenomenon that occurs frequently on rapidly manoeuvring aircraft (Brandon Reference Brandon1991), helicopter rotors (Ham & Garelick Reference Ham and Garelick1968) and wind turbines (Fujisawa & Shibuya Reference Fujisawa and Shibuya2001; Larsen, Nielsen & Krenk Reference Larsen, Nielsen and Krenk2007), and is characterized by large increases in lift, drag and pitching moment far beyond the corresponding static-stall values. Carr (Reference Carr1988) reviews progress in analysis and prediction of dynamic stall and discusses effects of key parameters including compressibility, Reynolds number, pitch/plunge rate and three-dimensionality of the wings. Corke & Thomas (Reference Corke and Thomas2015) presents a more recent review with a focus on different methods to control dynamic stall and stall flutter.
Although reported by pilots earlier, dynamic stall was first observed in a laboratory by Kramer (Reference Kramer1932). Kramer (Reference Kramer1932) used adjustable guide vanes to vary the inflow angle, and hence the angle of attack experienced by an airfoil fixed to the tunnel. Three airfoils were tested and the unsteadiness was realized as a constant rate of change of the inflow angle; the angle of attack was varied from 0 to 30 degrees. In all cases, the maximum lift coefficient of the airfoil in unsteady flow was found to exceed the corresponding value in static conditions. Kramer hypothesized that the increase in the lift coefficient was due to delay in flow separation. Similar boundary layer separation delay has been observed in pitching airfoils. This separation delay occurs due to change of effective camber due to non-zero airfoil pitch rate or due to the acceleration of the boundary layer near the leading edge (Magnus effect).
Dynamic stall can be divided into two categories based on the degree to which the angle of attack,
 $\unicode[STIX]{x1D6FC}$
increases beyond the static-stall value,
 $\unicode[STIX]{x1D6FC}_{SS}$
(McCroskey Reference McCroskey1981). Denoting the maximum
 $\unicode[STIX]{x1D6FC}$
reached during the unsteady motion by
 $\unicode[STIX]{x1D6FC}_{max}$
, these categories are: (i) light stall; when
 $\unicode[STIX]{x1D6FC}_{max}$
is only slightly greater than
 $\unicode[STIX]{x1D6FC}_{SS}$
, the viscous, separated flow region is small (of the order of the airfoil thickness), and (ii) deep stall; for larger
 $\unicode[STIX]{x1D6FC}_{max}$
, the viscous region becomes comparable to the airfoil chord. A prominent feature of deep stall is the presence of the dynamic-stall vortex (DSV) that is primarily responsible for the large overshoots in aerodynamic forces and moments. Deep stall is also characterized by strong hysteresis in aerodynamic loads when the unsteadiness (either due to airfoil motion or inflow variation) is periodic. Dynamic stall can lead to stall flutter, an aeroelastic instability, when the net aerodynamic damping becomes negative.
Many fundamental aspects of flutter, buffeting and gust response can be explained using linearized theory. Pioneering work in this area is documented in Wagner (Reference Wagner1925), Theodorsen & Mutchler (Reference Theodorsen and Mutchler1935), Kármán & Sears (Reference Kármán and Sears1938) and Sears (Reference Sears1941), wherein analytical solutions for incompressible flow around thin airfoils have been developed. Jones (Reference Jones1940) investigates the effect of finite length of a wing, and Lomax (Reference Lomax1953) studies the effect of compressibility in high subsonic and supersonic free-stream conditions. However, the classical linearized approach, developed in the aforementioned articles, is limited to small perturbations and the highly nonlinear phenomenon of dynamic stall requires other approaches.
Semi-empirical methods (Ericsson & Reding Reference Ericsson and Reding1988; Leishman & Beddoes Reference Leishman and Beddoes1989; Larsen et al. Reference Larsen, Nielsen and Krenk2007) have been developed to model dynamic stall. These methods use the classical theories, such as by Theodorsen & Mutchler (Reference Theodorsen and Mutchler1935), to model the attached flow behaviour in the linear regime. The leading edge and trailing edge separation mechanisms of stall onset are modelled in these methods. Flow separation criteria are related to the adverse pressure gradient and modelled using the static airfoil polars combined with Kirchoff’s classical free-streamline theory of flow over a flat plate. While these methods are invaluable for preliminary design and analysis, they do not provide new insights into the physical mechanisms leading to dynamic stall. Also, since these methods typically involve several coefficients which are tuned using experimental data for specific airfoils, their applicability is limited to conventional airfoil geometries.
Computational investigations of dynamic stall have included Reynolds averaged Navier–Stokes (RANS) computations (Visbal Reference Visbal1990; Ekaterinaris Reference Ekaterinaris1995), large eddy simulations (LES) (Garmann & Visbal Reference Garmann and Visbal2011; Visbal Reference Visbal2011) for moderate Reynolds number (
 $Re_{c}$
) and direct numerical simulations (DNS) (Rosti, Omidyeganeh & Pinelli Reference Rosti, Omidyeganeh and Pinelli2016) for small
 $Re_{c}$
. Ekaterinaris & Platzer (Reference Ekaterinaris and Platzer1998) reviews potential flow, boundary layer and Navier–Stokes approaches to simulate dynamic stall. Recent computational efforts have focused on using highly resolved LES to investigate dynamic stall on flat plates (Garmann & Visbal Reference Garmann and Visbal2011), airfoils (Visbal & Garmann Reference Visbal and Garmann2018) and finite-span wings (Visbal & Garmann Reference Visbal and Garmann2017). Visbal & Garmann (Reference Visbal and Garmann2018) presents a detailed LES analysis of an NACA 0012 airfoil (
 $Re_{c}=2\times 10^{5}$
) experiencing dynamic stall during a constant-rate pitch-up manoeuver. They found that the laminar separation bubble (LSB) plays a crucial role in the onset of dynamic stall, which was found to be triggered by the breakdown of the LSB. They highlighted the need for highly resolved simulations to capture the small scales associated with the LSB and the abrupt nature of the LSB collapse. Mitigation and/or delay of dynamic stall has also been investigated using LES, see e.g. Visbal & Benton (Reference Visbal and Benton2018). All of these simulations have focused on relatively thin airfoils.
Dynamic stall, particularly stall onset, is dependent on a number of parameters. A number of previous studies have investigated the impact of the following parameters on dynamic stall: Reynolds number, reduced frequency, amplitude of oscillation, Mach number (Chandrasekhara & Carr Reference Chandrasekhara and Carr1990; Carr & Chandrasekhara Reference Carr and Chandrasekhara1996), airfoil leading edge shape (Carr, McAlister & McCroskey Reference Carr, McAlister and McCroskey1977) and surface roughness (Huebsch & Rothmayer Reference Huebsch and Rothmayer2002). Among the geometric parameters, the effect of airfoil thickness on dynamic stall has been relatively unexplored, which is the focus of this paper.
McCroskey et al. (Reference McCroskey, McAlister, Carr, Pucci, Lambert and Indergrand1981) classified dynamic stall (see figure 4 in McCroskey et al. (Reference McCroskey, McAlister, Carr, Pucci, Lambert and Indergrand1981)) into the following categories based on the nature of the boundary layer separation preceding stall.
(i) Leading edge stall can occur in one of two ways – (a) the LSB may ‘burst’ as the adverse pressure gradient becomes too high and the separated shear layer fails to re-attach, leading to formation of the DSV, or (b) via an abrupt forward propagation of flow reversal to the leading edge.
(ii) Trailing edge stall initiates with flow reversal near the trailing edge. The reverse flow region gradually expands as the separation location moves upstream with increasing angle of attack. Once the separation point reaches close to the leading edge, the reverse flow region covers most of the airfoil. The DSV then forms at the leading edge and convects downstream and away from the airfoil.
(iii) Thin airfoil stall is said to occur when the LSB progressively lengthens and covers the entire airfoil.
(iv) Mixed stall can occur in two ways: (a) flow separation occurs simultaneously near the leading and trailing edges and the separation points move toward each other and merge near mid-chord, or (b) flow separation occurs near mid-chord, the separation point subsequently bifurcates with one branch moving upstream and the other downstream.
In the experiments involving pitching airfoils, Carr et al. (Reference Carr, McAlister and McCroskey1977) noted three distinct mechanisms of dynamic-stall onset: (i) trailing edge separation that gradually moves upstream and reaches the leading edge, (ii) bursting of the laminar separation bubble and (iii) turbulent separation near the leading edge. The test parameters included frequency and amplitude of oscillation, Reynolds number and airfoil leading edge modification. While the mechanism of stall onset was sensitive to the parameters tested, the qualitative behaviour after stall onset was found to remain unchanged.
Mulleners & Raffel (Reference Mulleners and Raffel2012) used particle image velocimetry and unsteady surface pressure measurements to investigate the phenomenology of dynamic stall focusing particularly on stall onset in a harmonically oscillating OA209 airfoil. The measured time-resolved velocity field was investigated using the proper orthogonal decomposition (POD) and finite-time Lyapunov exponents (FTLE) (Haller Reference Haller2002) techniques to identify the onset of dynamic stall. Mulleners & Raffel (Reference Mulleners and Raffel2012) used an instantaneous ‘effective unsteadiness’ parameter, which is equal to the rate of change of angle of attack at the static-stall angle, and observed that dynamic-stall onset was promoted by increasing unsteadiness. Using these time-resolved measurements, Mulleners & Raffel (Reference Mulleners and Raffel2013) analysed the shear layer behaviour and subdivided the stall development stage into a primary instability stage followed by a vortex formation stage. The overall stall delay was found to be the sum of the time delays in the two stages; the delay associated with the primary instability was found to decrease with increasing unsteadiness and was correlated with the minimum surface pressure while the delay associated with vortex formation stage remained unaffected.
A good understanding of the viscous flow phenomena in the boundary layer at stall onset is critical to mitigating dynamic stall. The very high spatial and temporal refinement required to resolve these viscous flow features have, until recently, precluded simulations and experiments from explaining stall onset. Very high-resolution, wall-resolved simulations are used in this paper to shed light on the boundary layer flow physics that occurs during the stall process, with a focus on stall onset. In particular, we investigate the effect of airfoil thickness. The results presented in this paper show that airfoil thickness can alter the stall onset mechanism. A similar change in stall onset mechanism has been observed experimentally by Heine et al. (Reference Heine, Mulleners, Joubert and Raffel2013) when using passive disturbance generators (small cylinders projecting out of the leading edge) to delay dynamic stall on the OA209 airfoil.
Considering that airfoils used in wind turbines have very high thickness-to-chord ratio and they regularly experience dynamic stall due to unsteadiness induced by rotor rotation and operation in the atmospheric boundary layer, the investigation carried out here has important implications for the wind energy industry. Even so, research on this particular topic, particularly using high fidelity computational modelling, has been scarce. Experimental investigations have been conducted in recent years to assess dynamic-stall mitigation capability of active flow control techniques for thick airfoils: using steady blowing (Müller-Vahl et al.
Reference Müller-Vahl, Strangfeld, Nayeri, Paschereit and Greenblatt2014) and unsteady blowing (Müller-Vahl et al.
Reference Müller-Vahl, Nayeri, Paschereit and Greenblatt2016). In these studies, slot blowing was explored using unsteady surface pressure and particle image velocimetry measurements above the suction surface. Blowing from a slot at mid-chord (
 $x/c=50\,\%$
) was found to be effective in suppressing trailing edge stall but not leading edge separation; both of these were effectively suppressed with blowing from a slot location near the airfoil leading edge (
 $x/c=5\,\%$
). High-momentum steady blowing was found to be effective in suppressing boundary layer separation, although low-momentum injection destabilized the boundary layer. Although these experiments were conducted on a thick airfoil (NACA 0018), they did not explore the change in boundary layer physics due to airfoil thickness.
The limited prediction/modelling work available in the literature on this topic has been on developing reduced-order models. For example, Larsen et al. (Reference Larsen, Nielsen and Krenk2007) investigates the effects of airfoil thickness on dynamic stall using a semi-analytical model developed specifically for wind turbine airfoils, which have a high thickness-to-chord ratio. Airfoil thickness is accounted for in the model via the static lift/drag airfoil polars. The semi-analytical model predicts minor changes to the dynamic-stall predictions due to airfoil thickness. The simplicity of the model does not allow it to capture the flow effects observed in the simulations presented in this paper. The extreme resolution of the present simulations allow detailed examination of boundary layer flow physics and investigation of stall onset mechanisms. The results of this paper may also serve as a database to improve semi-analytical dynamic stall models in the future to account for airfoil thickness.
2 Methodology
The extensively validated compressible Navier–Stokes solver, FDL3DI (Visbal & Gaitonde Reference Visbal and Gaitonde2002) is used for the fluid flow simulations. FDL3DI solves the full, unfiltered Navier–Stokes equations on curvilinear meshes. The solver can work with multi-block overset (Chimera) meshes with high-order interpolation methods that extend the spectral-like accuracy of the solver to complex geometries. The solver can be run in a large eddy simulation (LES) mode with the effect of sub-grid scale stresses modelled implicitly via spatial filtering to remove the energy at the unresolved scales. Discriminating, high-order, low-pass spatial filters are implemented that regularize the procedure without excessive dissipation. The implicit LES approach has been compared elsewhere against the traditional LES approach of explicitly modelling sub-grid scale (SGS) stresses, and found to be give results of equal or better quality (see e.g. Li & Wang (Reference Li and Wang2016) and Garmann, Visbal & Orkwis (Reference Garmann, Visbal and Orkwis2013a )).
2.1 Governing equations
The governing fluid flow equations (solved by FDL3DI), after performing a time-invariant curvilinear coordinate transform from physical coordinates
 $(x,y,z,t)$
to computational coordinates
 $(\unicode[STIX]{x1D709},\unicode[STIX]{x1D702},\unicode[STIX]{x1D701},\unicode[STIX]{x1D70F})$
, are written in a strong conservation form as
 $$\begin{eqnarray}\displaystyle {\displaystyle \frac{\unicode[STIX]{x2202}}{\unicode[STIX]{x2202}t}}\left(\frac{\boldsymbol{Q}}{J}\right)+{\displaystyle \frac{\unicode[STIX]{x2202}\hat{\boldsymbol{F}}_{I}}{\unicode[STIX]{x2202}\unicode[STIX]{x1D709}}}+{\displaystyle \frac{\unicode[STIX]{x2202}\hat{\boldsymbol{G}}_{I}}{\unicode[STIX]{x2202}\unicode[STIX]{x1D702}}}+{\displaystyle \frac{\unicode[STIX]{x2202}\hat{\boldsymbol{H}}_{I}}{\unicode[STIX]{x2202}\unicode[STIX]{x1D701}}}=\frac{1}{Re}\left[{\displaystyle \frac{\unicode[STIX]{x2202}\hat{\boldsymbol{F}}_{v}}{\unicode[STIX]{x2202}\unicode[STIX]{x1D709}}}+{\displaystyle \frac{\unicode[STIX]{x2202}\hat{\boldsymbol{G}}_{v}}{\unicode[STIX]{x2202}\unicode[STIX]{x1D702}}}+{\displaystyle \frac{\unicode[STIX]{x2202}\hat{\boldsymbol{H}}_{v}}{\unicode[STIX]{x2202}\unicode[STIX]{x1D701}}}\right], & & \displaystyle\end{eqnarray}$$
where
 $J=\unicode[STIX]{x2202}(\unicode[STIX]{x1D709},\unicode[STIX]{x1D702},\unicode[STIX]{x1D701},\unicode[STIX]{x1D70F})/\unicode[STIX]{x2202}(x,y,z,t)$
is the Jacobian of the coordinate transformation,
 $\boldsymbol{Q}=\{\unicode[STIX]{x1D70C},\unicode[STIX]{x1D70C}u,\unicode[STIX]{x1D70C}v,\unicode[STIX]{x1D70C}w,\unicode[STIX]{x1D70C}E\}$
; the inviscid flux terms,
 $\hat{\boldsymbol{F}}_{I},\hat{\boldsymbol{G}}_{I},\hat{\boldsymbol{H}}_{I}$
are
 $$\begin{eqnarray}\displaystyle \left.\begin{array}{@{}c@{}}\hat{\boldsymbol{F}}_{I}=\left[\begin{array}{@{}c@{}}\unicode[STIX]{x1D70C}\hat{U} \\ \unicode[STIX]{x1D70C}u\hat{U} +\hat{\unicode[STIX]{x1D709}}_{x}p\\ \unicode[STIX]{x1D70C}v\hat{U} +\hat{\unicode[STIX]{x1D709}}_{y}p\\ \unicode[STIX]{x1D70C}w\hat{U} +\hat{\unicode[STIX]{x1D709}}_{z}p\\ (\unicode[STIX]{x1D70C}E+p)\hat{U} -\hat{\unicode[STIX]{x1D709}}_{t}p\end{array}\right],\quad \hat{\boldsymbol{G}}_{I}=\left[\begin{array}{@{}c@{}}\unicode[STIX]{x1D70C}\hat{V}\\ \unicode[STIX]{x1D70C}v\hat{V}+\hat{\unicode[STIX]{x1D702}}_{x}p\\ \unicode[STIX]{x1D70C}v\hat{V}+\hat{\unicode[STIX]{x1D702}}_{y}p\\ \unicode[STIX]{x1D70C}w\hat{V}+\hat{\unicode[STIX]{x1D702}}_{z}p\\ (\unicode[STIX]{x1D70C}E+p)\hat{V}-\hat{\unicode[STIX]{x1D702}}_{t}p\end{array}\right],\\ \hat{\boldsymbol{H}}_{I}=\left[\begin{array}{@{}c@{}}\unicode[STIX]{x1D70C}{\hat{W}}\\ \unicode[STIX]{x1D70C}u{\hat{W}}+\hat{\unicode[STIX]{x1D701}}_{x}p\\ \unicode[STIX]{x1D70C}v{\hat{W}}+\hat{\unicode[STIX]{x1D701}}_{y}p\\ \unicode[STIX]{x1D70C}w{\hat{W}}+\hat{\unicode[STIX]{x1D701}}_{z}p\\ (\unicode[STIX]{x1D70C}E+p){\hat{W}}-\hat{\unicode[STIX]{x1D701}}_{t}p\end{array}\right],\end{array}\right\} & & \displaystyle\end{eqnarray}$$
where,
 $$\begin{eqnarray}\displaystyle \left.\begin{array}{@{}c@{}}\displaystyle \hat{U} =\hat{\unicode[STIX]{x1D709}}_{t}+\hat{\unicode[STIX]{x1D709}}_{x}u+\hat{\unicode[STIX]{x1D709}}_{y}v+\hat{\unicode[STIX]{x1D709}}_{z}w,\\ \displaystyle \hat{V}=\hat{\unicode[STIX]{x1D702}}_{t}+\hat{\unicode[STIX]{x1D702}}_{x}u+\hat{\unicode[STIX]{x1D702}}_{y}v+\hat{\unicode[STIX]{x1D702}}_{z}w,\\ \displaystyle {\hat{W}}=\hat{\unicode[STIX]{x1D701}}_{t}+\hat{\unicode[STIX]{x1D701}}_{x}u+\hat{\unicode[STIX]{x1D701}}_{y}v+\hat{\unicode[STIX]{x1D701}}_{z}w,\\ \displaystyle \unicode[STIX]{x1D70C}E=\frac{p}{\unicode[STIX]{x1D6FE}-1}+\frac{1}{2}\unicode[STIX]{x1D70C}(u^{2}+v^{2}+w^{2}).\end{array}\right\} & & \displaystyle\end{eqnarray}$$
In the above,
 $\hat{\unicode[STIX]{x1D709}}_{(x,y,z)}=J^{-1}\unicode[STIX]{x2202}\unicode[STIX]{x1D709}/\unicode[STIX]{x2202}(x,y,z)$
, and
 $u,v,w$
are the components of the velocity vector in Cartesian coordinates, and
 $\unicode[STIX]{x1D70C},p,T$
are respectively the fluid density, pressure and temperature. The gas is assumed to be perfect,
 $p=\unicode[STIX]{x1D70C}T/\unicode[STIX]{x1D6FE}M_{\infty }^{2}$
. The viscous flux terms,
 $\hat{\boldsymbol{F}}_{v},\hat{\boldsymbol{G}}_{v},\hat{\boldsymbol{H}}_{v}$
are provided in Visbal & Rizzetta (Reference Visbal and Rizzetta2002).
2.2 Numerical scheme
Finite differencing is used to discretize the governing equations. Space is discretized using a sixth-order compact difference scheme (Lele Reference Lele1992). Time integration is performed using an implicit, approximately factored procedure described in Visbal & Gaitonde (Reference Visbal and Gaitonde2002). Spatial derivatives of any scalar
 $\unicode[STIX]{x1D719}$
are obtained in the computational space (
 $\unicode[STIX]{x1D709},\unicode[STIX]{x1D702},\unicode[STIX]{x1D701}$
) by solving the tri-diagonal system
 $$\begin{eqnarray}\displaystyle \unicode[STIX]{x1D6FC}\unicode[STIX]{x1D719}_{i-1}^{\prime }+\unicode[STIX]{x1D719}_{i}^{\prime }+\unicode[STIX]{x1D6FC}\unicode[STIX]{x1D719}_{i+1}^{\prime }=\unicode[STIX]{x1D6FD}\frac{\unicode[STIX]{x1D719}_{i+2}-\unicode[STIX]{x1D719}_{i-2}}{4}+\unicode[STIX]{x1D6FE}\frac{\unicode[STIX]{x1D719}_{i+1}-\unicode[STIX]{x1D719}_{i-1}}{2}, & & \displaystyle\end{eqnarray}$$
where
 $\unicode[STIX]{x1D6FC}=1/3,~\unicode[STIX]{x1D6FE}=14/9$
and
 $\unicode[STIX]{x1D6FD}=1/9$
for sixth-order accuracy. Equation (2.4) is a central scheme which works in the interior of the domain; for points near the physical and inter-processor boundaries, one-sided differences are used. Neumann boundary conditions, such as
 $\unicode[STIX]{x2202}p/\unicode[STIX]{x2202}n=0$
, are implemented using fourth-order one-sided differences. Inviscid fluxes are computed at the node points using (2.4). Viscous terms are computed by differentiating the primitive variables, constructing the viscous flux terms, and then differentiating the flux terms using (2.4) at the node points.
Since the grid is designed to resolve large, energy-containing eddies (and not for direct numerical simulations), the content not resolved by the grid (high wavenumbers) has to be removed from the solution. In traditional LES, this is achieved via sub-grid scale (SGS) models. In the current simulations, this objective is achieved by filtering the solution at every sub-iteration during time integration using the following low-pass, high-order filtering procedure. Denoting a component of the solution vector (a conserved flow variable) by
 $\unicode[STIX]{x1D719}$
, its filtered value
 $\hat{\unicode[STIX]{x1D719}}$
is obtained by solving the following system of equations:
 $$\begin{eqnarray}\displaystyle \unicode[STIX]{x1D6FC}_{f}\hat{\unicode[STIX]{x1D719}}_{i-1}+\hat{\unicode[STIX]{x1D719}}_{i}+\unicode[STIX]{x1D6FC}_{f}\hat{\unicode[STIX]{x1D719}}_{i+1}=\mathop{\sum }_{n=0}^{N}\frac{a_{n}}{2}(\unicode[STIX]{x1D719}_{i+n}+\unicode[STIX]{x1D719}_{i-n}), & & \displaystyle\end{eqnarray}$$
where a proper choice of the coefficients,
 $a_{n}$
as functions of
 $\unicode[STIX]{x1D6FC}_{f}$
, with
 $n$
ranging from
 $1$
to
 $N$
, results in a
 $2N$
th-order accurate filtering scheme with a
 $2N+1$
-size stencil;
 $\unicode[STIX]{x1D6FC}_{f}$
is a free variable that provides additional control on the degree of filtering achieved for a given order. Similar to the implementation of spatial derivatives, one-sided filtering formulae are used near the boundaries. While the central scheme of (2.5) is always dissipative, care needs to be exercised with one-sided filtering formulae as these can amplify certain wavenumbers and make the solution unstable. In the current simulations, an eighth-order filter with
 $\unicode[STIX]{x1D6FC}_{f}=0.4$
is used in the interior points.
3 Grid system and boundary conditions
The simulations are carried out at a chord-based Reynolds number,
 $Re_{c}=200\,000$
and a flow Mach number,
 $M_{\infty }=0.1$
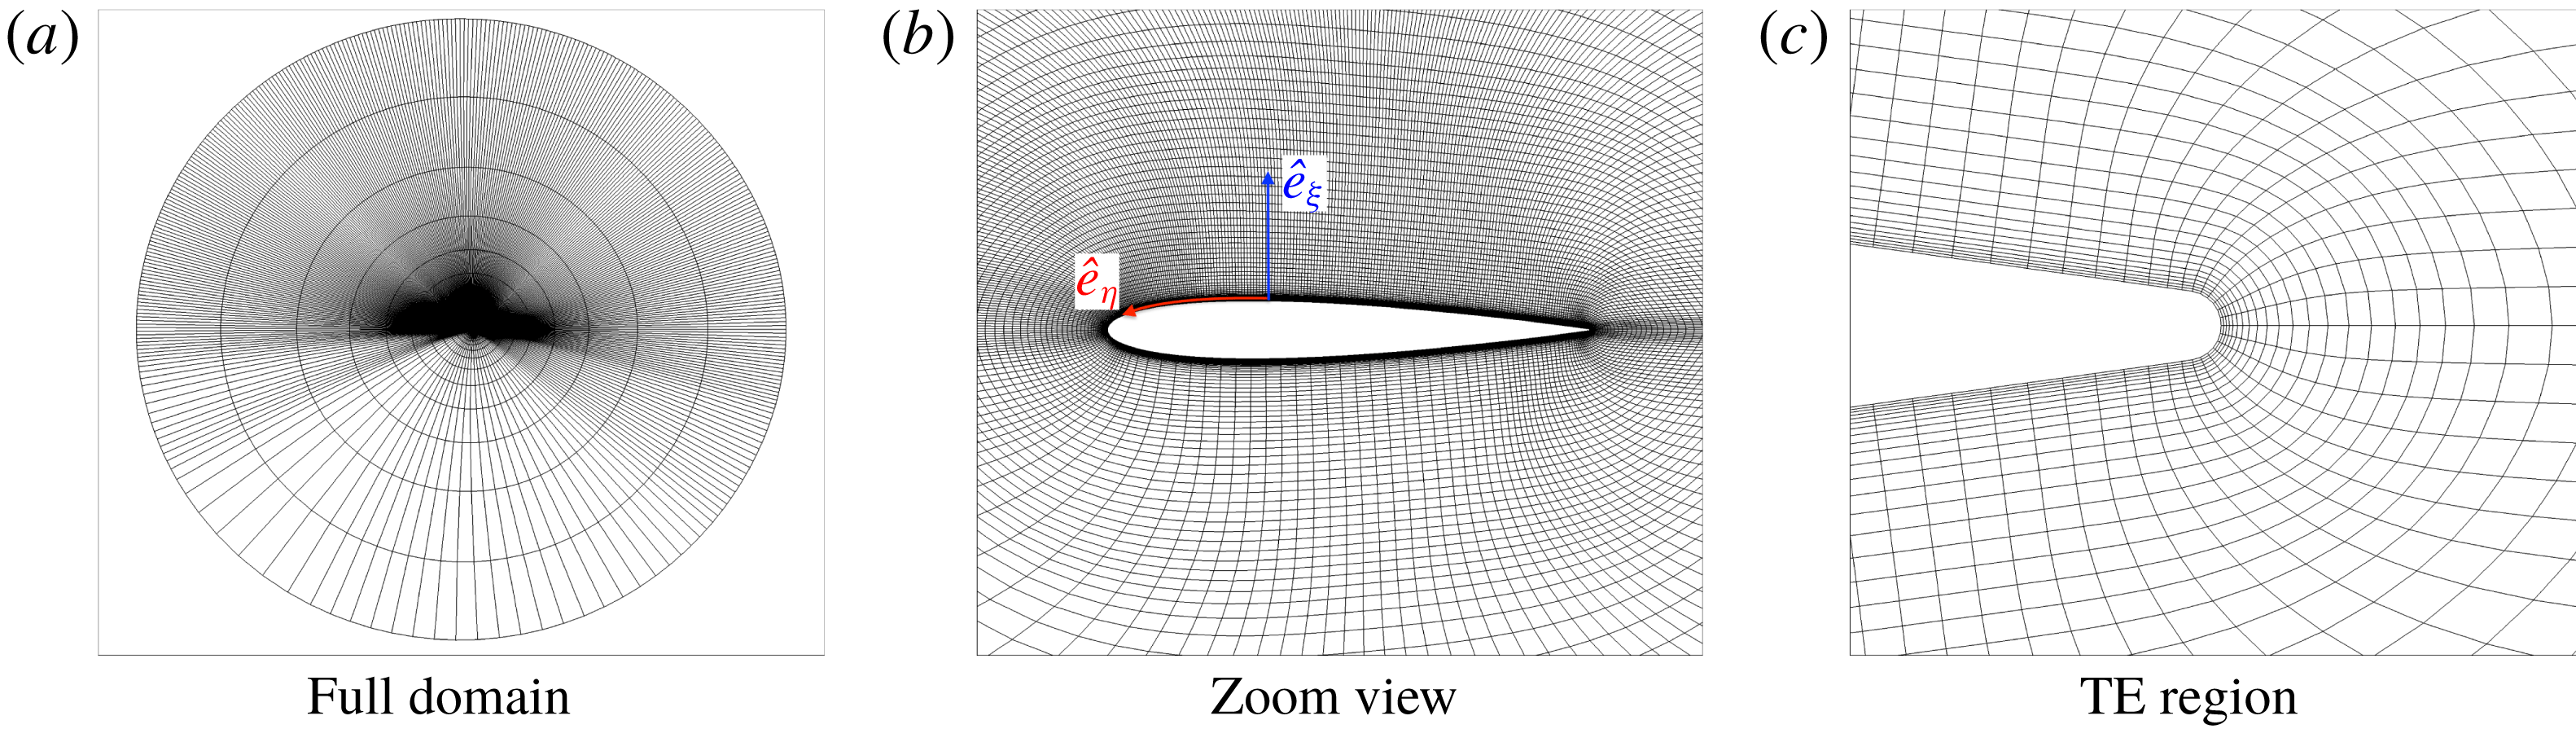
. A planar, single-block O-mesh is generated around the airfoil, which is repeated with uniform grid spacing in the span direction. The mesh is highly refined over the suction side to resolve the viscous flow phenomena expected during the airfoil pitch-up motion. Four symmetric NACA airfoils of varying thickness (9 %, 12 %, 15 % and 18 %) are investigated. Figure 1 shows three cross-sectional views of the computational mesh for one of the airfoils (NACA 0012). The boundary layer on the pressure side stays laminar and attached through most of the pitch-up manoeuver. A relatively coarse mesh is therefore sufficient to discretize the pressure side. Besides, the dynamic stall phenomenon is relatively unaffected by the pressure-side flow in the pitch-up manoeuver considered in this study.
Three views of the mesh used for the NACA 0012 simulation: (a) full computational domain, (b) zoom view of the grid around the airfoil and (c) zoom view showing the trailing edge (TE) geometry and resolution. Every fifth and every fourth point in the radial and circumferential directions respectively are shown for clarity.

The O-grid in the physical space (
 $x,y,z$
) maps to an H-grid in the computational domain (
 $\unicode[STIX]{x1D709},\unicode[STIX]{x1D702},\unicode[STIX]{x1D701}$
). The following orientation is used:
 $\hat{\boldsymbol{e}}_{\unicode[STIX]{x1D709}}$
points radially out,
 $\hat{\boldsymbol{e}}_{\unicode[STIX]{x1D702}}$
is in the circumferential direction. Figure 1(b) shows the orientation of
 $\hat{e}_{\unicode[STIX]{x1D709}}$
and
 $\hat{e}_{\unicode[STIX]{x1D702}}$
;
 $\hat{\boldsymbol{e}}_{\unicode[STIX]{x1D701}}$
is along the span direction such that the right-hand rule,
 $\hat{\boldsymbol{e}}_{\unicode[STIX]{x1D701}}=\hat{\boldsymbol{e}}_{\unicode[STIX]{x1D709}}\times \hat{\boldsymbol{e}}_{\unicode[STIX]{x1D702}}$
is obeyed.
The same distribution of points around the airfoil is used for the four airfoils simulated. The same stretching ratios are used to extrude the airfoil surface grid (along the surface normal direction) to obtain a two-dimensional (2-D) O-grid. This grid is then repeated in the span direction to obtain the final 3-D grid for each airfoil. Appendix A presents the results of a mesh sensitivity study for a constant-rate pitching airfoil. The mesh for the NACA 0012 airfoil used in this study corresponds to the ‘Fine’ mesh in appendix A.
Periodic boundary conditions on the
 $\unicode[STIX]{x1D702}$
boundaries simulate the continuity in the physical space around the airfoil. Periodicity is also imposed at the boundaries in the span direction (
 $\hat{\boldsymbol{e}}_{\unicode[STIX]{x1D701}}$
). Periodic boundary conditions are implemented using the overset grid approach in FDL3DI. A minimum of five-point overlap is required by FDL3DI to ensure high-order accurate interpolation between individual meshes. A five-point overlap is therefore built into the mesh. Similar overlaps are created automatically in FDL3DI between sub-blocks when domain decomposition is used to split each block into multiple sub-blocks for parallel execution. The airfoil surface is a no-slip wall. Free-stream conditions are prescribed at the outer boundary which is about 100 chords away from the airfoil. The filtering procedure removes all perturbations as the mesh becomes coarse away from the airfoil to the far-field boundary.
The span of the simulated airfoil geometries is equal to ten per cent of the airfoil chord length. One of the key concerns in finite-span simulations with periodic span boundaries is the possibility of ‘self’-influencing of the solution. This is assessed in appendix B. The analysis shows that span length of 10 % chord is adequate to simulate onset of stall. Previous analysis by Visbal & Garmann (Reference Visbal and Garmann2018) has shown that finite-span effects are important only beyond the lift-stall point.
4 Static simulations
The simulations are performed in two steps. In the first step, a statistically stationary solution is obtained with the airfoil set at
 $\unicode[STIX]{x1D6FC}=4^{\circ }$
. A positive
 $\unicode[STIX]{x1D6FC}$
is selected to ensure that the boundary layer on the bottom surface (pressure side) stays laminar. Dynamic simulations with airfoil motion are simulated in the second step. A constant-rate pitch-up motion is simulated with the pitching axis located at the quarter-chord point of the airfoil. Results of ‘static’ simulations for all three airfoils are presented first.
For the static simulations, the
 $x$
axis of the coordinate system is aligned with the airfoil chord and constant inflow is prescribed at the desired angle of attack (
 $\unicode[STIX]{x1D6FC}=4^{\circ }$
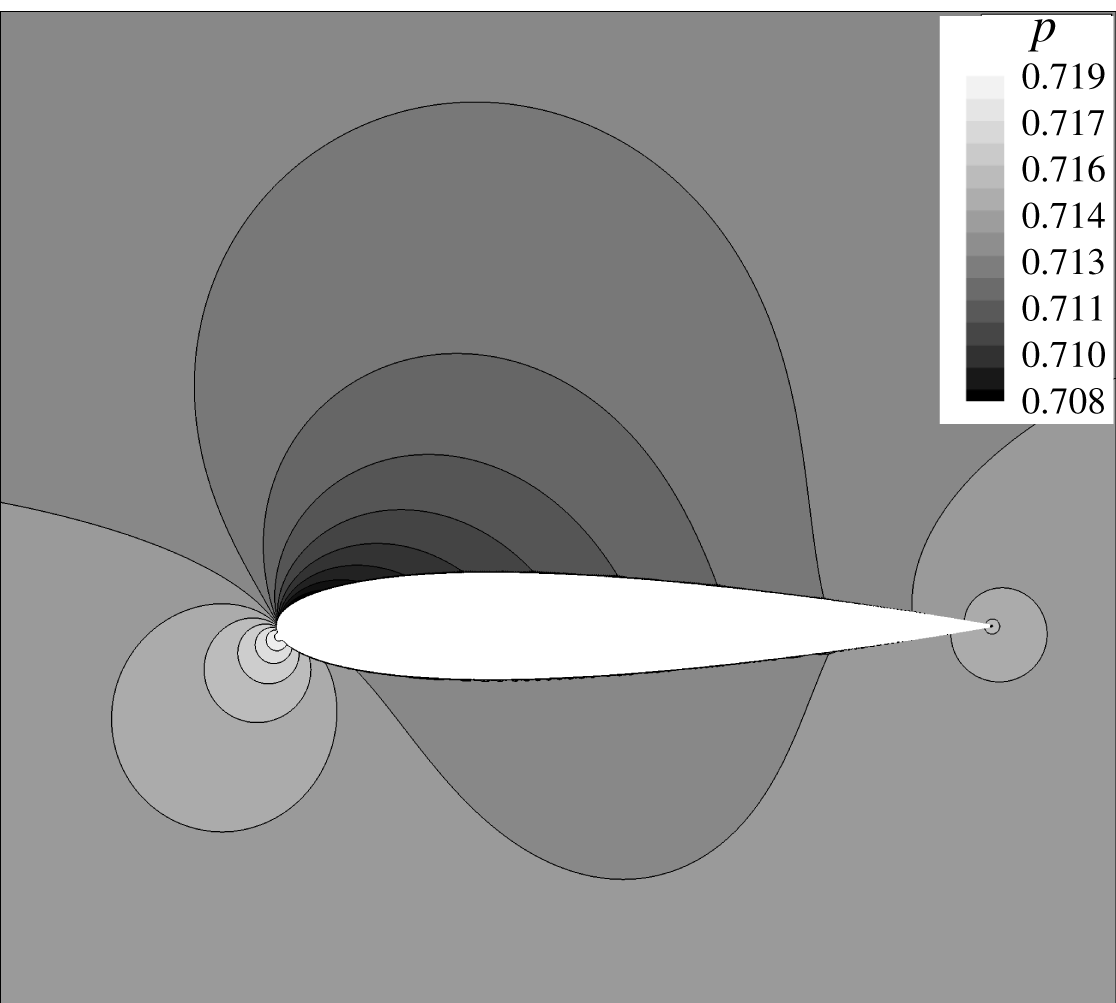
here). In order to minimize the computation time, a 2-D viscous solution is first obtained by removing the span dimension. The two-dimensional solution is computed on a grid that is reduced in the span direction to three cells, which is the minimum required by FDL3DI to compute an effectively 2-D solution. Potential flow field, obtained using an in-house vortex panel code, is prescribed as the initial condition for the 2-D viscous simulation (see figure 2). The potential solution sets the pressure and velocity distribution in the far field to be reasonably close to the final viscous solution, and avoids large pressure waves that would otherwise develop if a uniform flow field is prescribed as the initial solution. The 2-D simulation is run until integrated aerodynamic lift and drag forces converge.
Potential flow field (NACA 0015 case shown) used to initialize the static 2-D viscous simulations.

Static, three-dimensional simulations are then performed with the 2-D viscous solution repeated in span to generate the initial solution. The simulation is run until statistical convergence is reached for integrated airfoil loads, as well as for static pressure at a few point probes placed in the suction-side boundary layer.
FLD3DI has been extensively validated and used for simulating flow over static airfoils (see e.g. Garmann & Visbal (Reference Garmann and Visbal2015), Bodling & Sharma (Reference Bodling and Sharma2017, Reference Bodling and Sharma2019)) and airfoils and finite-span wings in dynamic motion Visbal (Reference Visbal2009), Garmann & Visbal (Reference Garmann and Visbal2011), Garmann, Visbal & Orkwis (Reference Garmann, Visbal and Orkwis2013b
). These have been carried out over a wide range of Reynolds numbers. Verification results for flow over a static NACA 0012 airfoil at the
 $Re_{c}$
used here (
 $=2\times 10^{5}$
) are included in this paper and discussed in the following sub-section.
4.1 Verification
Flow over an NACA 0012 airfoil at
 $\unicode[STIX]{x1D6FC}=0^{\circ }$
is simulated. Garcia-Sagrado & Hynes (Reference Garcia-Sagrado and Hynes2012) experimentally investigated this configuration to understand wall pressure sources in flow-induced sound. The article provides measurements of surface pressure spectra and boundary layer profiles at
 $Re_{c}=2\times 10^{5}$
and
 $4\times 10^{5}$
. The measurements at
 $Re_{c}=2\times 10^{5}$
are used here to compare with FDL3DI predictions. Note that the zero angle of attack is used only for this verification case; the other static simulations are performed as described above. The mesh used for the verification study is symmetric and is obtained by mirroring the suction-side mesh of figure 1 on to the pressure side.
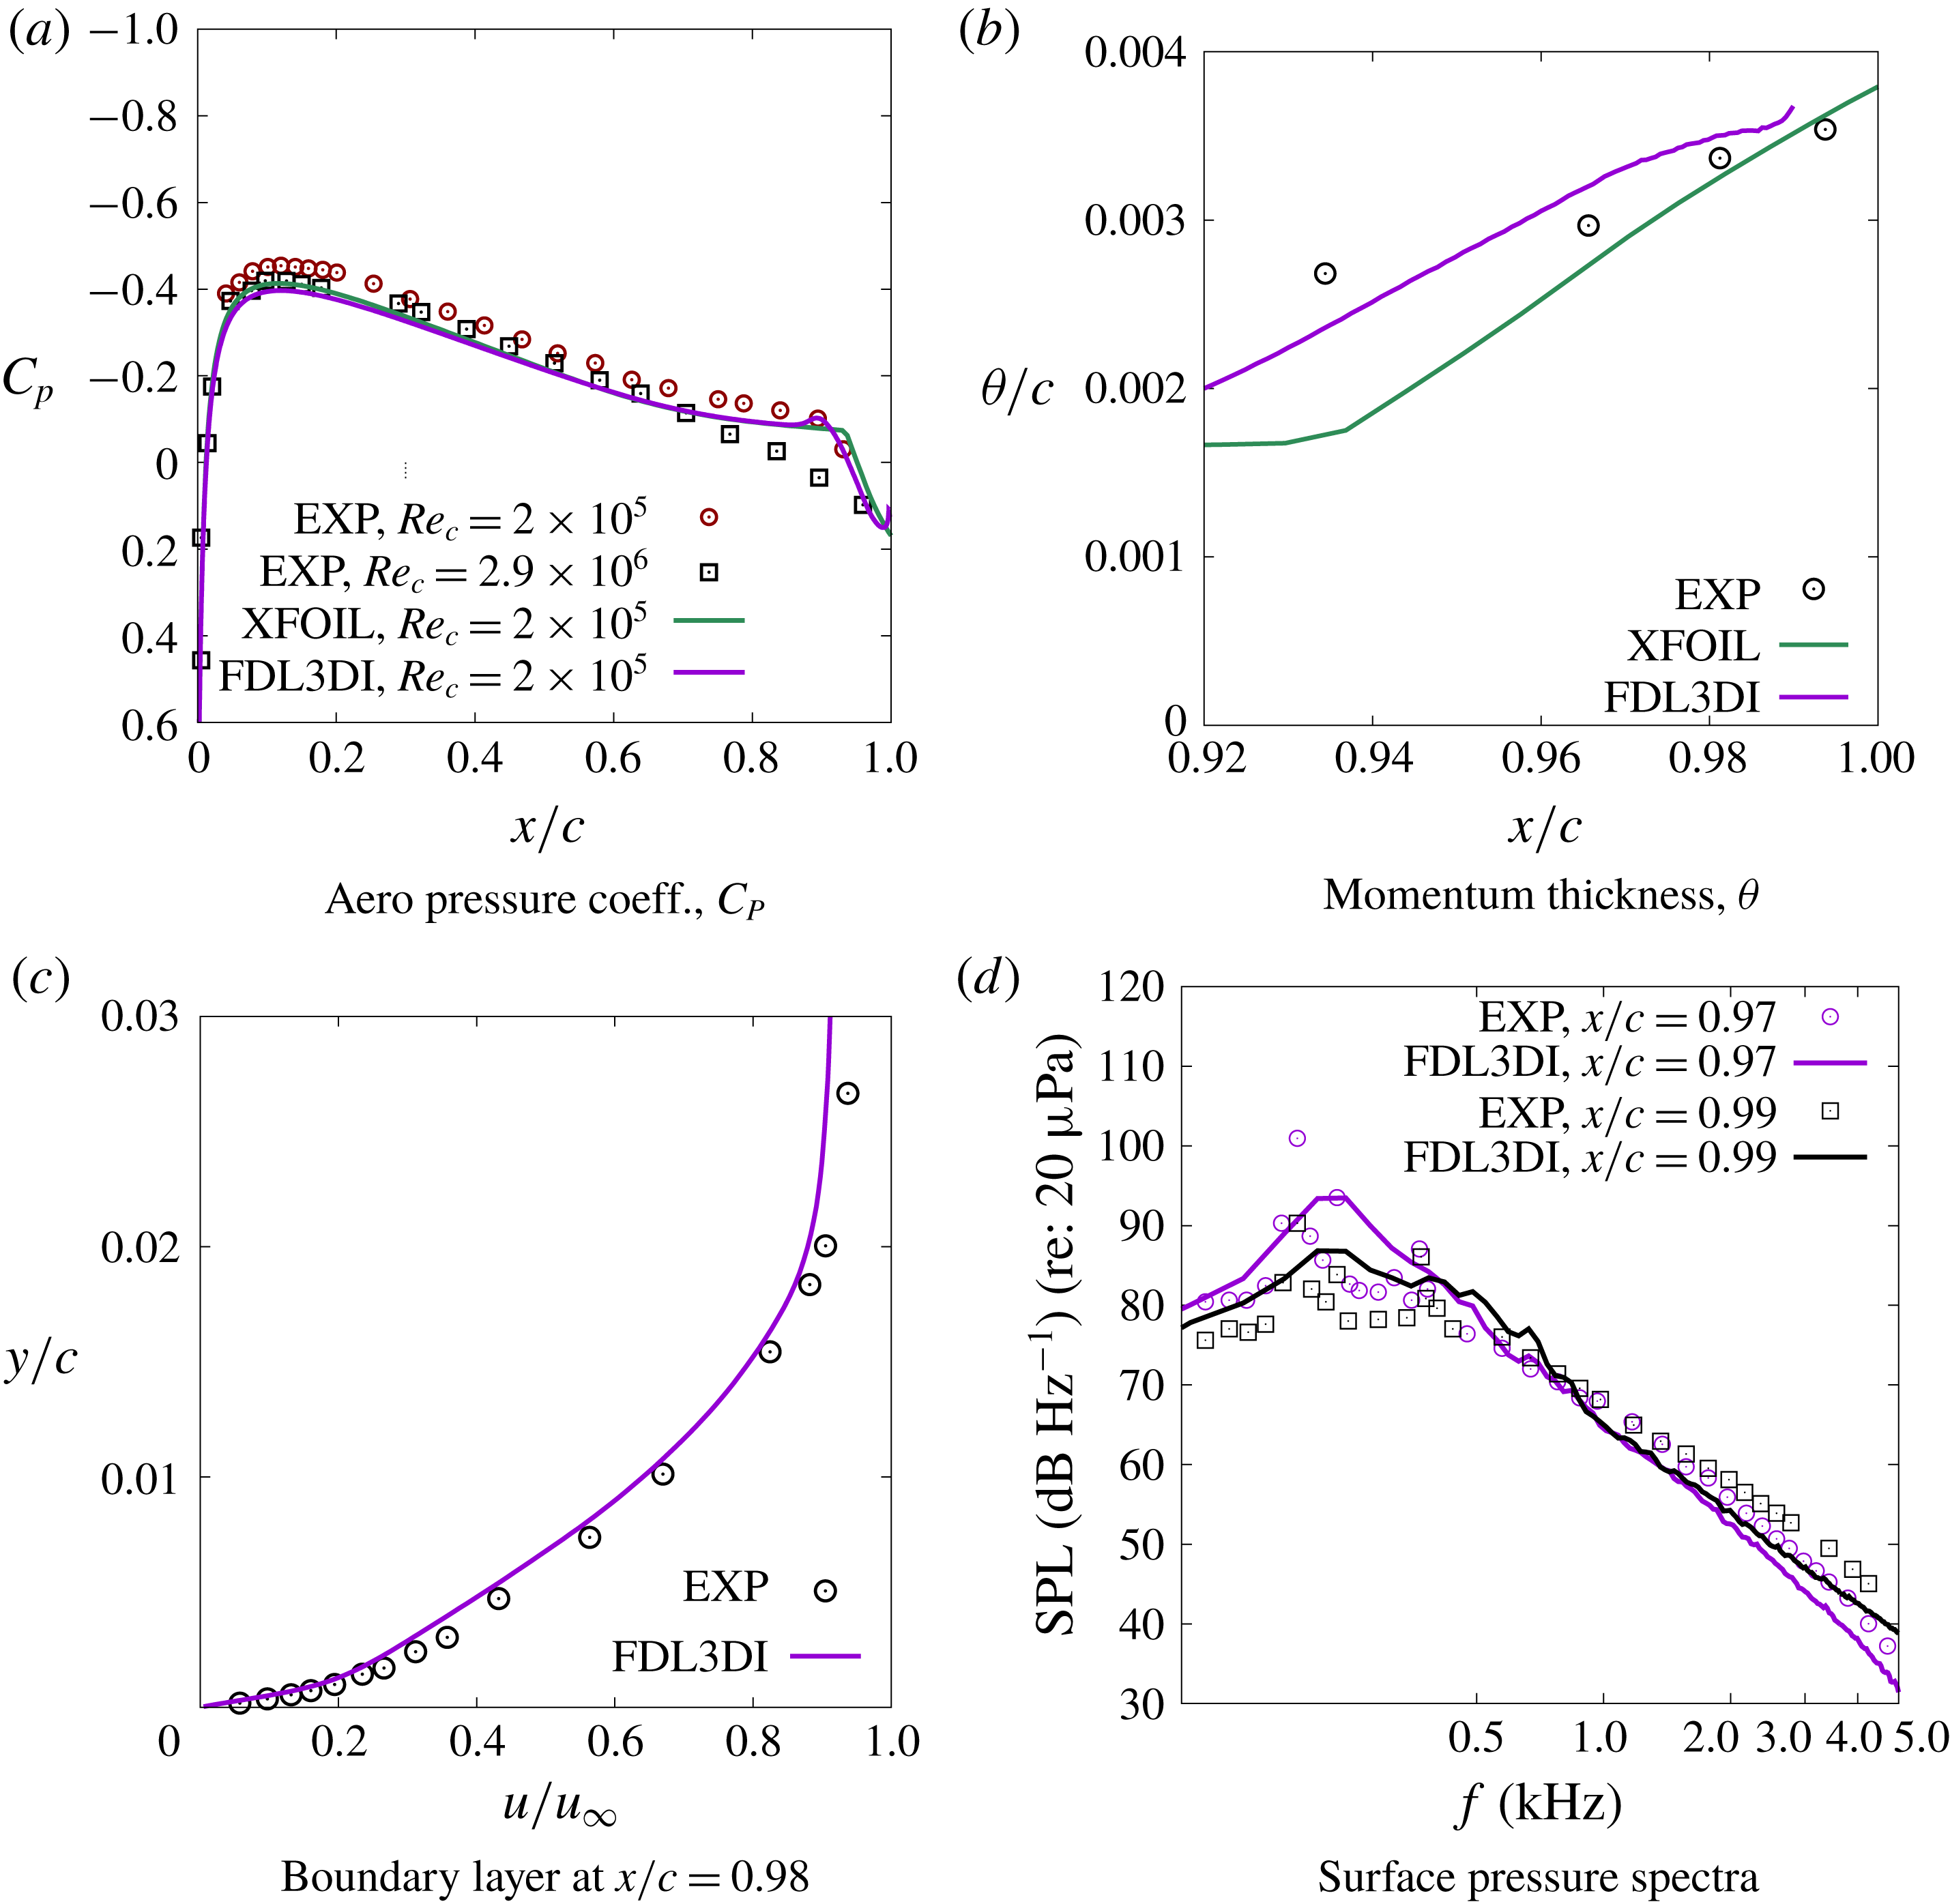
Figure 3 compares the distribution of the aerodynamic pressure coefficient,
 $C_{P}=(p-p_{\infty })/q_{\infty }$
, over the airfoil surface. Also shown are comparisons of momentum thickness (
 $\unicode[STIX]{x1D703}$
), boundary layer profile and unsteady surface pressure spectra near the trailing edge where the flow is turbulent. Favourable agreement is observed between the measured data, labelled EXP in the figure, and the FDL3DI predictions. The transition point around
 $x/c\sim 0.9$
is captured (see figure 3
a), and the boundary layer profile in the turbulent region is well predicted. The wall pressure spectra comparisons are also acceptable with a slight underprediction at high frequencies. The turbulent boundary layer region is rather small for this case. FDL3DI predictions with a similar set-up are compared against measurements at
 $Re_{c}=4\times 10^{5}$
, where the boundary layers are tripped at
 $x/c=0.5$
and thus have a much larger turbulent flow region, in Bodling & Sharma (Reference Bodling and Sharma2017).
Comparison of FDL3DI predictions against measurements from the literature. The data with the label ‘EXP’ in the legends are for
 $Re_{c}=2\times 10^{5}$
and are from Garcia-Sagrado & Hynes (Reference Garcia-Sagrado and Hynes2012). Panel (a) also contains data for
 $Re_{c}=2.9\times 10^{6}$
from Gregory & O’reilly (Reference Gregory and O’reilly1973).

XFOIL (see Drela Reference Drela1989) results are also plotted for
 $C_{P}$
and
 $\unicode[STIX]{x1D703}$
in figure 3. XFOIL is a panel method code that simultaneously solves potential flow equations with boundary integral equations. It uses the
 $e^{N}$
-type amplification formulation to determine boundary layer transition. XFOIL results are included to estimate the accuracy of XFOIL in order to perform code-to-code comparisons for the other airfoils that are considered in this paper. Measurement data for other airfoils are not easily available and a comparison with XFOIL results serves as a sanity check.
4.2 Static simulation results at
 $\unicode[STIX]{x1D6FC}=4^{\circ }$

The results of static simulations at
 $\unicode[STIX]{x1D6FC}=4^{\circ }$
are discussed in this section. Surface properties, such as aerodynamic pressure coefficient (
 $C_{P}$
) and skin friction coefficient (
 $C_{f}$
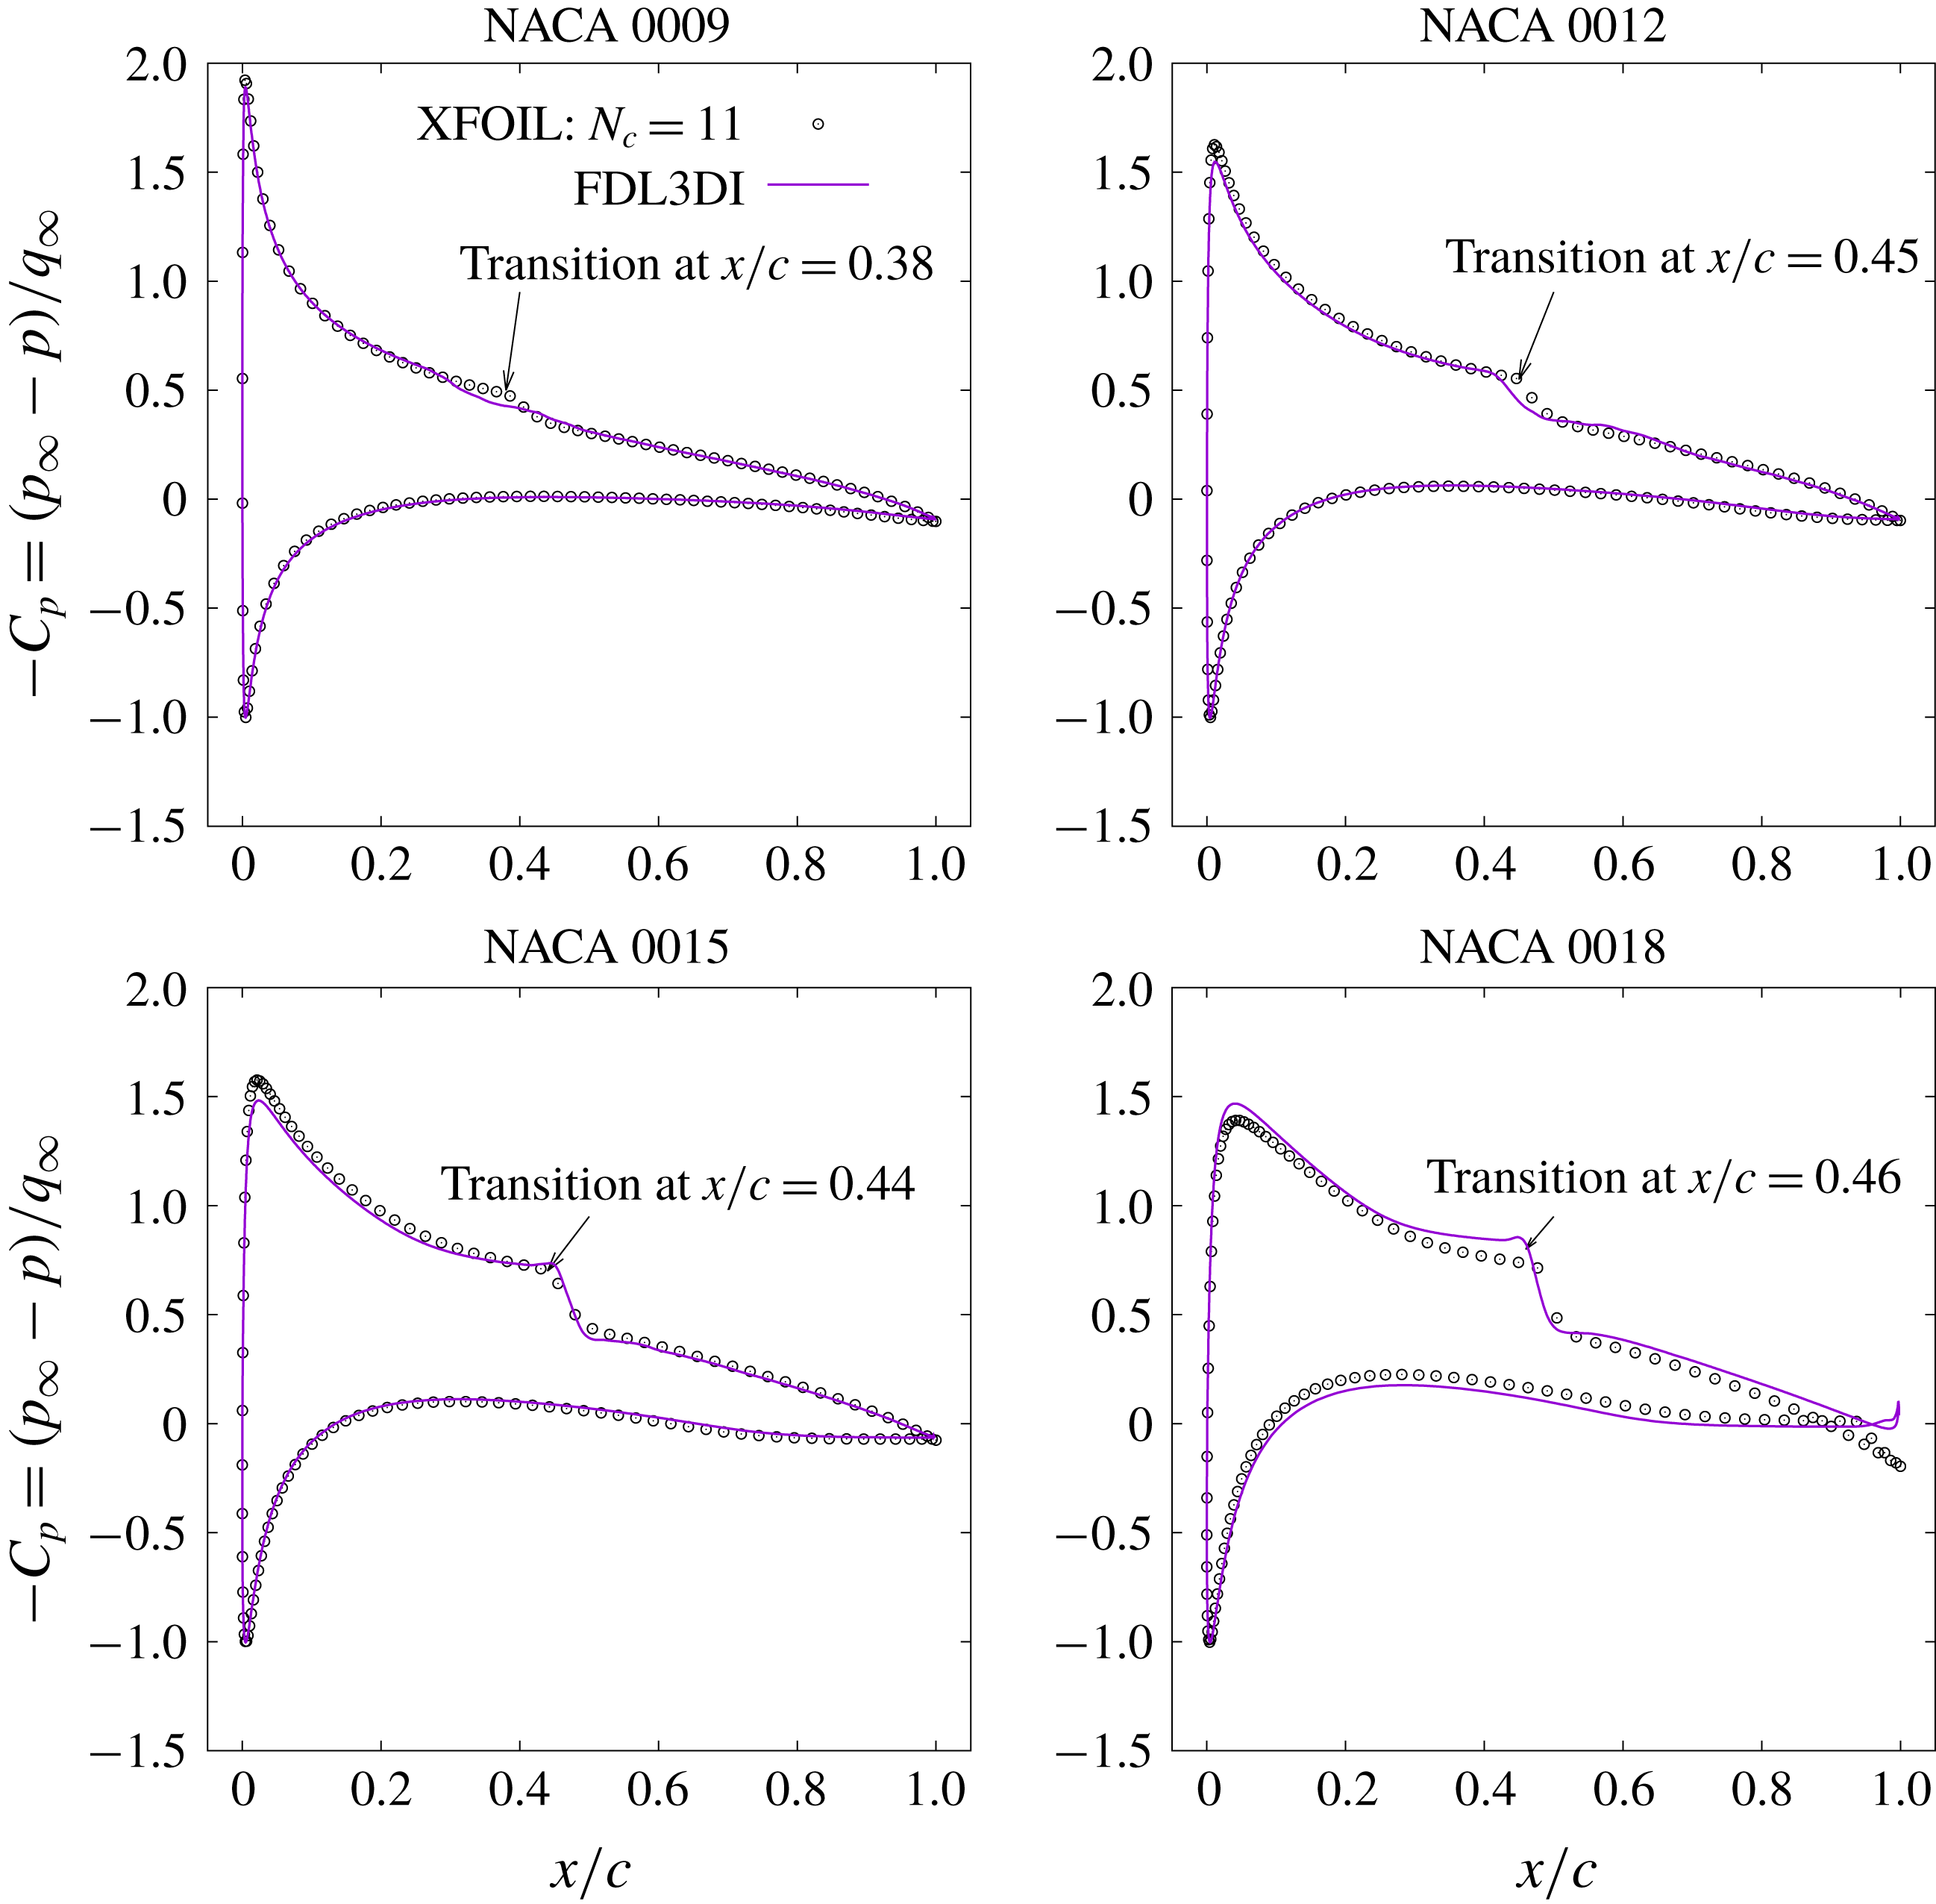
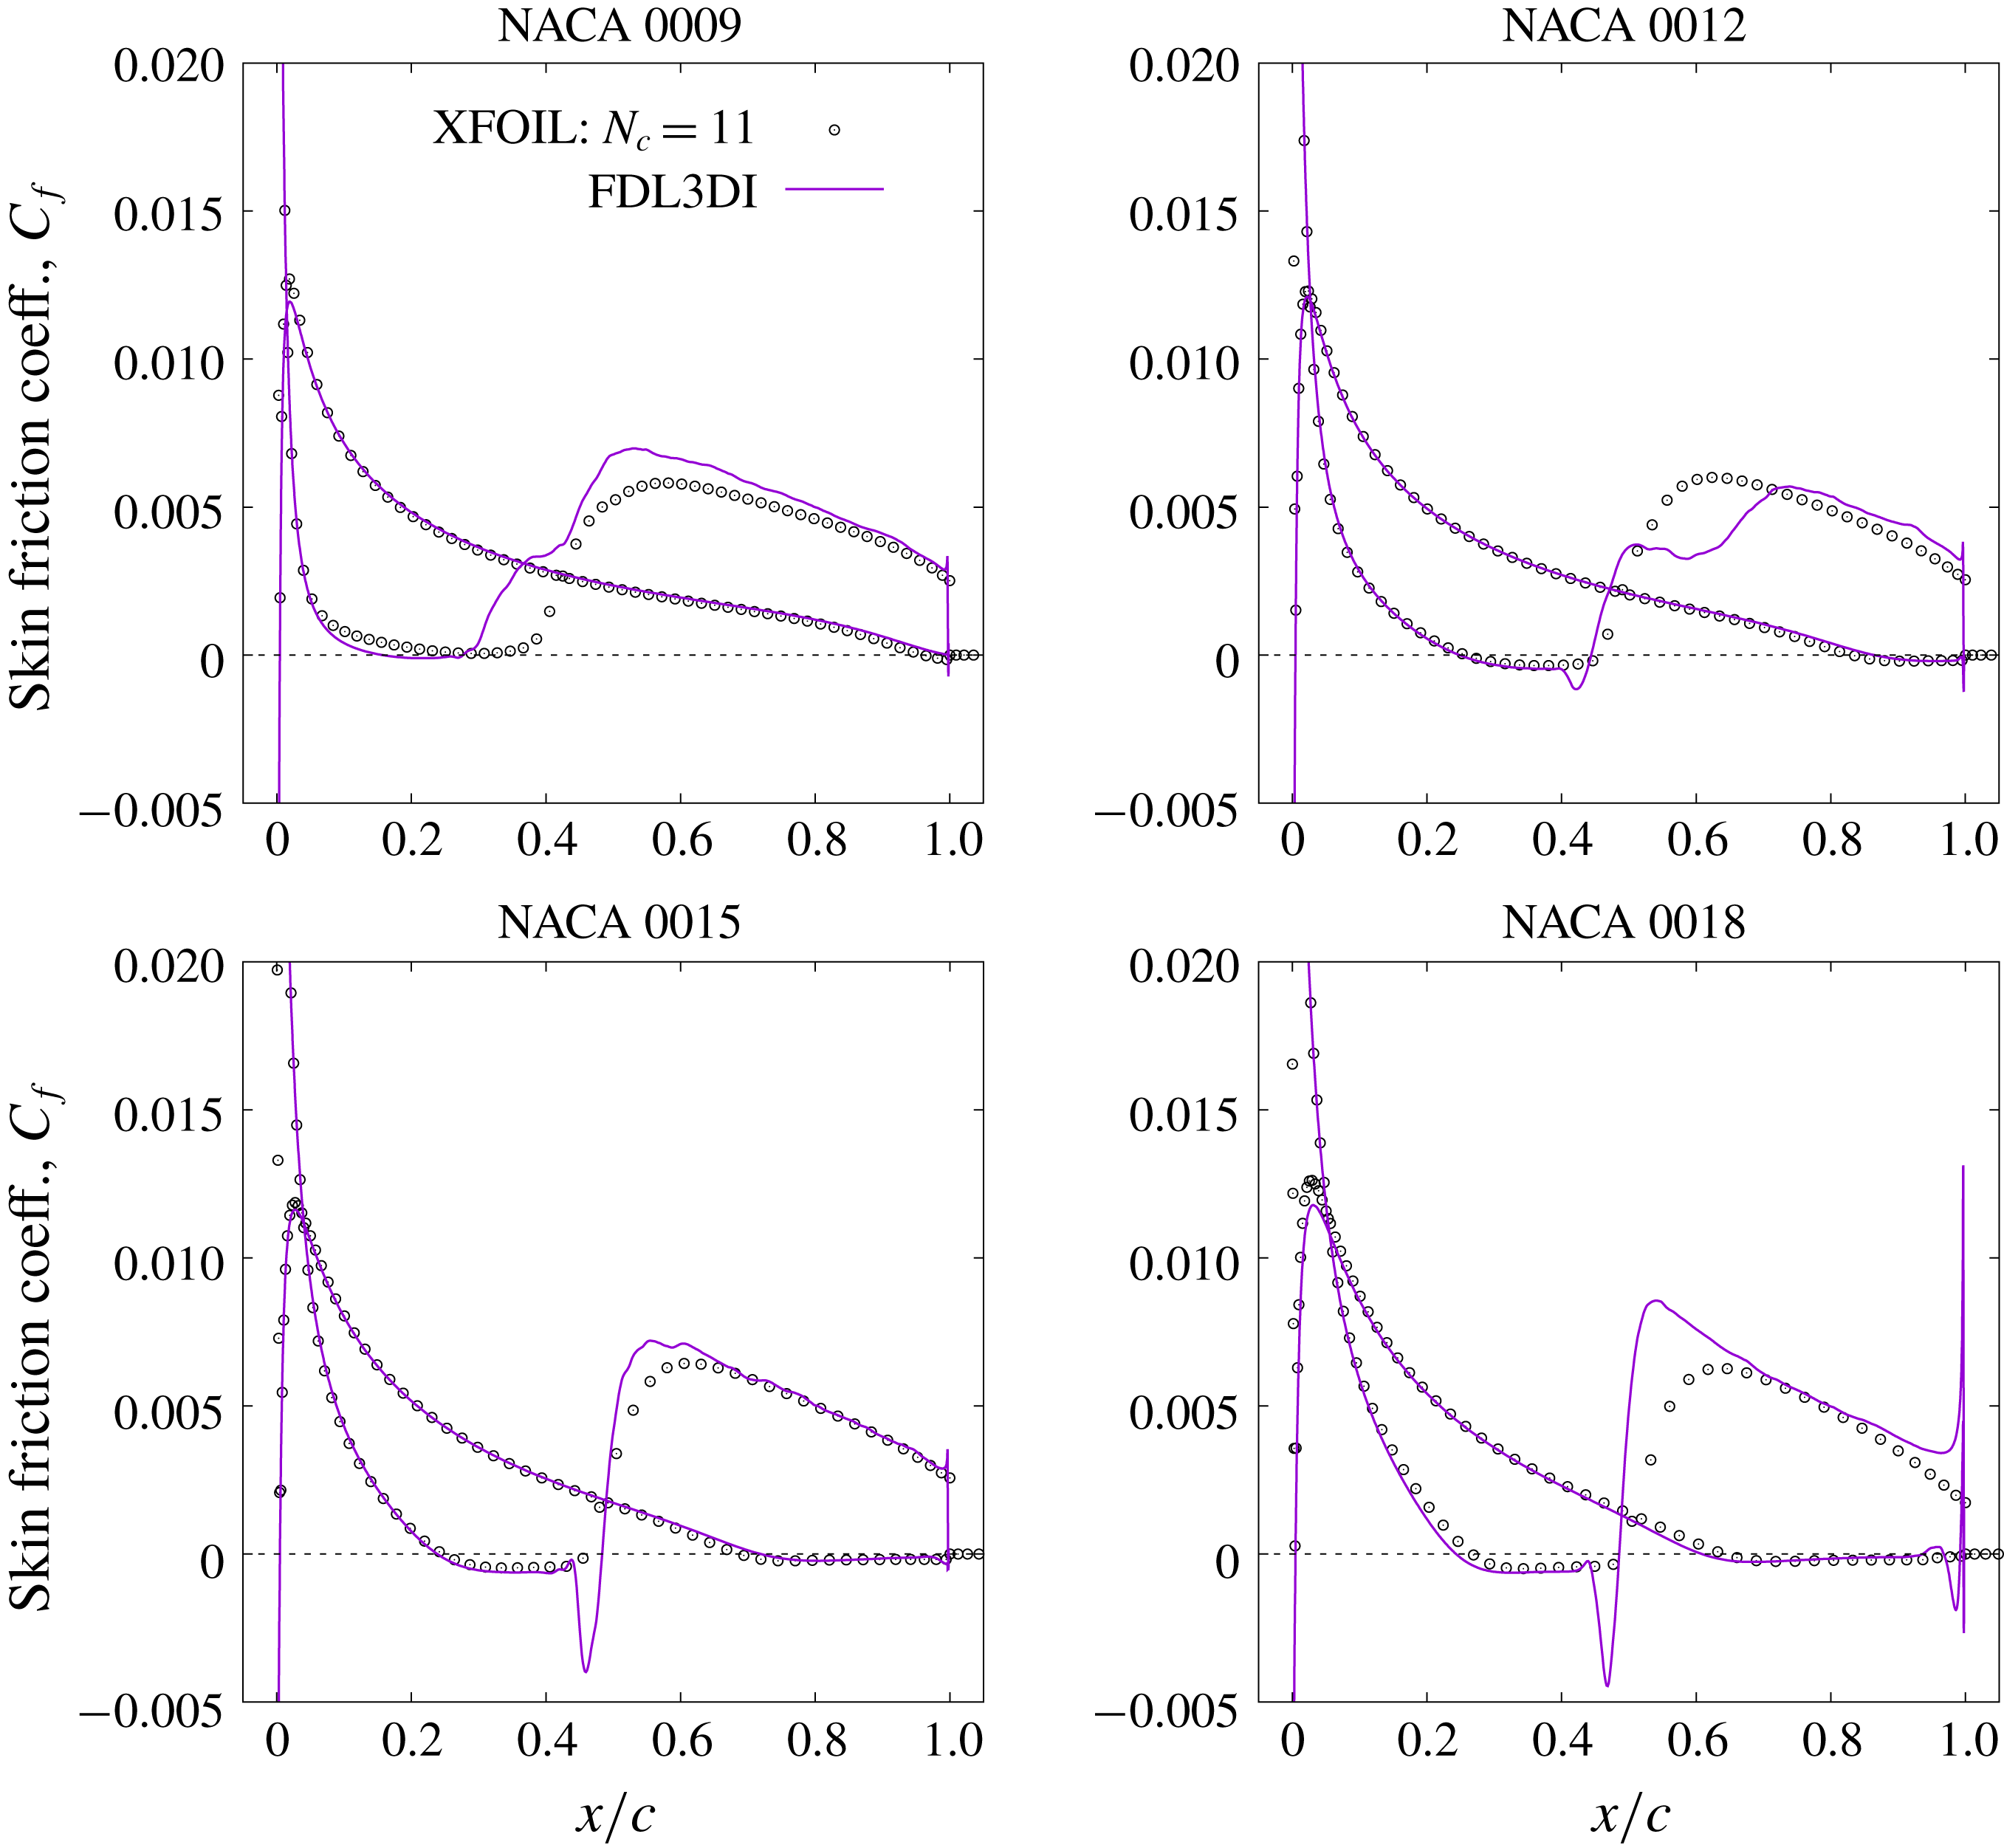
) are extracted and compared against XFOIL predictions. Figures 4 and 5 compare the FDL3DI predicted
 $C_{P}$
and
 $C_{f}$
distributions against those obtained using XFOIL for the four airfoils. The XFOIL simulations are performed with the
 $N_{crit}$
parameter set equal to 11;
 $N_{crit}$
is the natural logarithm of the amplification factor of the most-amplified wave that triggers transition. A value of 11 for
 $N_{crit}$
is appropriate for use with airfoil models tested in a ‘clean’ wind tunnel (i.e. with very low inflow turbulence). Since the inflow in FDL3DI simulations is uniform with zero turbulence,
 $N_{crit}=11$
is deemed appropriate.
The overall agreement between XFOIL and FDL3DI is good; the similarities and the differences and their possible causes are discussed here. The peak suction pressure predictions by the two codes are in good agreement. Highest peak suction pressure is observed for the thinnest (NACA 0009) airfoil due to the smallest radius of curvature and the correspondingly high local acceleration. The transition location can be identified by a sudden drop in suction pressure; this drop is subtle, especially for the NACA 0009 airfoil. Transition location is identified more readily with a sudden increase in
 $C_{f}$
as seen for all four airfoils in figure 5. Both methods predict nearly the same location for transition; the largest mismatch is for the NACA 0009 airfoil. FDL3DI predicts a longer transition region than XFOIL – the
 $C_{f}$
curve rises abruptly (a little earlier than XFOIL) marking transition, then plateaus and then rises again to its local peak value corresponding to a fully turbulent boundary layer. A similar, ‘two-stage’ transition is seen in FDL3DI prediction for the NACA 0012 airfoil as well. Similar behaviour has been observed by Barnes & Visbal (Reference Barnes and Visbal2016). XFOIL simulations do not exhibit this two-stage transition, likely because of the simple transition model, which ensures a monotonic increase in
 $C_{f}$
once transition is triggered. FDL3DI simulations show a large difference between airfoils in
 $C_{f}$
distribution around the transition location – the thicker airfoils show a very steep spatial gradient in chordwise direction (
 $\unicode[STIX]{x2202}C_{f}/\unicode[STIX]{x2202}x$
) compared to the thin airfoils. This behaviour is not predicted by XFOIL, which shows almost no change in
 $\unicode[STIX]{x2202}C_{f}/\unicode[STIX]{x2202}x$
with airfoil thickness. In all the cases simulated here, the laminar boundary layer separates (
 $C_{f}<0$
), transition occurs in the shear layer and the turbulent boundary layer then reattaches to the surface.
Comparison of coefficient of pressure,
 $C_{P}$
, between predictions by FDL3DI and XFOIL. XFOIL is run with
 $N_{crit}=11$
to simulate very low inflow turbulence.

Comparison of skin friction coefficient,
 $C_{f}$
, between predictions by FDL3DI and XFOIL (
 $N_{crit}=11$
).

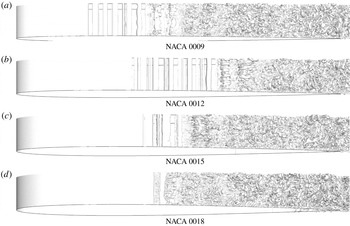
To investigate the two-stage transition observed in FDL3DI simulations for NACA 0009 and NACA 0012, the flow structure near the transition location is investigated. Figure 6 shows iso-surfaces of Q-criterion.
 $Q=0.5(|\unicode[STIX]{x1D734}|^{2}-|\unicode[STIX]{x1D64E}|^{2})$
where
 $\unicode[STIX]{x1D734}$
and
 $\unicode[STIX]{x1D64E}$
are vorticity and rate-of-strain tensors respectively, and
 $|\unicode[STIX]{x1D64F}|$
denotes the Euclidean norm of a tensor
 $\unicode[STIX]{x1D64F}$
of rank 2. The spanwise coherent 2-D vortex structures (seen clearly for NACA 0009 and NACA 0012) are the instability waves that break down and transition the boundary layer to turbulence. It is apparent from the figure that the transition region is much longer for NACA 0009 and NACA 0012 airfoils, while transition occurs over a much smaller region for NACA 0015 and NACA 0018 airfoils. The long transition region for the relatively thinner airfoils is the reason why the time-averaged
 $C_{f}$
distributions show a two-stage transition, with the plateau representing the region where the boundary layer is transitional. The higher adverse pressure gradients in the aft portion of the thicker airfoils is possibly the reason why the flow breaks down faster and transition occurs abruptly for these airfoils.
Iso-surfaces of Q-criterion to visualize vortical structures near the transition region. The transitional region is long for thin airfoils and short for thick airfoils.

5 Dynamic simulations
In the second step, the airfoil pitch-up motion is simulated via grid motion. A constant-rate pitch-up motion, with the pitching axis located at the airfoil quarter-chord point, is investigated. The non-dimensional rotation (pitch) rate is
 $\unicode[STIX]{x1D6FA}_{0}^{+}=\unicode[STIX]{x1D6FA}_{0}c/u_{\infty }=-0.05$
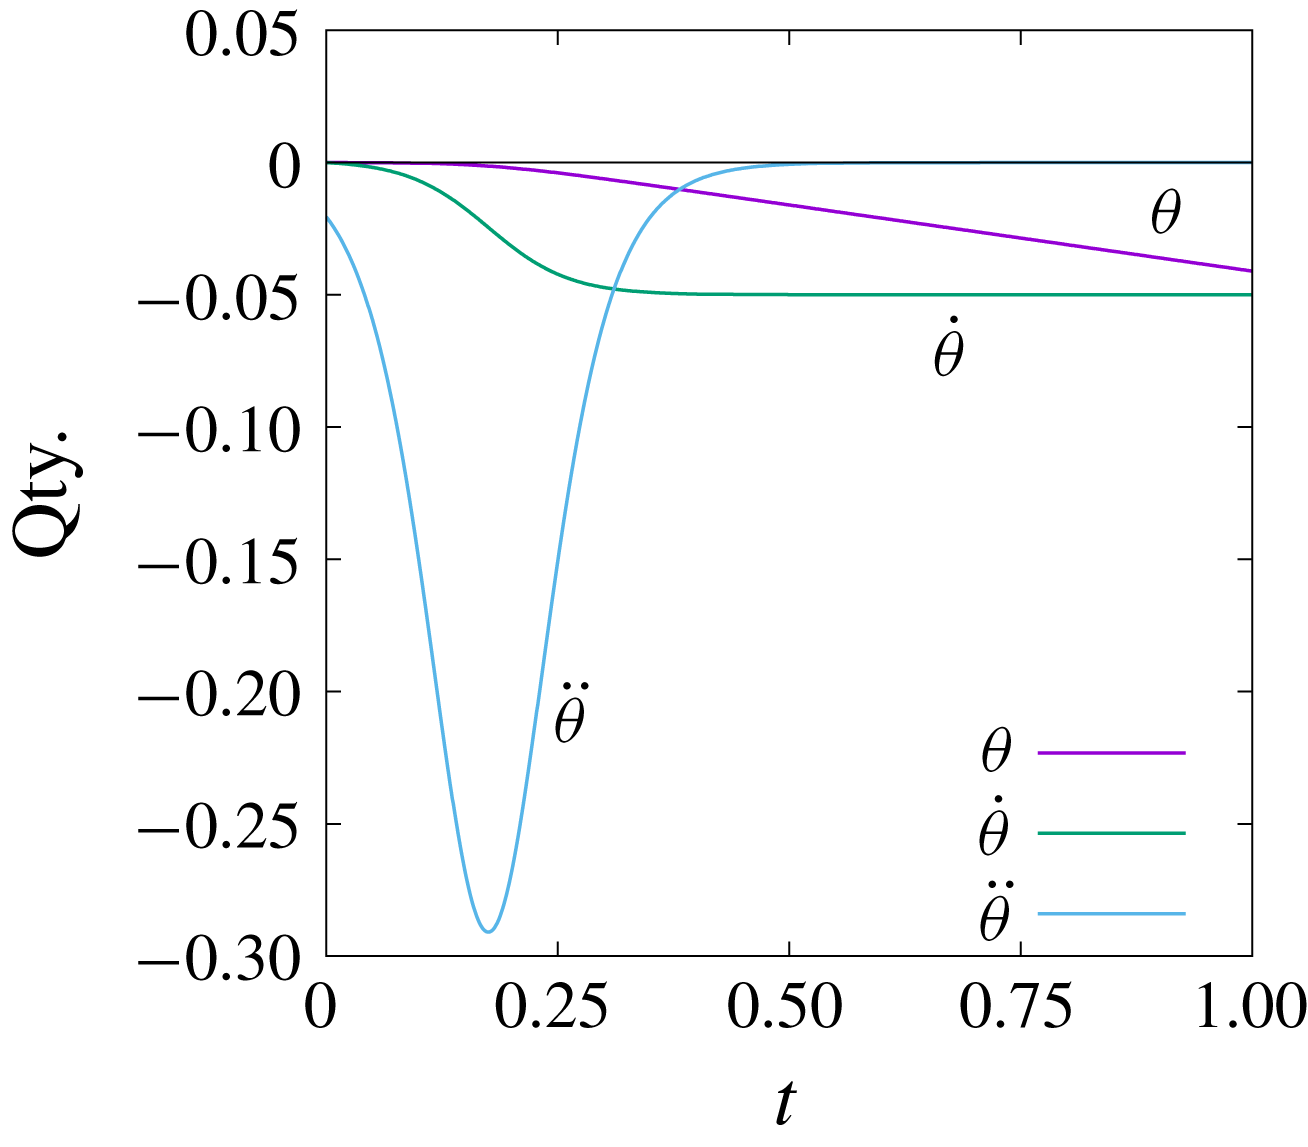
, which is selected based on the previous published work (see e.g. Gupta & Ansell Reference Gupta and Ansell2017; Visbal & Garmann Reference Visbal and Garmann2018). An abrupt change of rotation rate from zero to a finite value would result in a very large acceleration (limited only by the time step). A ramp function, defined by (5.1), is therefore employed to smoothly transition
 $\unicode[STIX]{x1D6FA}^{+}(t)$
from zero at
 $t=0$
to
 $\unicode[STIX]{x1D6FA}_{0}^{+}$
for
 $t>t_{0}$
. In (5.1), ‘
 $s$
’ is a scaling parameter that determines the steepness of the ramp function:
 $$\begin{eqnarray}\displaystyle \unicode[STIX]{x1D6FA}^{+}(t)=\unicode[STIX]{x1D6FA}_{0}^{+}\left(\frac{\tanh (s(2(t/t_{0})-1))+\tanh (s)}{1+\tanh (s)}\right). & & \displaystyle\end{eqnarray}$$
Figure 7 plots the ramp function ((5.1) with
 $s=2.0$
and
 $t_{0}=0.35$
) used in the dynamic simulations. The objective is to transition
 $\unicode[STIX]{x1D6FA}^{+}$
from
 $0$
to the final value of
 $-0.05$
quickly without introducing large perturbations due to inertial acceleration. A hyperbolic tangent function provides a smooth transition at both end points, and hence is selected to specify the pitch rate. The transition (ramp) region is limited by
 $t_{0}$
and scaled by
 $s$
; the higher the
 $s$
value, the quicker the pitch rate transitions to its final value, but the inertial acceleration is also high. Since the final pitch rate of
 $-0.05$
is relatively small, the effects of inertial acceleration are small and can be ignored. For
 $t>t_{0}$
, the airfoil continues to pitch at the constant rate,
 $\unicode[STIX]{x1D6FA}^{+}(t)=-0.05$
, and the angle of attack increases linearly with the pitch angle,
 $\unicode[STIX]{x1D703}$
.
Ramp function used to transition
 $\dot{\unicode[STIX]{x1D703}}(=\unicode[STIX]{x1D6FA}^{+})$
from
 $0$
to
 $-0.05$
, and the associated variations in pitch angle (
 $\unicode[STIX]{x1D703}$
) and acceleration (
 $\ddot{\unicode[STIX]{x1D703}}$
); equation (5.1) with
 $s=2$
and
 $t_{0}=0.35$
.

The following section provides an overview of the overall flow structure that is observed during the entire dynamic simulation. The details of the boundary layer flow physics are discussed in § 5.3.
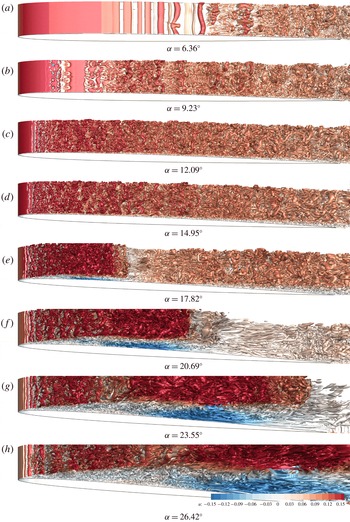
Iso-surfaces of Q-criterion with coloured contours of
 $x$
-component of flow velocity of the NACA 0012 simulation at various stages of dynamic stall.

5.1 Overall flow structure
The airfoil goes through various flow stages during the pitch-up motion. This sequence of events can be seen in the snapshots of the FDL3DI predicted flow field for the NACA 0012 airfoil in figure 8. Each plot in the figure shows iso-surfaces of the Q-criterion.
(i) The laminar-to-turbulent boundary layer transition point on the suction surface moves upstream towards the leading edge. This can be clearly observed by comparing the transition locations between panels (a,b). Details about identification of transition location are presented in appendix C.
(ii) A laminar separation bubble (LSB) forms on the suction surface and moves closer to the leading edge while simultaneously reducing in size with increasing angle of attack (as seen more clearly in figures 10 and 11, and discussed in detail in later sections). The LSB then settles at
$x/c\sim 0.06$
for this case, as seen in panels (c,d). The suction peak ahead of the LSB, as well as the integrated lift, continue to increase with increasing
$\unicode[STIX]{x1D6FC}$
; most of the boundary layer on the suction side is turbulent at this time.(iii) The LSB bursts somewhere between panels (d,e) of figure 8, leading to the formation of the dynamic stall vortex (DSV), which is seen centred at
$x/c\sim 0.2$
in panel (e). The suction peak upstream of the LSB collapses immediately following the bubble burst.(iv) The DSV convects with the flow. The flow entrainment induced by the DSV causes the vorticity in the shear layer in the aft portion of the airfoil to roll up into a shear layer vortex (SLV). Flow entrainment due to the DSV can be interpreted from the streamwise elongated eddies seen in panel (f); these are formed because of the large velocity induced by the DSV impinging on the airfoil and pushing the residual turbulent boundary layer further downstream, rolling it up and forming the shear layer vortex. Panel (f) also marks the beginning of moment stall as the suction peak moves downstream with the DSV.
(v) As the DSV moves downstream, the airfoil pitch-down moment (
$-C_{M}$
) increases sharply as the lift distribution becomes aft dominant, and moment stall occurs.(vi) When the DSV gets close to the trailing edge, the additional lift due to the velocity induced by the DSV reduces dramatically, causing lift stall.


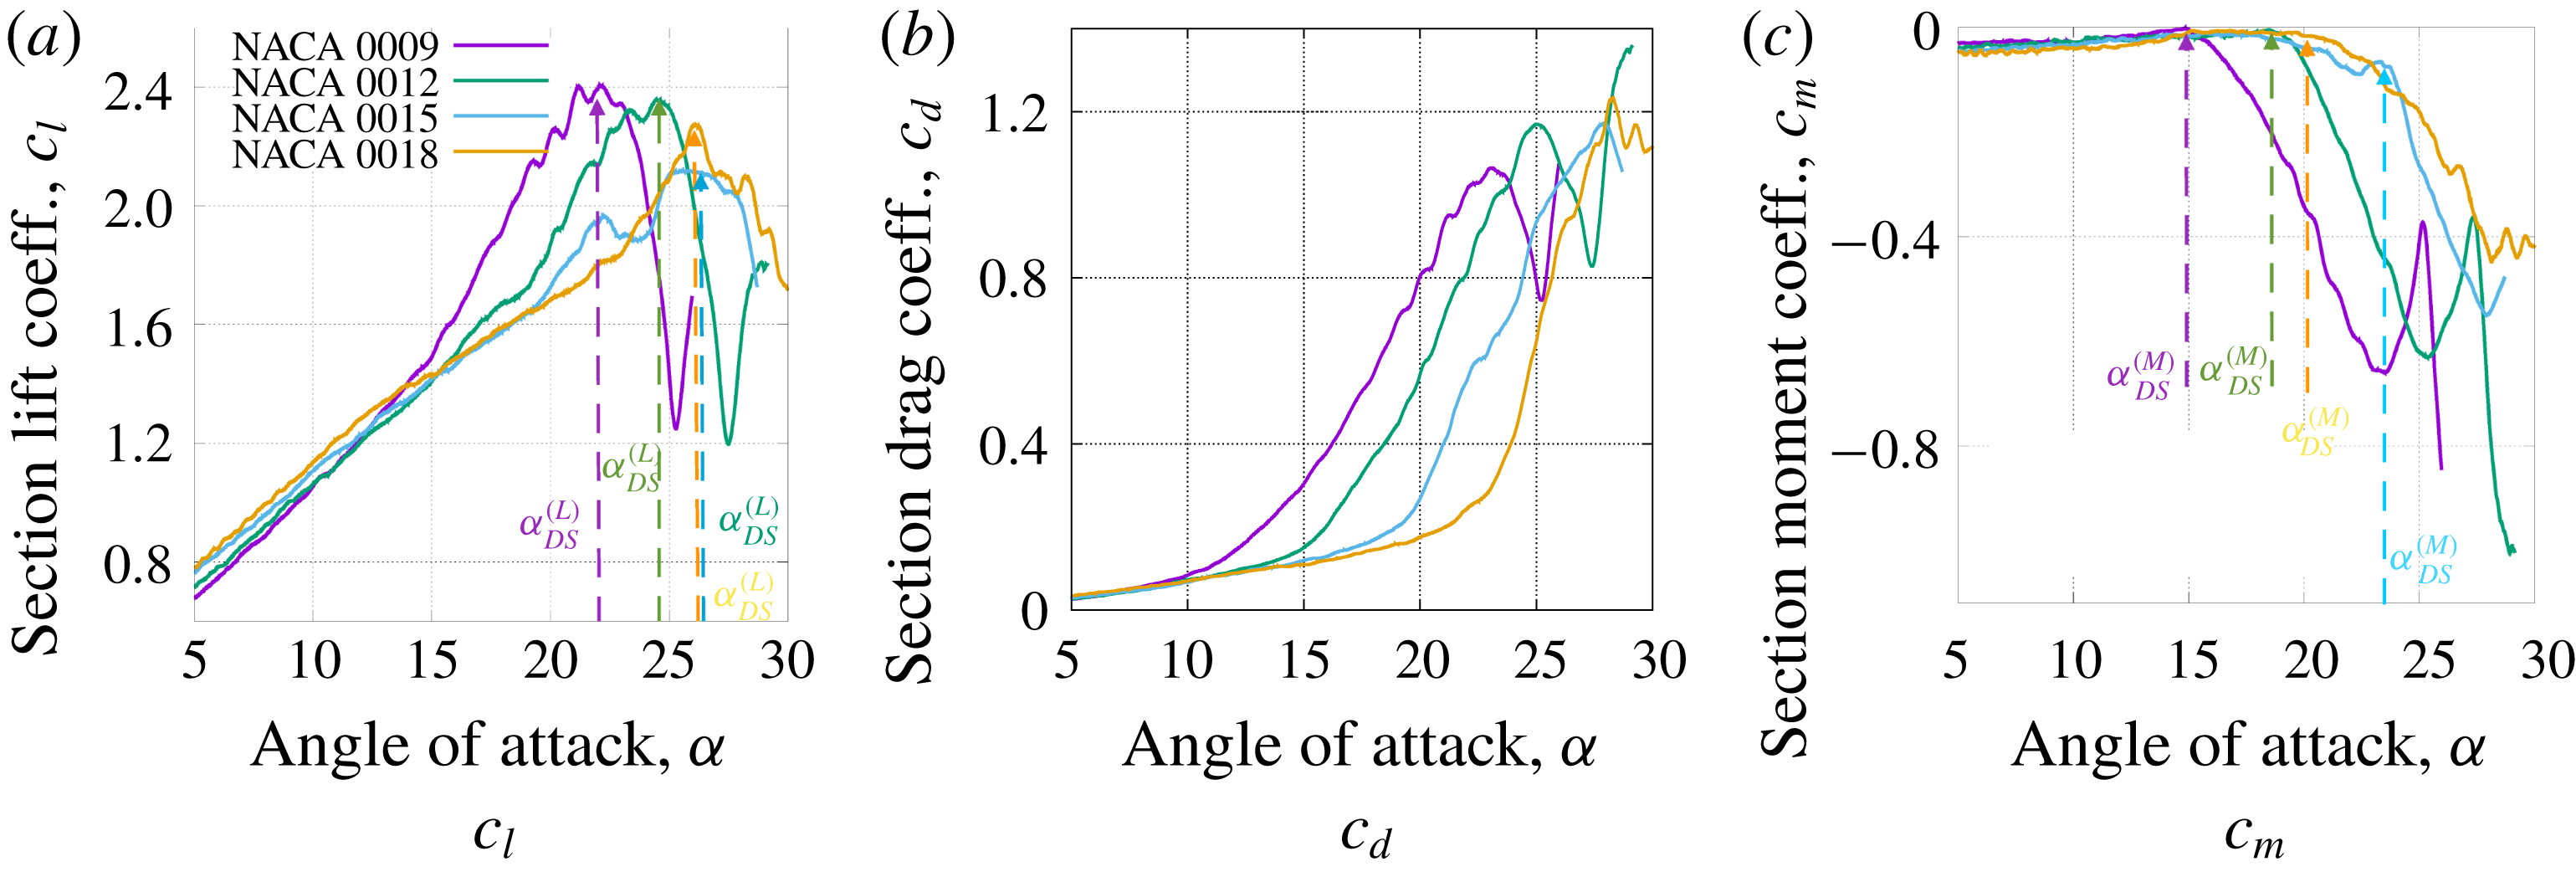
Sectional lift, drag and moment coefficients as functions of angle of attack during a constant-rate pitch-up manoeuver.

Contours of spanwise-averaged pressure coefficient (
 $\langle C_{P}\rangle$
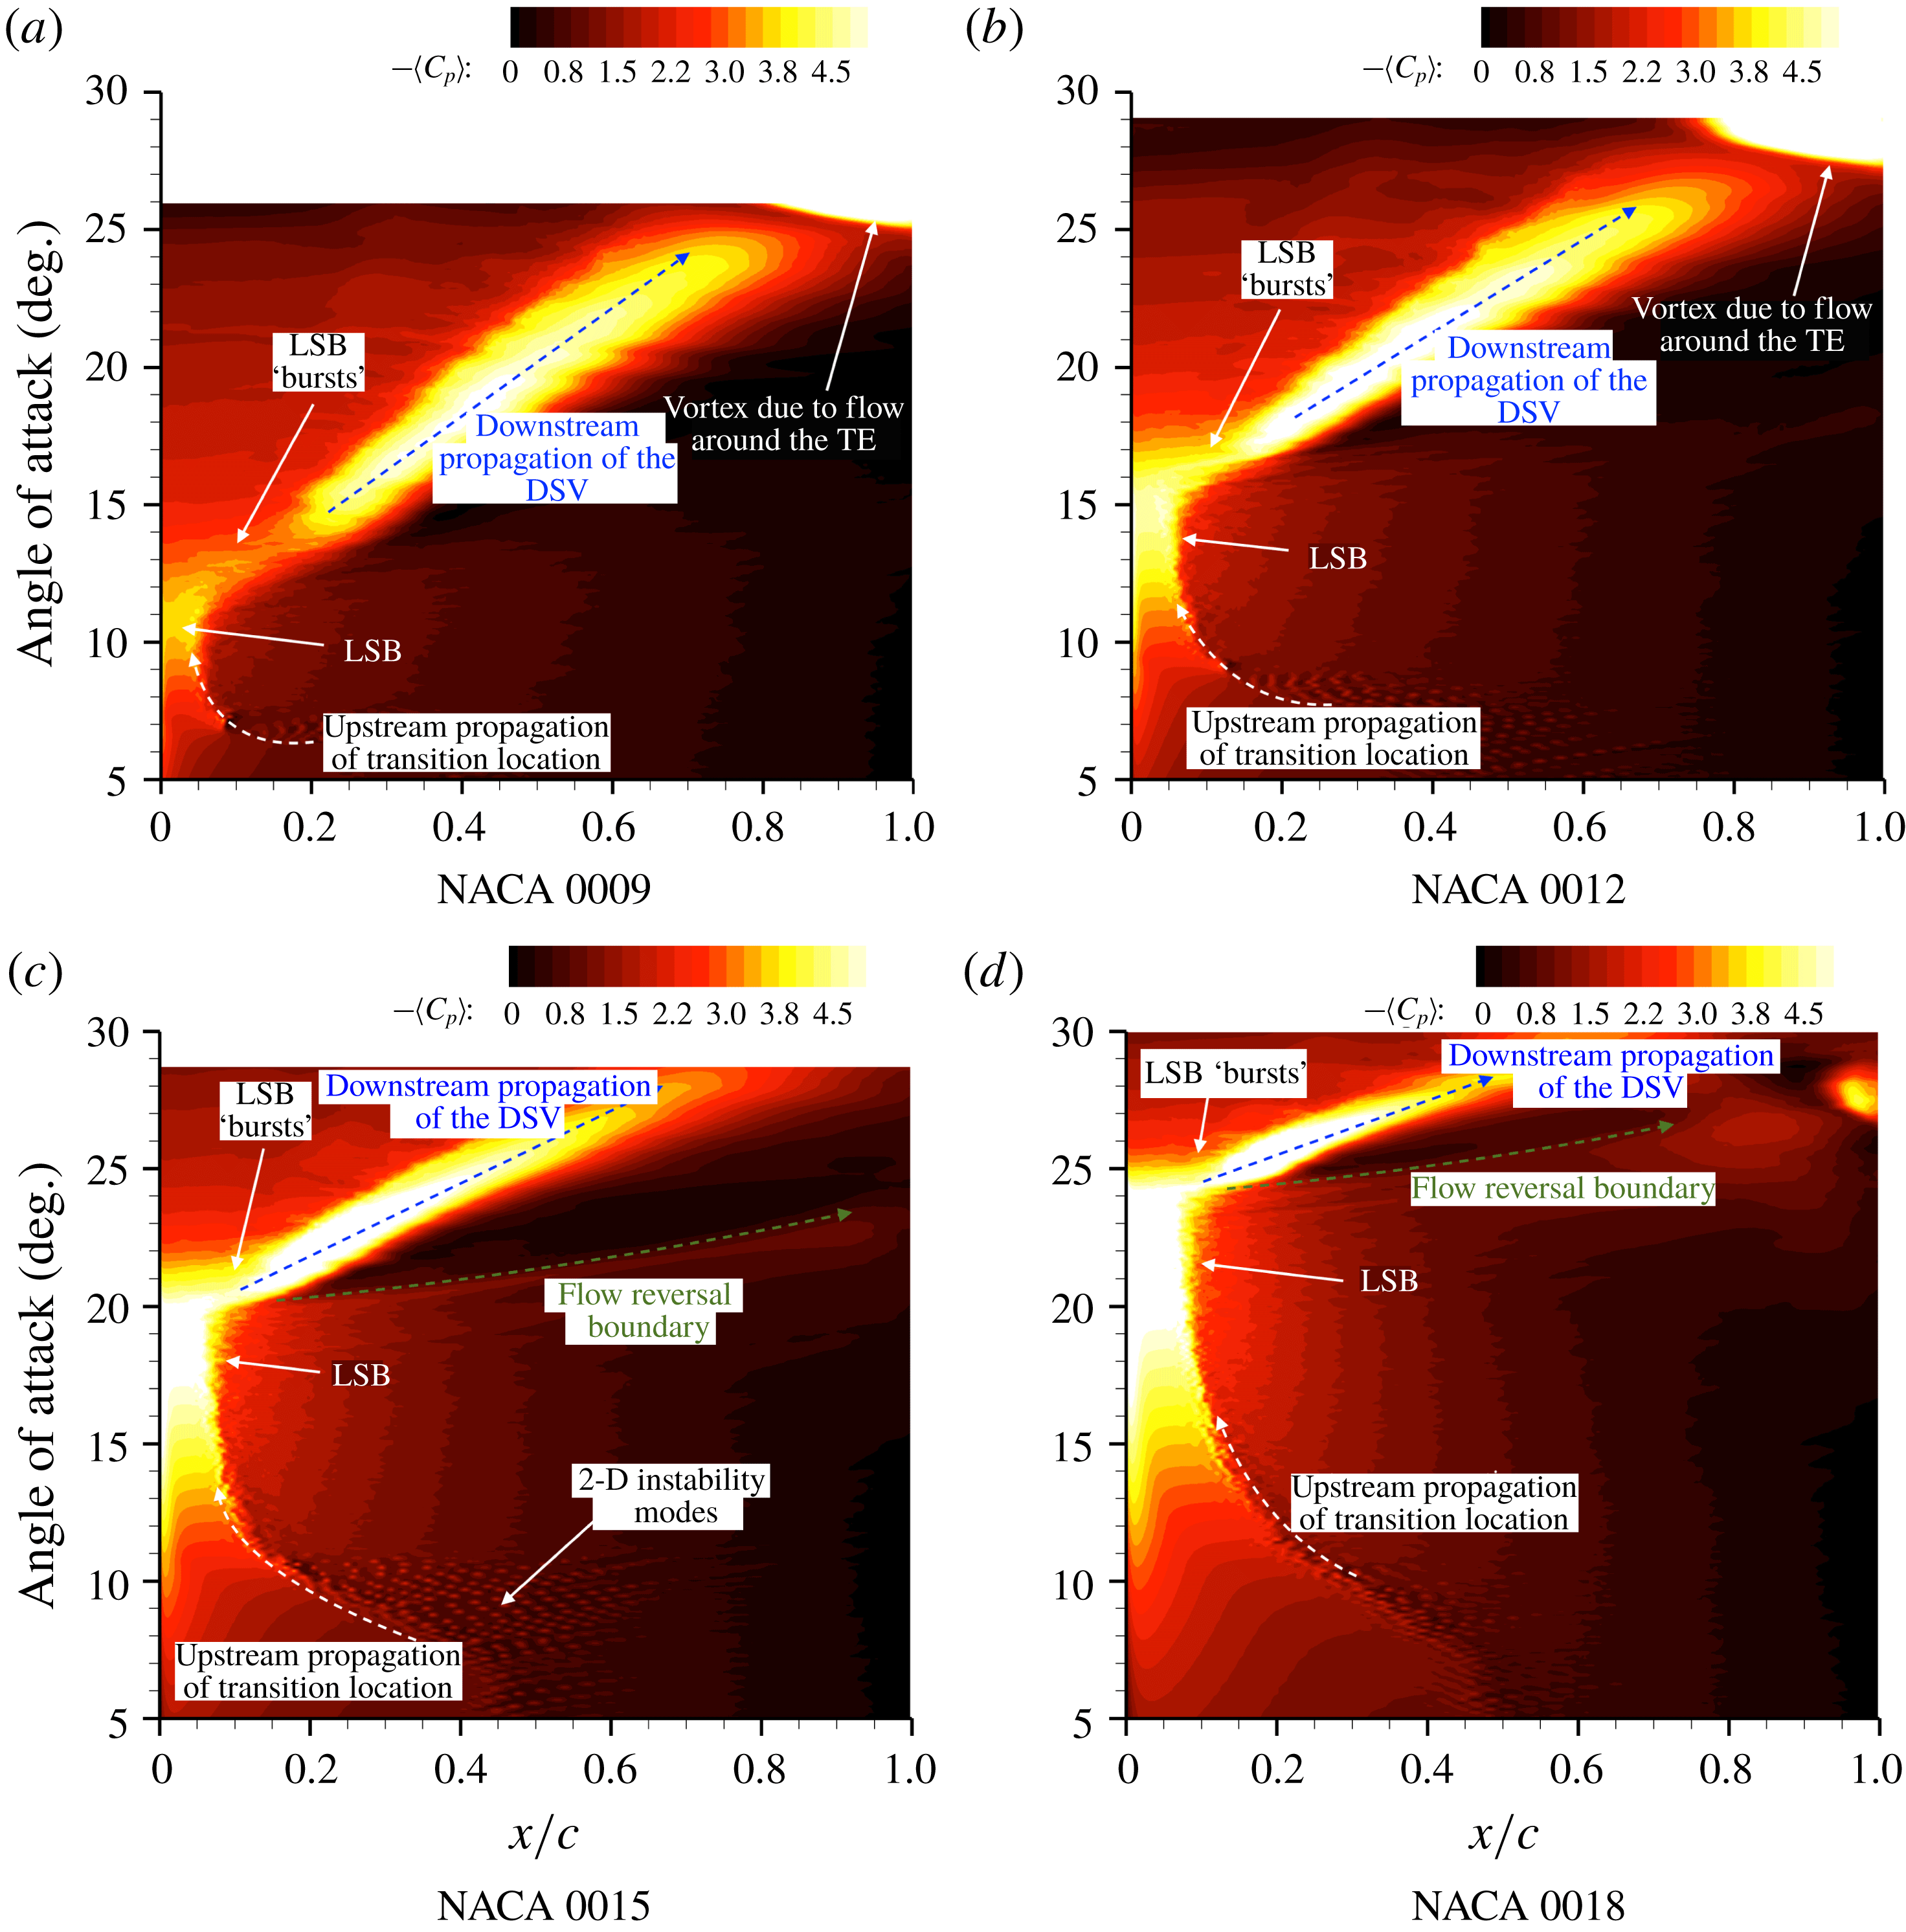
) on the suction side of the four airfoils through the constant-rate pitch-up motion.

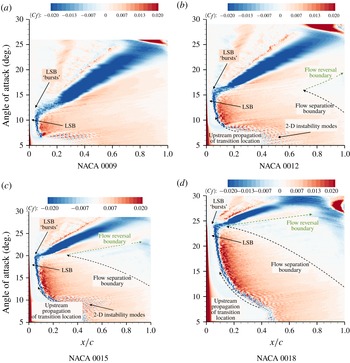
Contours of spanwise-averaged skin friction coefficient (
 $\langle C_{f}\rangle$
) on the suction side of the four airfoils through the constant pitch-rate motion.

5.2 Lift, drag and moment variations
The four airfoils tested here more-or-less follow the same general pattern as the pitch angle is increased through stall. However, there are considerable differences in the unsteady lift increase, local pressure peaks and the amount of trailing edge separation, before stall occurs. These differences are discussed next.
Figure 9 compares the dynamic section lift, drag and moment coefficients for the four simulated airfoils as they undergo the constant-rate pitching motion. We focus first on the NACA 0012 simulation. The slope of the
 $c_{l}-\unicode[STIX]{x1D6FC}$
curve increases around
 $\unicode[STIX]{x1D6FC}=18^{\circ }$
, which is due to the strengthening of the DSV and the associated increase in lift. This is immediately followed by moment stall, marked by the strong divergence in the
 $c_{m}-\unicode[STIX]{x1D6FC}$
curve. As explained earlier, the sharp increase in pitch-down moment is due to the progressive aft propagation of loading induced by the DSV. At around
 $\unicode[STIX]{x1D6FC}=25^{\circ }$
the DSV has propagated close to the trailing edge and away from the airfoil. As a result, the lift induced by the DSV reduces dramatically and lift stall occurs.
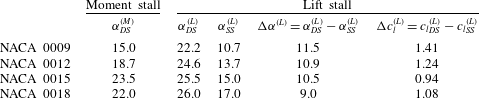
Comparing the sectional lift, drag and moment for the four airfoils (see figure 9 and table 1) shows that the largest increase in lift and pitch-down moment due to airfoil motion (dynamic stall), is observed for the NACA 0009 airfoil; the smallest increase in lift is observed for the NACA 0015 airfoil; while the NACA 0018 experiences the smallest increase in pitch-down moment. The increase in unsteady lift is measured as the difference of
 $c_{l,max}$
between dynamic and static stall. The values for dynamic stall are obtained using FDL3DI while the corresponding static values are obtained using XFOIL. Computation of static stall using FDL3DI would require several runs to identify the stall angle of attack and would be very computationally expensive. Beyond certain angle of attack (
 $\unicode[STIX]{x1D6FC}$
), the drag coefficient increases rapidly. This critical value of
 $\unicode[STIX]{x1D6FC}$
increases monotonically with airfoil thickness – the thinnest airfoil showing the divergence at much smaller
 $\unicode[STIX]{x1D6FC}$
than the thicker airfoils. While unsteady loads reduce with increasing airfoil thickness, stall delay (as measured by the difference in
 $\unicode[STIX]{x1D6FC}$
where dynamic stall occurs versus where static stall occurs) remains nearly unchanged. The static-stall values of
 $\unicode[STIX]{x1D6FC}$
(denoted by
 $\unicode[STIX]{x1D6FC}_{SS}$
) for the four airfoils are also obtained using XFOIL.
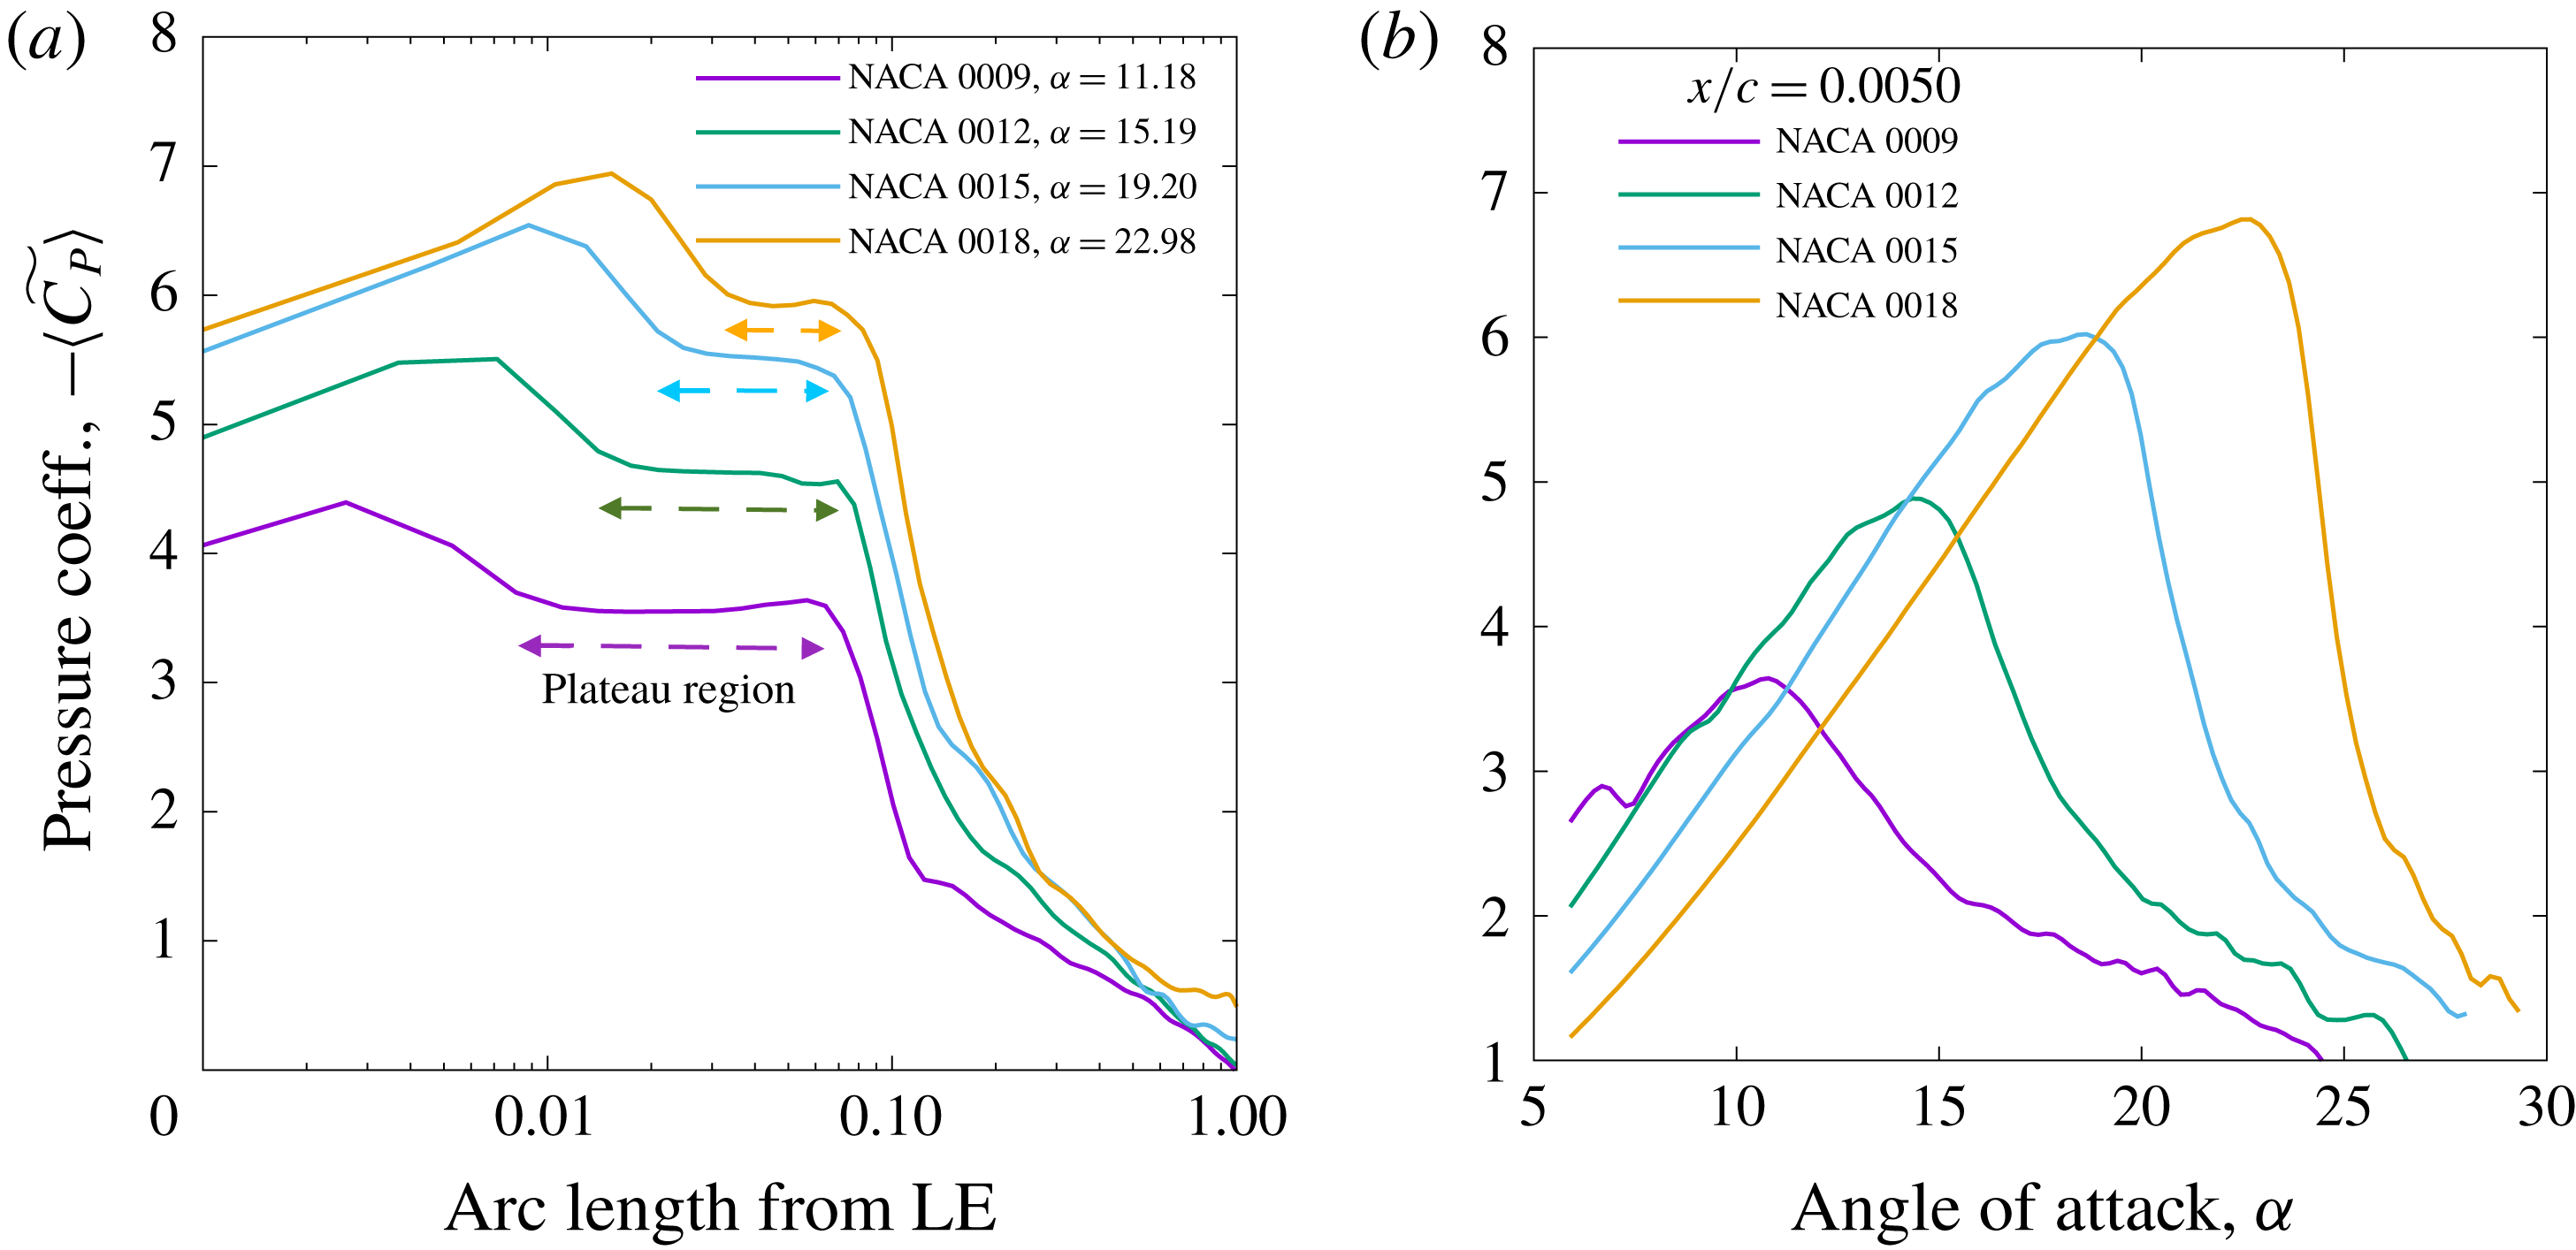
Spanwise-averaged and low-pass filtered aerodynamic pressure coefficient (
 $\langle \widetilde{C_{P}}\rangle$
) variation: (a) with arc length measured from the airfoil leading edge just before the LSB bursts, and (b) with angle of attack at
 $x/c=0.005$
as each airfoil is pitched up at a constant rate. (a) Variation of
 $\langle \widetilde{C_{P}}\rangle$
with arc length on thesuction side before LSB burst. (b)
 $\langle \widetilde{C_{P}}\rangle$
variation with at
 $x/c=0:005$
.

Angle of attack values at which static stall and dynamic stall occurs (denoted by
 $\unicode[STIX]{x1D6FC}_{SS}$
and
 $\unicode[STIX]{x1D6FC}_{DS}$
respectively) for different airfoils. Moment-stall and lift-stall values are indicated separately. Static-stall values are obtained using XFOIL whereas dynamic-stall values are from FDL3DI simulations.

5.3 Boundary layer physics and onset of dynamic stall
We investigate the mechanism of stall onset for the cases considered here by analysing the details of the flow field over the suction surface for each airfoil. Figures 10 and 11 respectively plot spanwise-averaged contours of
 $-C_{P}$
and
 $C_{f}$
(denoted by
 $-\langle C_{P}\rangle$
and
 $\langle C_{f}\rangle$
respectively) on the suction side of the airfoil as functions of chordwise distance and angle of attack,
 $\unicode[STIX]{x1D6FC}$
. This representation is similar to
 $x-t$
diagrams with
 $\unicode[STIX]{x1D6FC}$
representing time (
 $t$
) scaled by the pitch rate (since the pitch rate is constant);
 $x-t$
diagrams are useful to identify characteristics of hyperbolic equations. Contour plots are shown for all four cases. The sequence of flow events identified earlier in § 5 are clearly seen in the contour plots. The transition location is identified by the boundary where the 2-D instability modes (seen clearly in figure 11 as alternating blue and red spots) start to appear. The transition location moves upstream with increasing
 $\unicode[STIX]{x1D6FC}$
. The speed at which the transition location moves upstream reduces with increasing airfoil thickness. The LSB forms near the leading edge (marked by levelling off of chordwise variation of
 $\langle C_{P}\rangle$
) and is sustained up to approximately
 $\unicode[STIX]{x1D6FC}=11^{\circ },15^{\circ },19^{\circ }$
and
 $23^{\circ }$
for the 9 %, 12 %, 15 % and 18 % thick airfoils respectively.
Even with span averaging, there is a lot of scatter in the simulation data. Therefore
 $\langle C_{P}\rangle$
and
 $\langle C_{f}\rangle$
are low-pass filtered to obtain smoother curves; these are denoted by
 $\langle \widetilde{C}_{P}\rangle$
and
 $\langle \widetilde{C}_{f}\rangle$
respectively (see appendix C). Figure 12(a) plots the variation of
 $\langle \widetilde{C_{P}}\rangle$
with arc length measured from the leading edge for each airfoil just before the LSB collapses. The abscissa is plotted on a logarithmic scale to zoom in on the LSB. The size of the plateau region due to the LSB is clearly seen to reduce with airfoil thickness. It is also observed that the thickest airfoil (NACA 0018) experiences the largest increase in peak
 $-\langle \widetilde{C}_{P}\rangle$
, quite in contrast with integrated lift increase due to dynamic stall, which is observed to be highest for NACA 0009 (see figure 9
a). This is due to larger leading edge radius of curvature in thicker airfoils which alleviates the increase in adverse pressure gradient due to airfoil pitch-up motion, hence sustaining the LSB to higher
 $\unicode[STIX]{x1D6FC}$
. A similar observation has been reported in Ramesh et al. (Reference Ramesh, Gopalarathnam, Ol, Granlund and Edwards2011), which defines a leading edge suction parameter (LESP) and identifies the critical value of LESP for a given airfoil geometry at which the flow separates at the leading edge. The LESP is defined in an inviscid sense as the flow velocity at the leading edge of the airfoil; a viscous equivalent of LESP would be static pressure with opposite sign. Ramesh et al. (Reference Ramesh, Gopalarathnam, Ol, Granlund and Edwards2011) remark that the critical LESP should increase with increasing airfoil thickness.
The LSB ‘burst’ is marked by a sudden loss in suction near the leading edge with increasing
 $\unicode[STIX]{x1D6FC}$
. Figure 12(b) plots the variation of
 $\langle \widetilde{C_{P}}\rangle$
with
 $\unicode[STIX]{x1D6FC}$
on the suction side of each airfoil at
 $x/c=0.005$
. The collapse of the suction pressure peak is abrupt for the thicker airfoils. The collapse of the suction peak is followed immediately by the formation of the dynamic-stall vortex (DSV). These events are notated in the plots in figures 10 and 11. The locus of the DSV is clearly visible in figure 10 as a hotspot streak running from left to right at an angle (marked with a blue arrow); the angle determined by the speed at which the DSV convects along the airfoil chord, and the colour intensity signifying the additional suction induced by the DSV. The chordwise convection speeds of the DSVs, computed using the slopes of the hotspot streaks, are: 0.15, 0.18, 0.24 and 0.30 for the 9 %, 12 %, 15 % and 18 % thick airfoils respectively. Note that the free-stream flow speed is 1.0. The apparent increase in convection speed with airfoil thickness is due to the fact that the DSV formation and propagation occur at higher pitch angles with increasing thickness. This is because, at higher pitch angles, the flow speed over the entire airfoil is higher for thicker airfoil corresponding to the higher suction (
 $-\langle C_{P}\rangle$
) seen in figure 12(a). A small contribution to the difference in chordwise convection speed of the DSV also arises from the following. The DSV does not actually convect along the airfoil chord; it moves approximately in the direction of the free-stream velocity vector. The DSV convection speed measured using the slopes of the hot streaks in figure 10 is the projection of the actual speed onto the direction of the chord line. Since the airfoil pitch angle at the point when the DSV forms increases with airfoil thickness, the projected chordwise convection speed would be higher for thicker airfoils even if the actual (physical) convection speeds are the same.
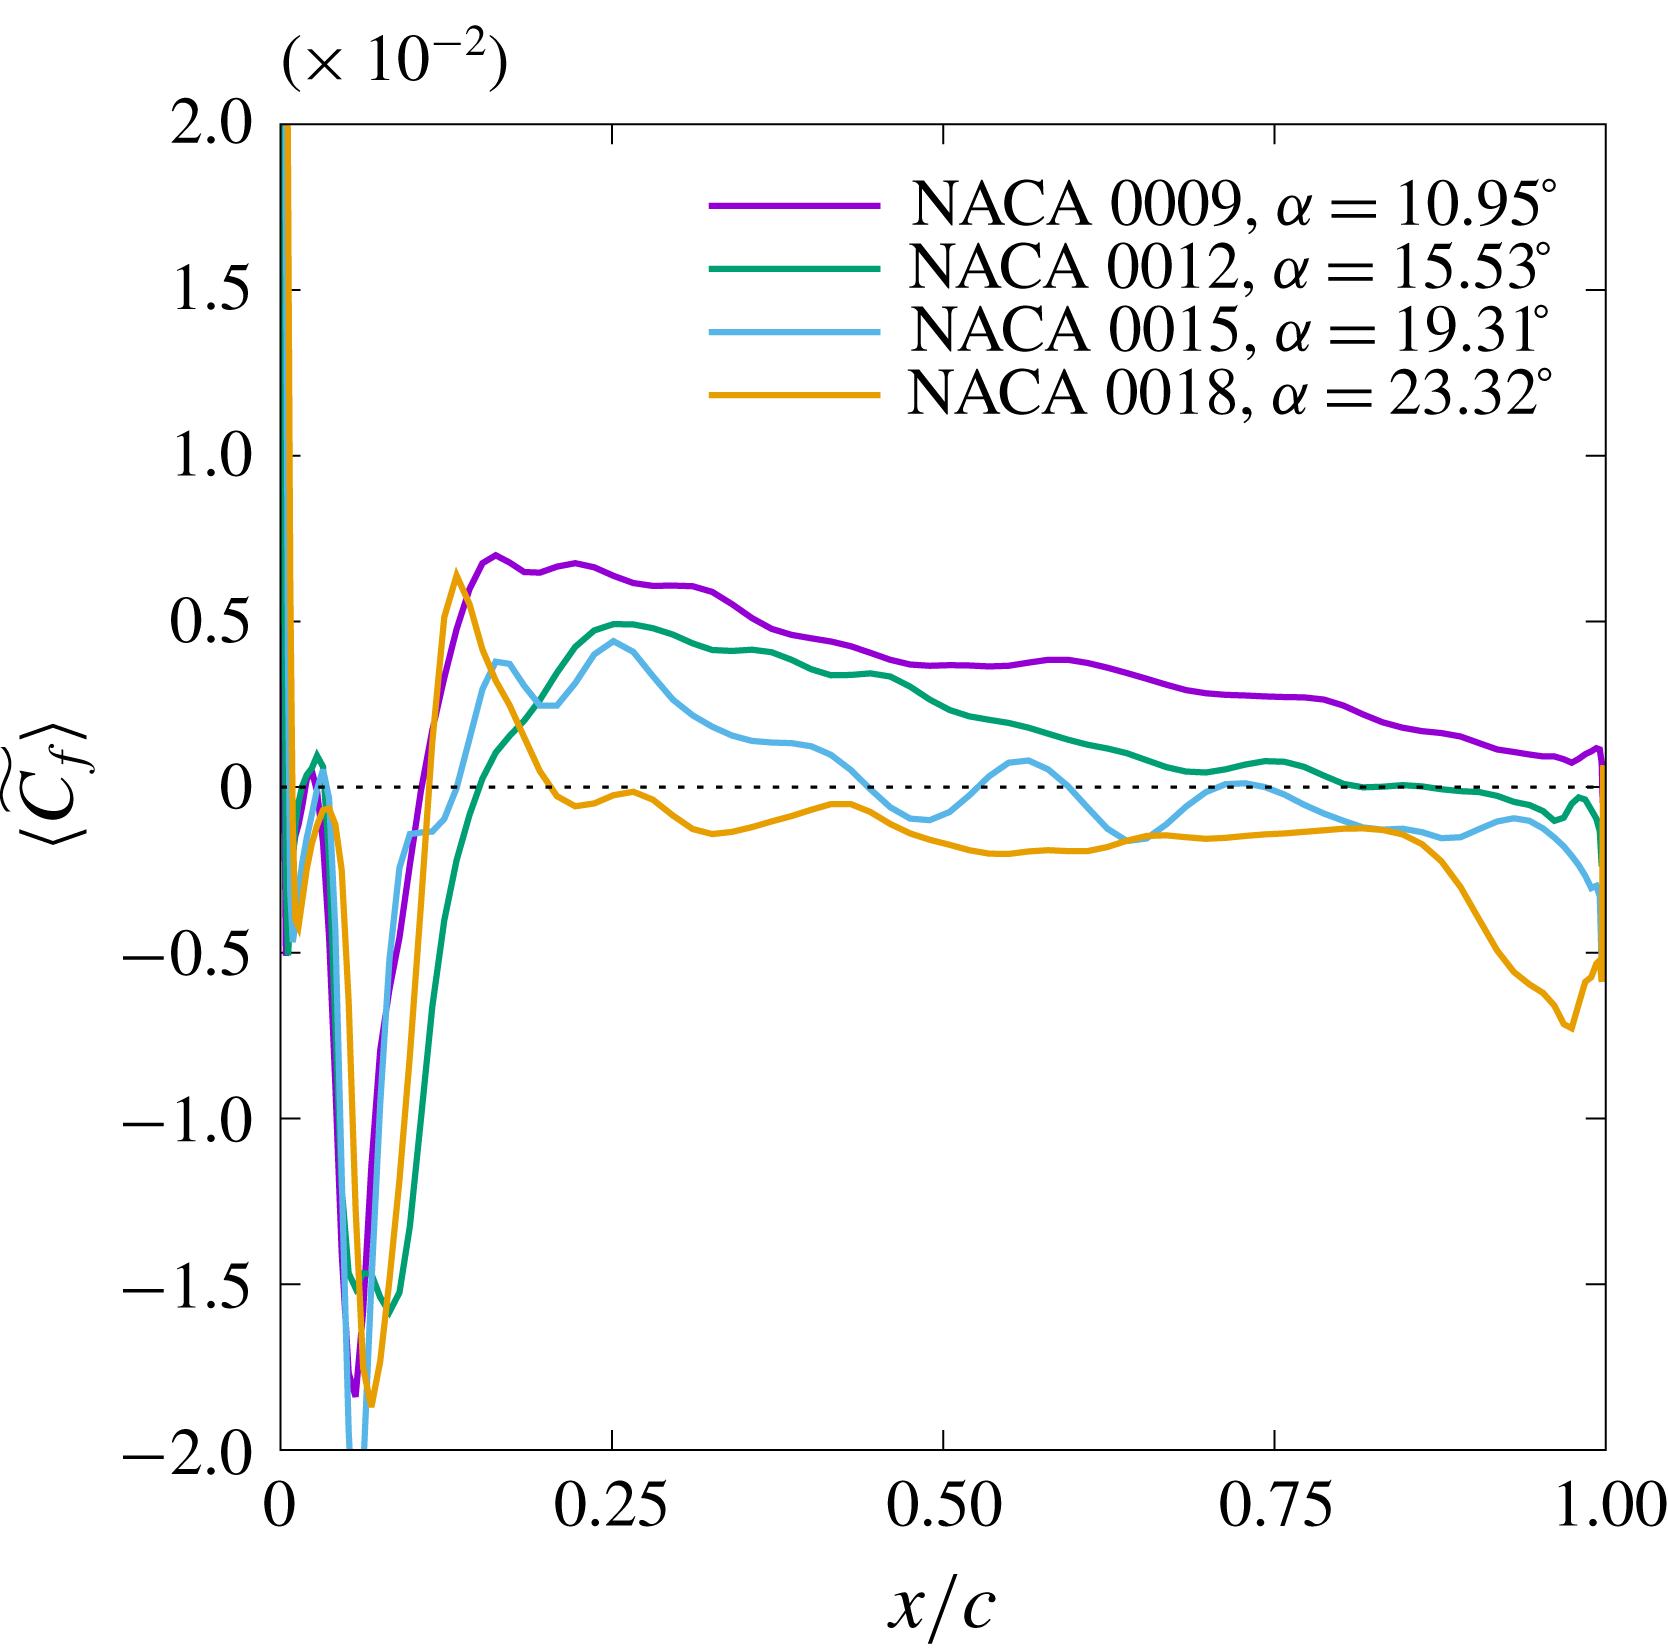
Flow reversal in the aft portion of the airfoil suction surface is investigated to find out if it plays a role in dynamic-stall onset. Regions of flow reversal are identified in figure 11 by negative values of
 $\langle C_{f}\rangle$
. A two-colour scheme is chosen for the contour plots in figure 11 to aid in visually identifying the reverse flow regions. It is seen that for NACA 0009, there is virtually no flow reversal near the trailing edge by the time the DSV forms and stall occurs. In the NACA 0012 case, there is a hint of flow reversal (faint blue contours in the range
 $12^{\circ }<\unicode[STIX]{x1D6FC}<18^{\circ }$
; region between the dashed black and green lines in figure 11
b) localized near the trailing edge. The NACA 0015 case however shows a moderate size flow separation region that reaches almost up to 30 % chord when the LSB bursts and dynamic stall begins. In these three cases, the dynamic-stall onset is clearly triggered by the bursting of the LSB and hence can be categorized as leading edge stall. For the thickest airfoil tested (NACA 0018) however, the reverse flow region in the turbulent boundary layer reaches the location of the LSB (
 $x/c\sim 0.18$
) exactly at the time when the LSB collapses. In this case, it is difficult to isolate the mechanism that triggers dynamic stall. The trailing edge separation region interacting with the LSB could be the mechanism that causes the airfoil to stall. This mechanism is also observed in the simulations of Benton & Visbal (Reference Benton and Visbal2018) of the NACA 0012 airfoil at a higher Reynolds number (
 $=10^{6}$
).
Another characteristic, that is readily observed in figure 11(c), is the left-to-right running line that starts at the LSB burst location and convects at a speed greater than that of the DSV (shallower angle in the plot). This characteristic is denoted by the green dashed line with an arrowhead in the figure. The
 $\langle C_{f}\rangle$
changes sign across this characteristic – from negative to positive as
 $\unicode[STIX]{x1D6FC}$
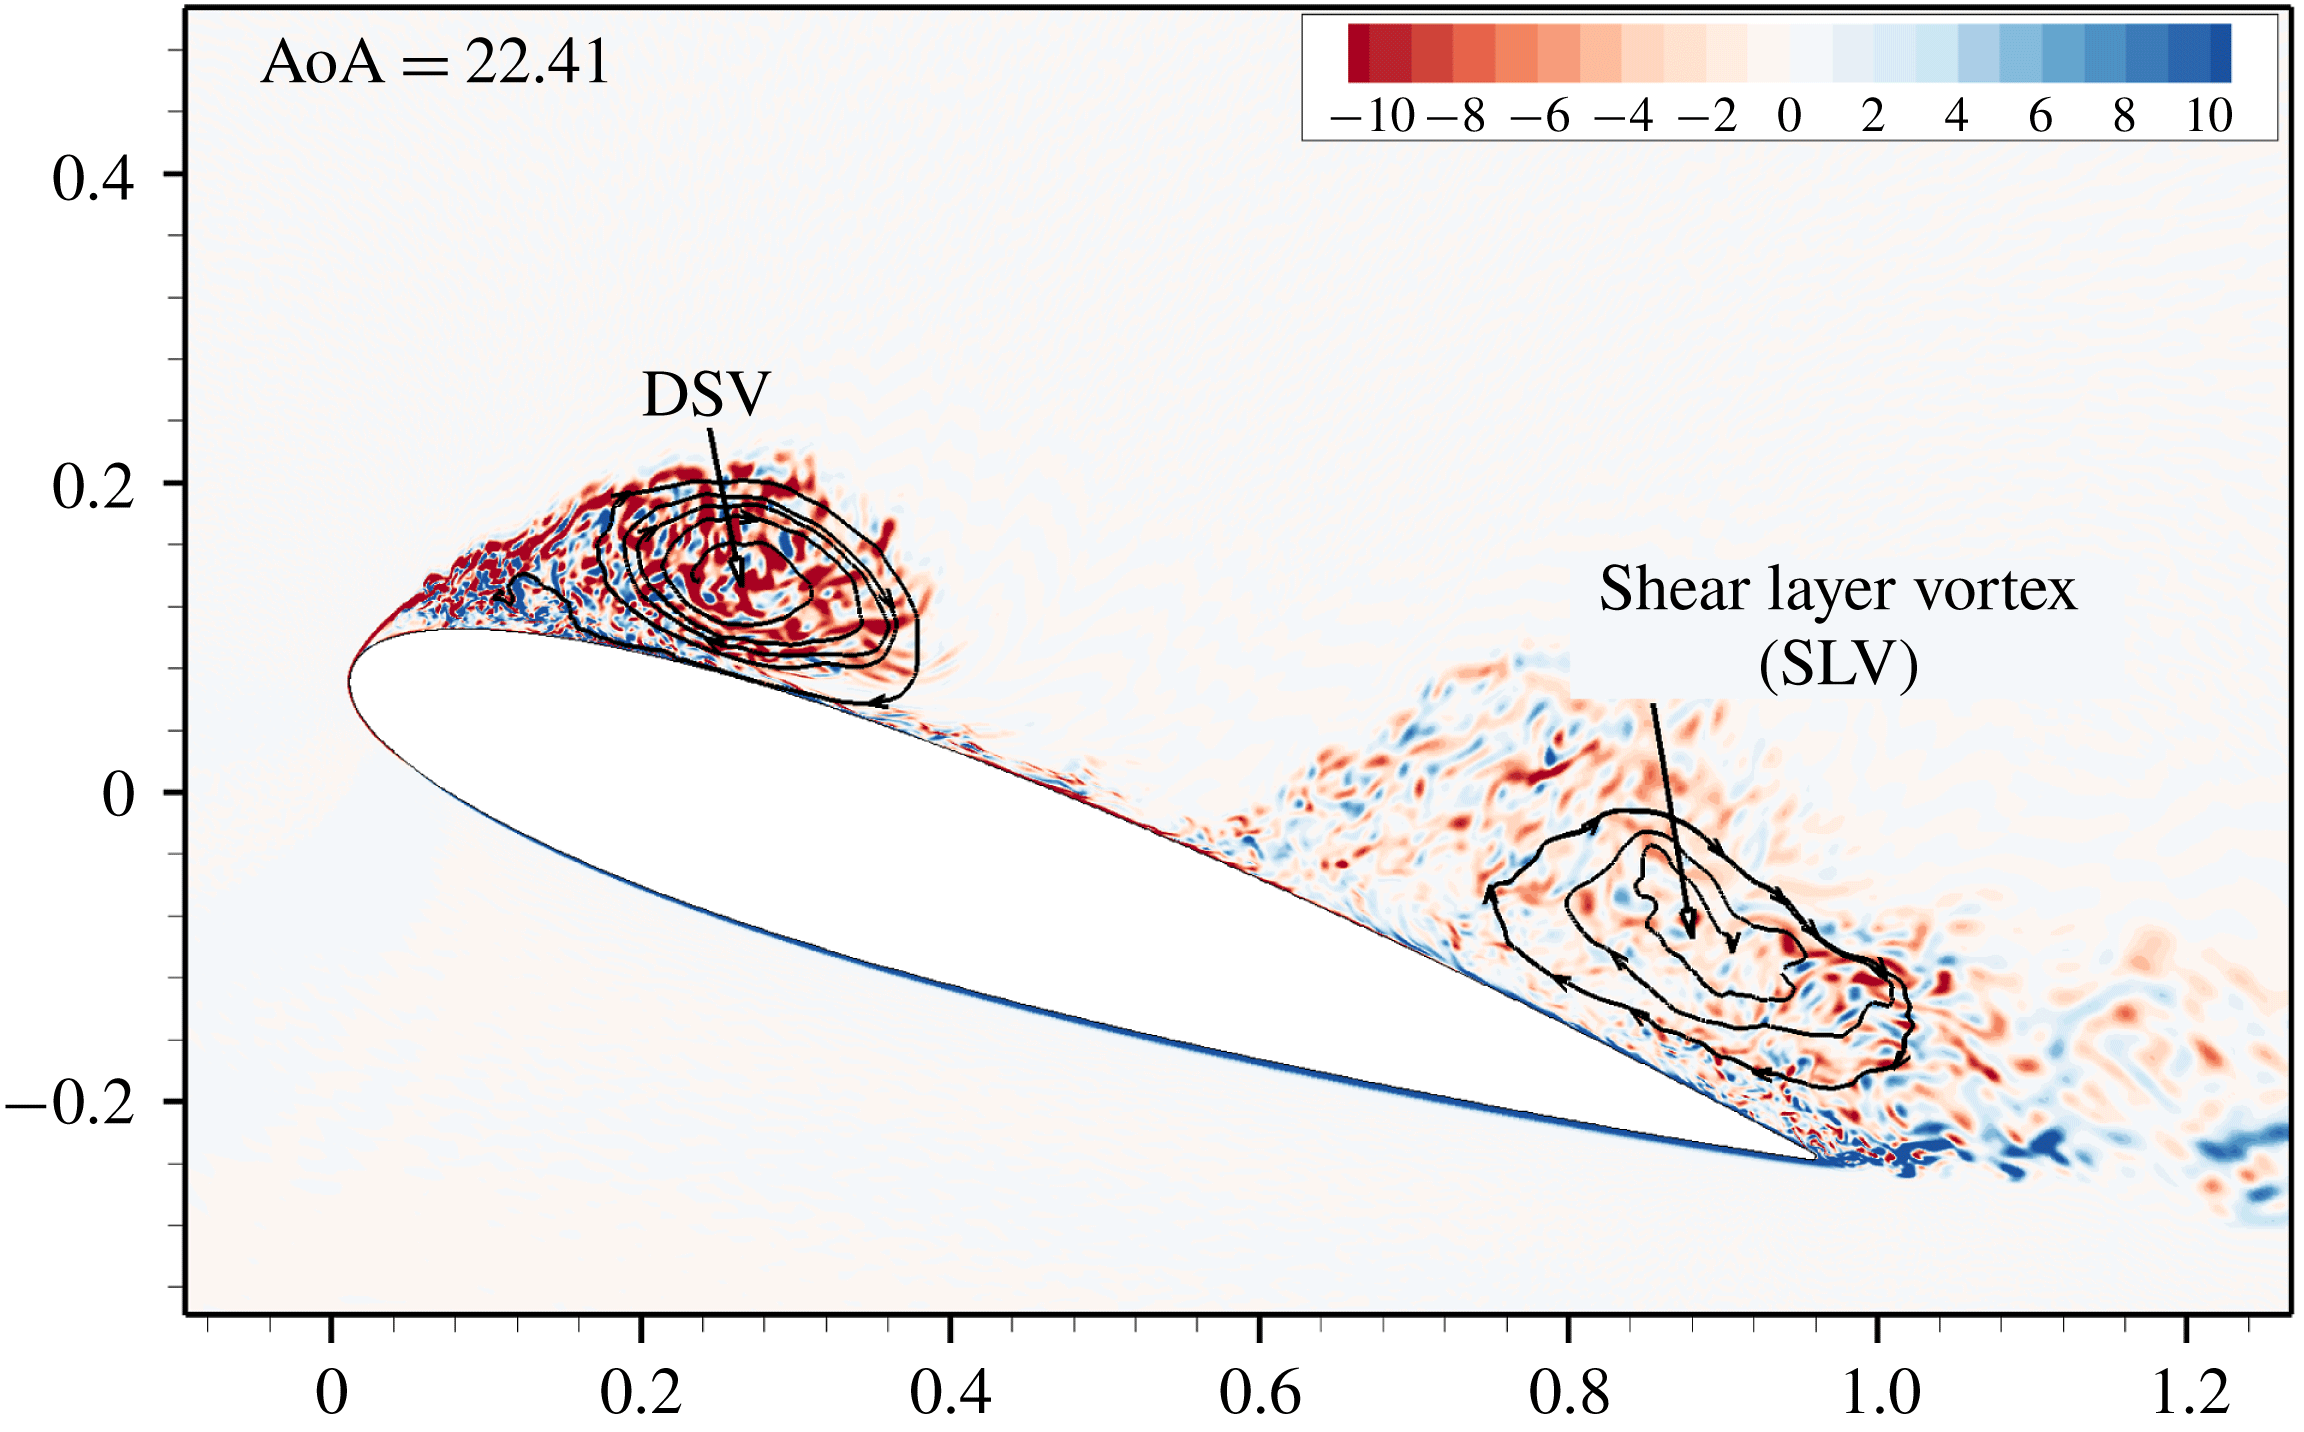
is increased. A moderate drop in suction pressure is also observed across this characteristic (figure 10). As the DSV grows, some of the viscous boundary layer vorticity rolls up into it. The remaining vorticity rolls up further downstream into a shear layer vortex (SLV). The DSV and the SLV are visualized in figure 13 using vorticity contours and streamlines. In between the DSV and the SLV, there is a region of positive
 $\langle C_{f}\rangle$
due to the interplay between the free stream and the velocity induced by the DSV. This is also seen in figure 8(e,f) where the region between the DSV and the SLV shows turbulent eddies stretched in the streamwise direction due to the flow locally accelerated by the DSV. The characteristic referred to above, marks the trailing end of the SLV. The propagation speed of this characteristic is nearly equal to unity as the SLV convects with the local flow speed along the chord.
Vorticity contours for NACA 0015 airfoil at
 $\unicode[STIX]{x1D6FC}=22.41^{\circ }$
identifying the shear layer vortex (SLV) and the DSV.

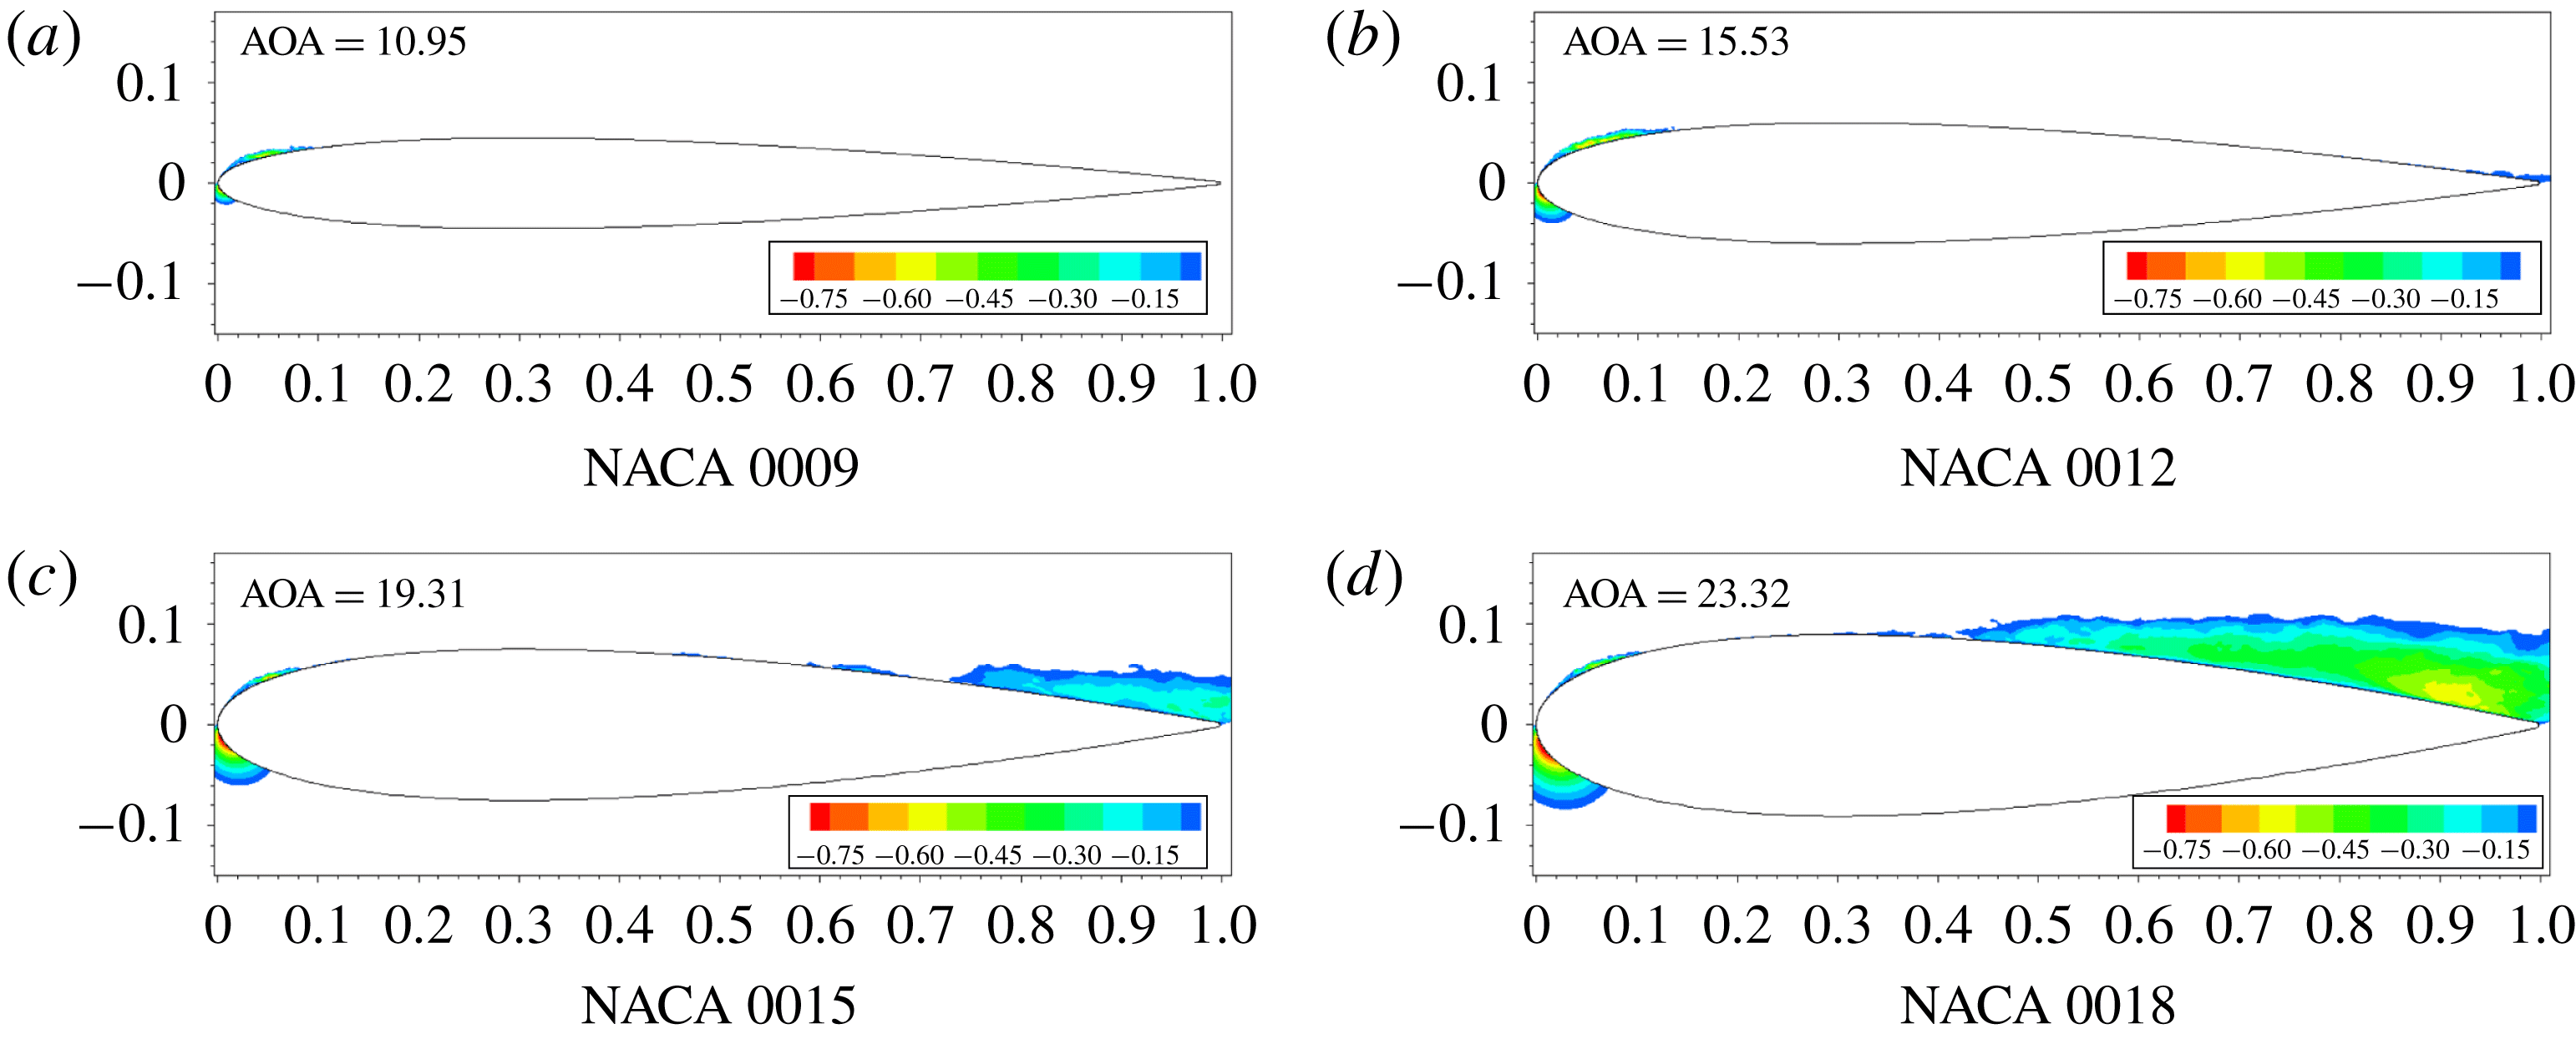
Figure 14 plots instantaneous contours of chordwise relative velocity for each airfoil immediately prior to onset of dynamic stall. The contours are cutoff above the zero value to show only the reverse flow regions. Reverse flow region is clearly visible in the aft portion of the relatively thick airfoils (NACA 0015 and NACA 0018), while the 9 % and 12 % thick airfoils show almost no flow reversal. While these plots provided a good qualitative view of how far upstream the reverse flow region reaches at the onset of dynamic stall, the skin friction coefficient is examined next for a quantitative assessment.
Contours of chordwise relative flow velocity for the four airfoils immediately before onset of dynamic stall. The contours are cut off above 0 to identify reverse flow regions.

Distributions of
 $\langle \widetilde{C_{P}}\rangle$
and
 $\langle \widetilde{C_{f}}\rangle$
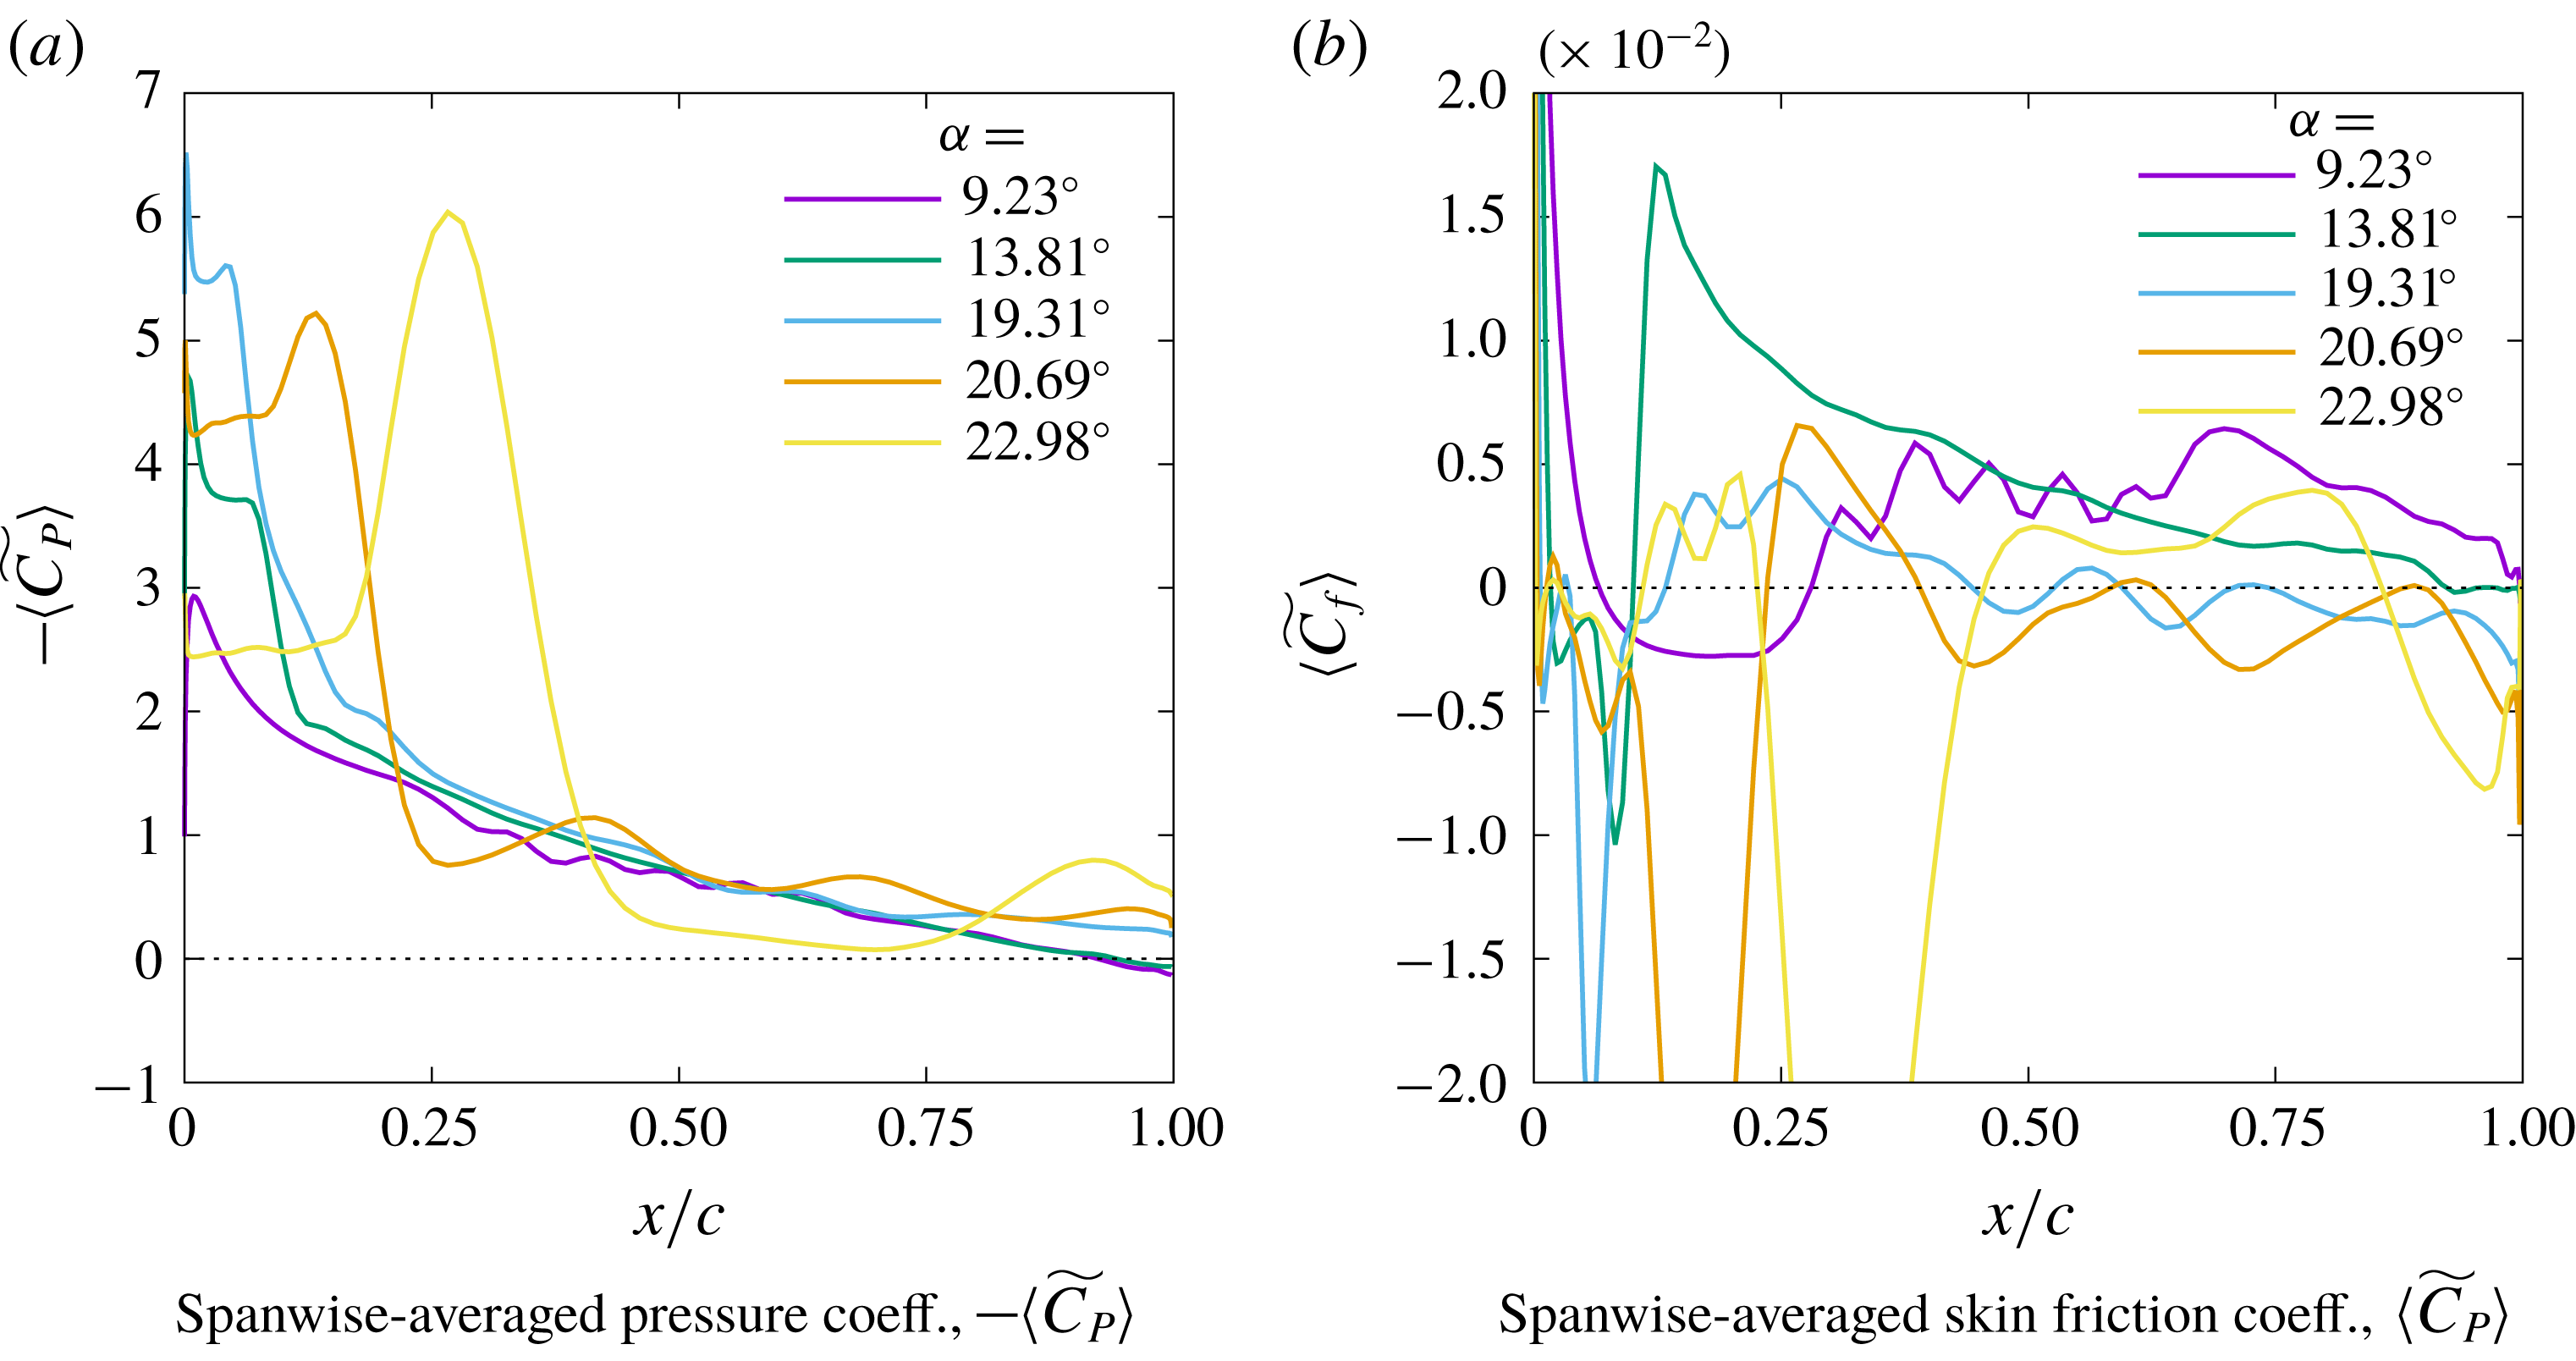
along the NACA 0015 chord at five angles of attack during the pitch-up manoeuver.

Figure 15 shows line plots of
 $-\langle \widetilde{C_{P}}\rangle$
and
 $\langle \widetilde{C_{f}}\rangle$
along the NACA 0015 airfoil chord at five different angles of attack (
 $\unicode[STIX]{x1D6FC}$
) during the pitch-up manoeuver. The
 $\unicode[STIX]{x1D6FC}$
values are selected to illustrate a few interesting stages. At
 $\unicode[STIX]{x1D6FC}=9.23^{\circ }$
, the laminar boundary layer over the airfoil locally separates (see
 $\langle \widetilde{C_{f}}\rangle$
plot) and transitions; the transition region shows oscillations corresponding to the instability modes in both
 $\langle \widetilde{C_{P}}\rangle$
and
 $\langle \widetilde{C_{f}}\rangle$
. At
 $\unicode[STIX]{x1D6FC}=13.81^{\circ }$
, the LSB is securely positioned close to the airfoil leading edge and the boundary layer transitions abruptly right behind the LSB. Some evidence of the turbulent boundary layer separating near the trailing edge is also visible. Further increase in
 $\unicode[STIX]{x1D6FC}$
to
 $19.31^{\circ }$
causes the LSB to move upstream and shrink in size. At this time, the turbulent boundary layer is separated beyond mid-chord (
 $\langle \widetilde{C_{f}}\rangle <0$
). The LSB bursts as
 $\unicode[STIX]{x1D6FC}$
is increased beyond
 $19.31^{\circ }$
and the DSV forms. The DSV is seen as locally increased
 $\langle \widetilde{C_{P}}\rangle$
value in the curves for
 $\unicode[STIX]{x1D6FC}=20.69^{\circ }$
and
 $22.98^{\circ }$
. As the DSV forms and convects downstream, some part of the turbulent boundary layer reattaches (as seen in the
 $\langle \widetilde{C_{f}}\rangle$
curve for
 $\unicode[STIX]{x1D6FC}=22.98^{\circ }$
) due to the large induced velocity by the DSV. This is marked as ‘flow reversal boundary’ in figures 10 and 11.
Figure 16 compares
 $\langle \widetilde{C_{f}}\rangle$
distributions between the four airfoils taken immediately prior to the bursting of the LSB. No flow separation is seen near the trailing edge for the thinnest airfoil. The NACA 0012 simulation shows reverse flow in a very small region near the trailing edge. More than 50 % of the NACA 0015 airfoil experiences reverse flow before LSB burst, while for NACA 0018, the turbulent flow separation point reaches the edge of the LSB before the onset of dynamic stall. The close proximity of the turbulent flow separation with the LSB suggests that the stall onset could be caused either by the bursting of the LSB or by the separated turbulent boundary layer interacting with the LSB for the NACA 0018 airfoil.
The
 $\langle \widetilde{C_{f}}\rangle$
distributions on the suction surfaces of the four airfoils immediately before onset of dynamic stall.

6 Conclusions
Onset of dynamic stall is investigated at
 $Re_{c}=2\times 10^{5}$
for four symmetric NACA airfoils of varying thickness: 9 %, 12 %, 15 % and 18 %. A constant-rate pitch-up airfoil motion about the quarter-chord point is investigated using wall-resolved large eddy simulations. Comparisons are drawn against XFOIL for static simulations at angle of attack,
 $\unicode[STIX]{x1D6FC}=4^{\circ }$
. Overall, the agreement between FDL3DI and XFOIL in predicting
 $C_{P}$
and
 $C_{f}$
distributions is quite good. XFOIL however does not capture the two-stage transition process observed in FDL3DI for relatively thinner (9 % and 12 %) airfoils. XFOIL also does not show any significant change in
 $\unicode[STIX]{x2202}C_{f}/\unicode[STIX]{x2202}x$
with airfoil thickness, whereas FDL3DI predicts a large increase with thickness.
The effect of finite span size is evaluated by investigating spanwise coherence of pressure (appendix B). It is found that the correlation is rather small in the stall incipience region and hence onset of stall can be investigated with the span length of 10 % chord utilized in this study.
Dynamic simulations show the following sequence of events: (i) upstream movement of the transition location, (ii) formation of a laminar separation bubble (LSB) and rise in suction peak pressure, (iii) LSB burst followed by formation of the dynamic-stall vortex (DSV), (iv) roll up of boundary layer vorticity into a vortex (shear layer vortex or SLV), (v) sharp increase in pitch-down moment (moment stall) and (vi) precipitous drop in airfoil lift (lift stall). While all the airfoils undergo the same sequence of events, the duration of each event and the associated aerodynamics differ substantially with airfoil thickness. The thinnest airfoil tested (NACA 0009) experiences the largest increase in sectional lift coefficient whereas the highest peak suction pressure is obtained for the thickest airfoil (NACA 0018).
Comparisons of
 ${C_{P}}_{rms}$
, where mean
 $C_{P}$
is obtained via low-pass filtering the solution, show high correlation between increase in
 ${C_{P}}_{rms}$
and sharp increase in
 $C_{f}$
, thus verifying that
 ${C_{P}}_{rms}$
measurements can be effectively used to locate boundary layer transition (
 ${C_{P}}_{rms}$
is the root mean square of
 $C_{P}$
).
Spatio-temporal diagrams of spanwise-averaged
 $-C_{P}$
and
 $C_{f}$
clearly show the different stages of dynamic stall, and highlight the differences between the different airfoils. The
 $\unicode[STIX]{x1D6FC}$
up to which the LSB is sustained increases with airfoil thickness. The peak value of
 $-C_{P}$
near airfoil leading edge, increases with airfoil thickness. In all cases, the LSB bursts is followed by the formation of the DSV, however the characteristics of the DSV and its convection speed vary with airfoil thickness, with the highest speed for the thickest airfoil.
Investigation of skin friction coefficient on the suction surface shows that while turbulent boundary layer separation is nearly non-existent for NACA 0009, the separation (flow reversal) region for NACA 0018 extends from the trailing edge all the way up to the LSB location immediately before dynamic stall occurs. This observation suggests that stall onset could have been triggered by the turbulent separation region reaching up to and interacting with the LSB for the NACA 0018 airfoil, and the possibility that mechanism of stall onset gradually changes with airfoil thickness from that due solely to LSB burst to that due to interaction of trailing edge separation with the LSB.
Acknowledgements
Funding for this research is provided by the AFOSR Summer Faculty Fellowship program and by the National Science Foundation under grant no. NSF/CBET-1554196. Computational resources are provided by NSF XSEDE (grant # TG-CTS130004) and the Argonne Leadership Computing Facility, which is a DOE Office of Science User Facility supported under Contract DE-AC02-06CH11357. The authors acknowledge the support of Mr A. Bodling in carrying out the simulations used for the verification study described in § 4.1. The second author would like to acknowledge support by AFOSR under a task monitored by Dr D. Smith, and by a grant of HPC time from the DoD HPC Shared Resource Centers at AFRL and ERDC. Technical support for the FDL3DI software provided by Dr D. Garmann of the Air Force Research Laboratory is acknowledged.
Appendix A. Mesh sensitivity study
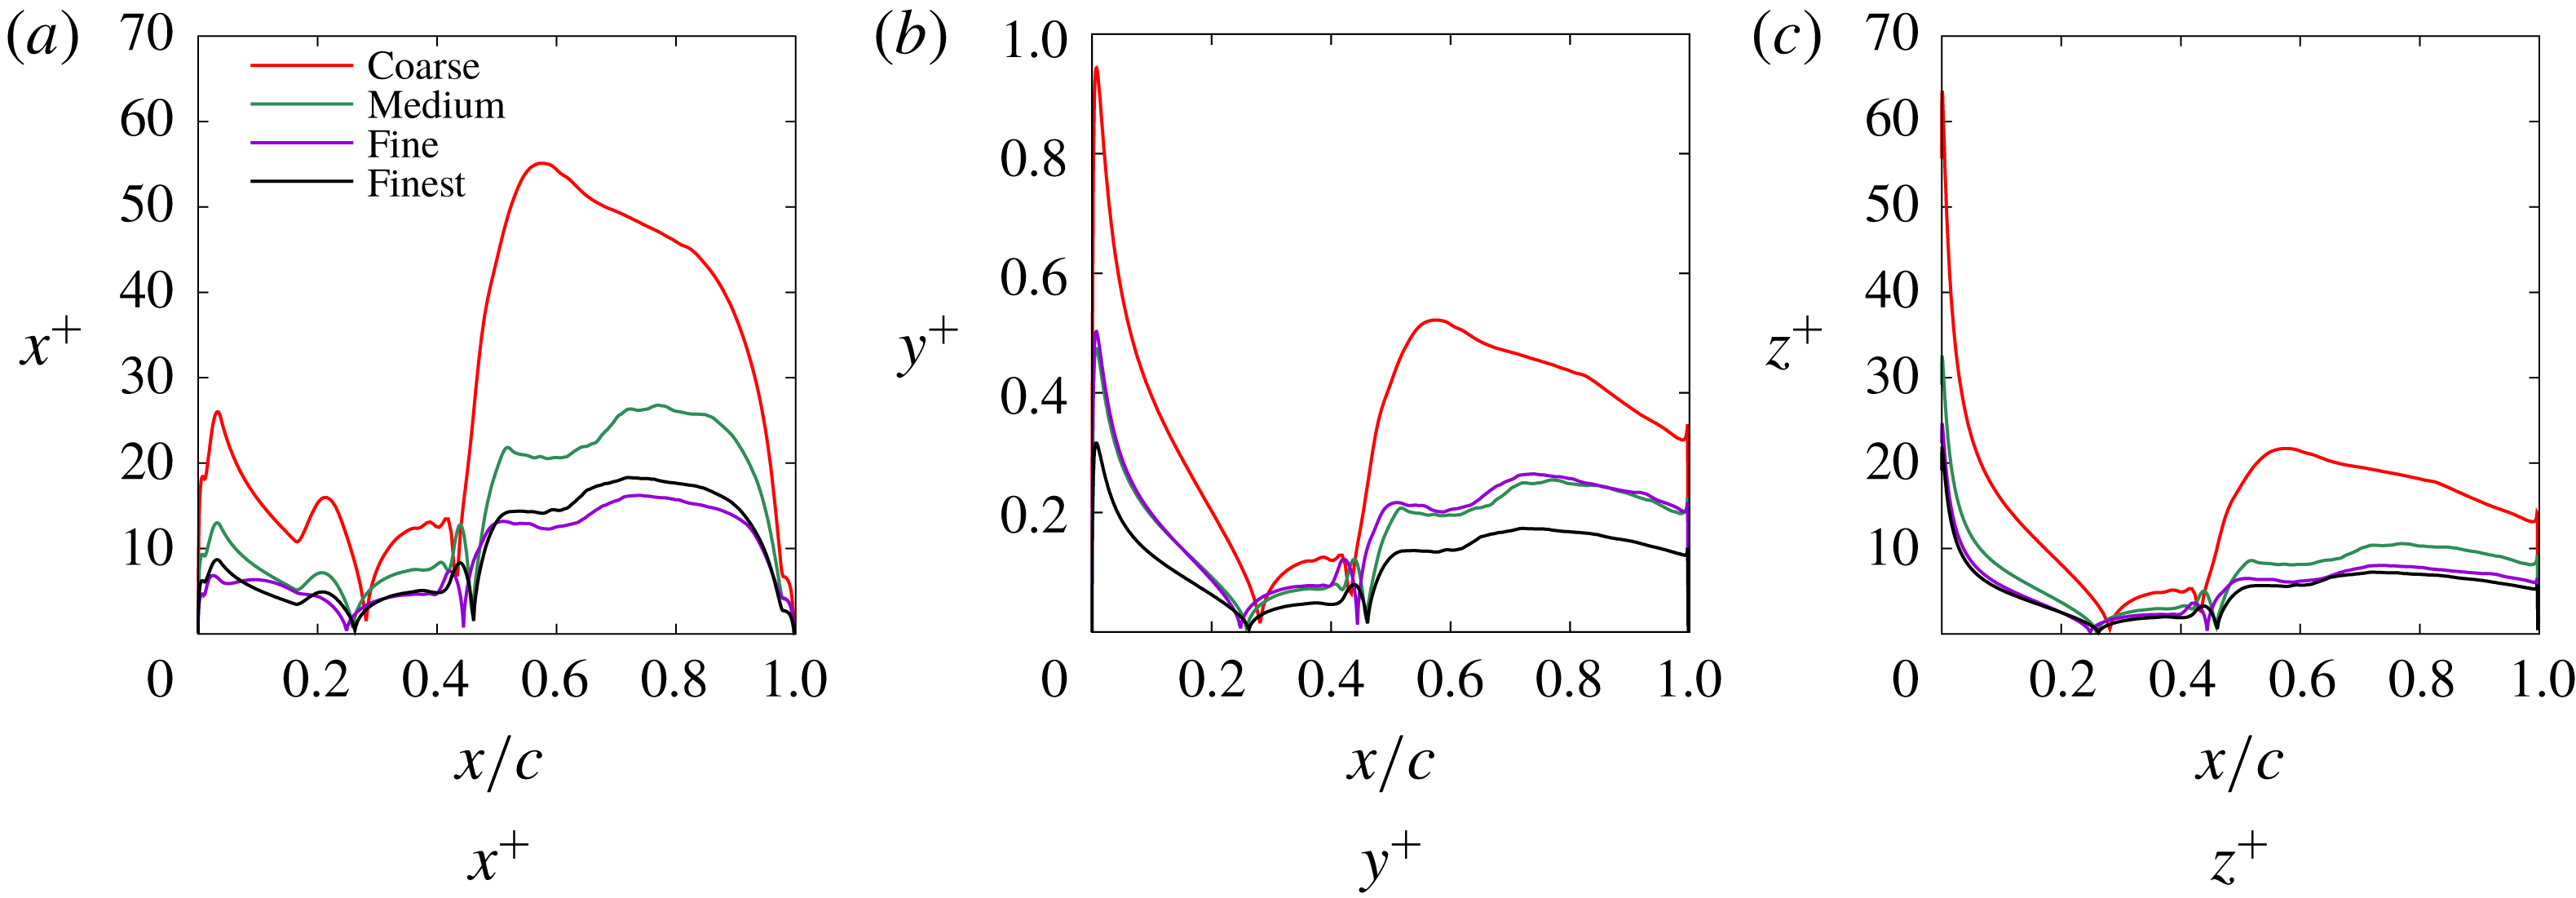
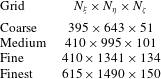
A mesh sensitivity study is performed where dependence of the results on grid size is evaluated for both static and dynamic simulations. Four mesh sizes are evaluated. The overall grid dimensions for the different meshes are provided in table 2 and the distributions of the first cell sizes (in wall units) on the suction surface are compared in figure 17. The non-dimensional cell sizes are evaluated using the static simulations of NACA-0012 airfoil performed at
 $\unicode[STIX]{x1D6FC}=4^{\circ }$
. The values of
 $x^{+},~y^{+},$
and
 $z^{+}$
are well below the values recommended in the literature for LES.
Distribution of first cell sizes in wall units on the suction surface of the airfoil from static simulations at
 $\unicode[STIX]{x1D6FC}=4^{\circ }$
.

Dimensions of the four meshes used for the mesh sensitivity study. Mesh dimensions are listed as
 $N_{\unicode[STIX]{x1D709}}\times N_{\unicode[STIX]{x1D702}}\times N_{\unicode[STIX]{x1D701}}$
.

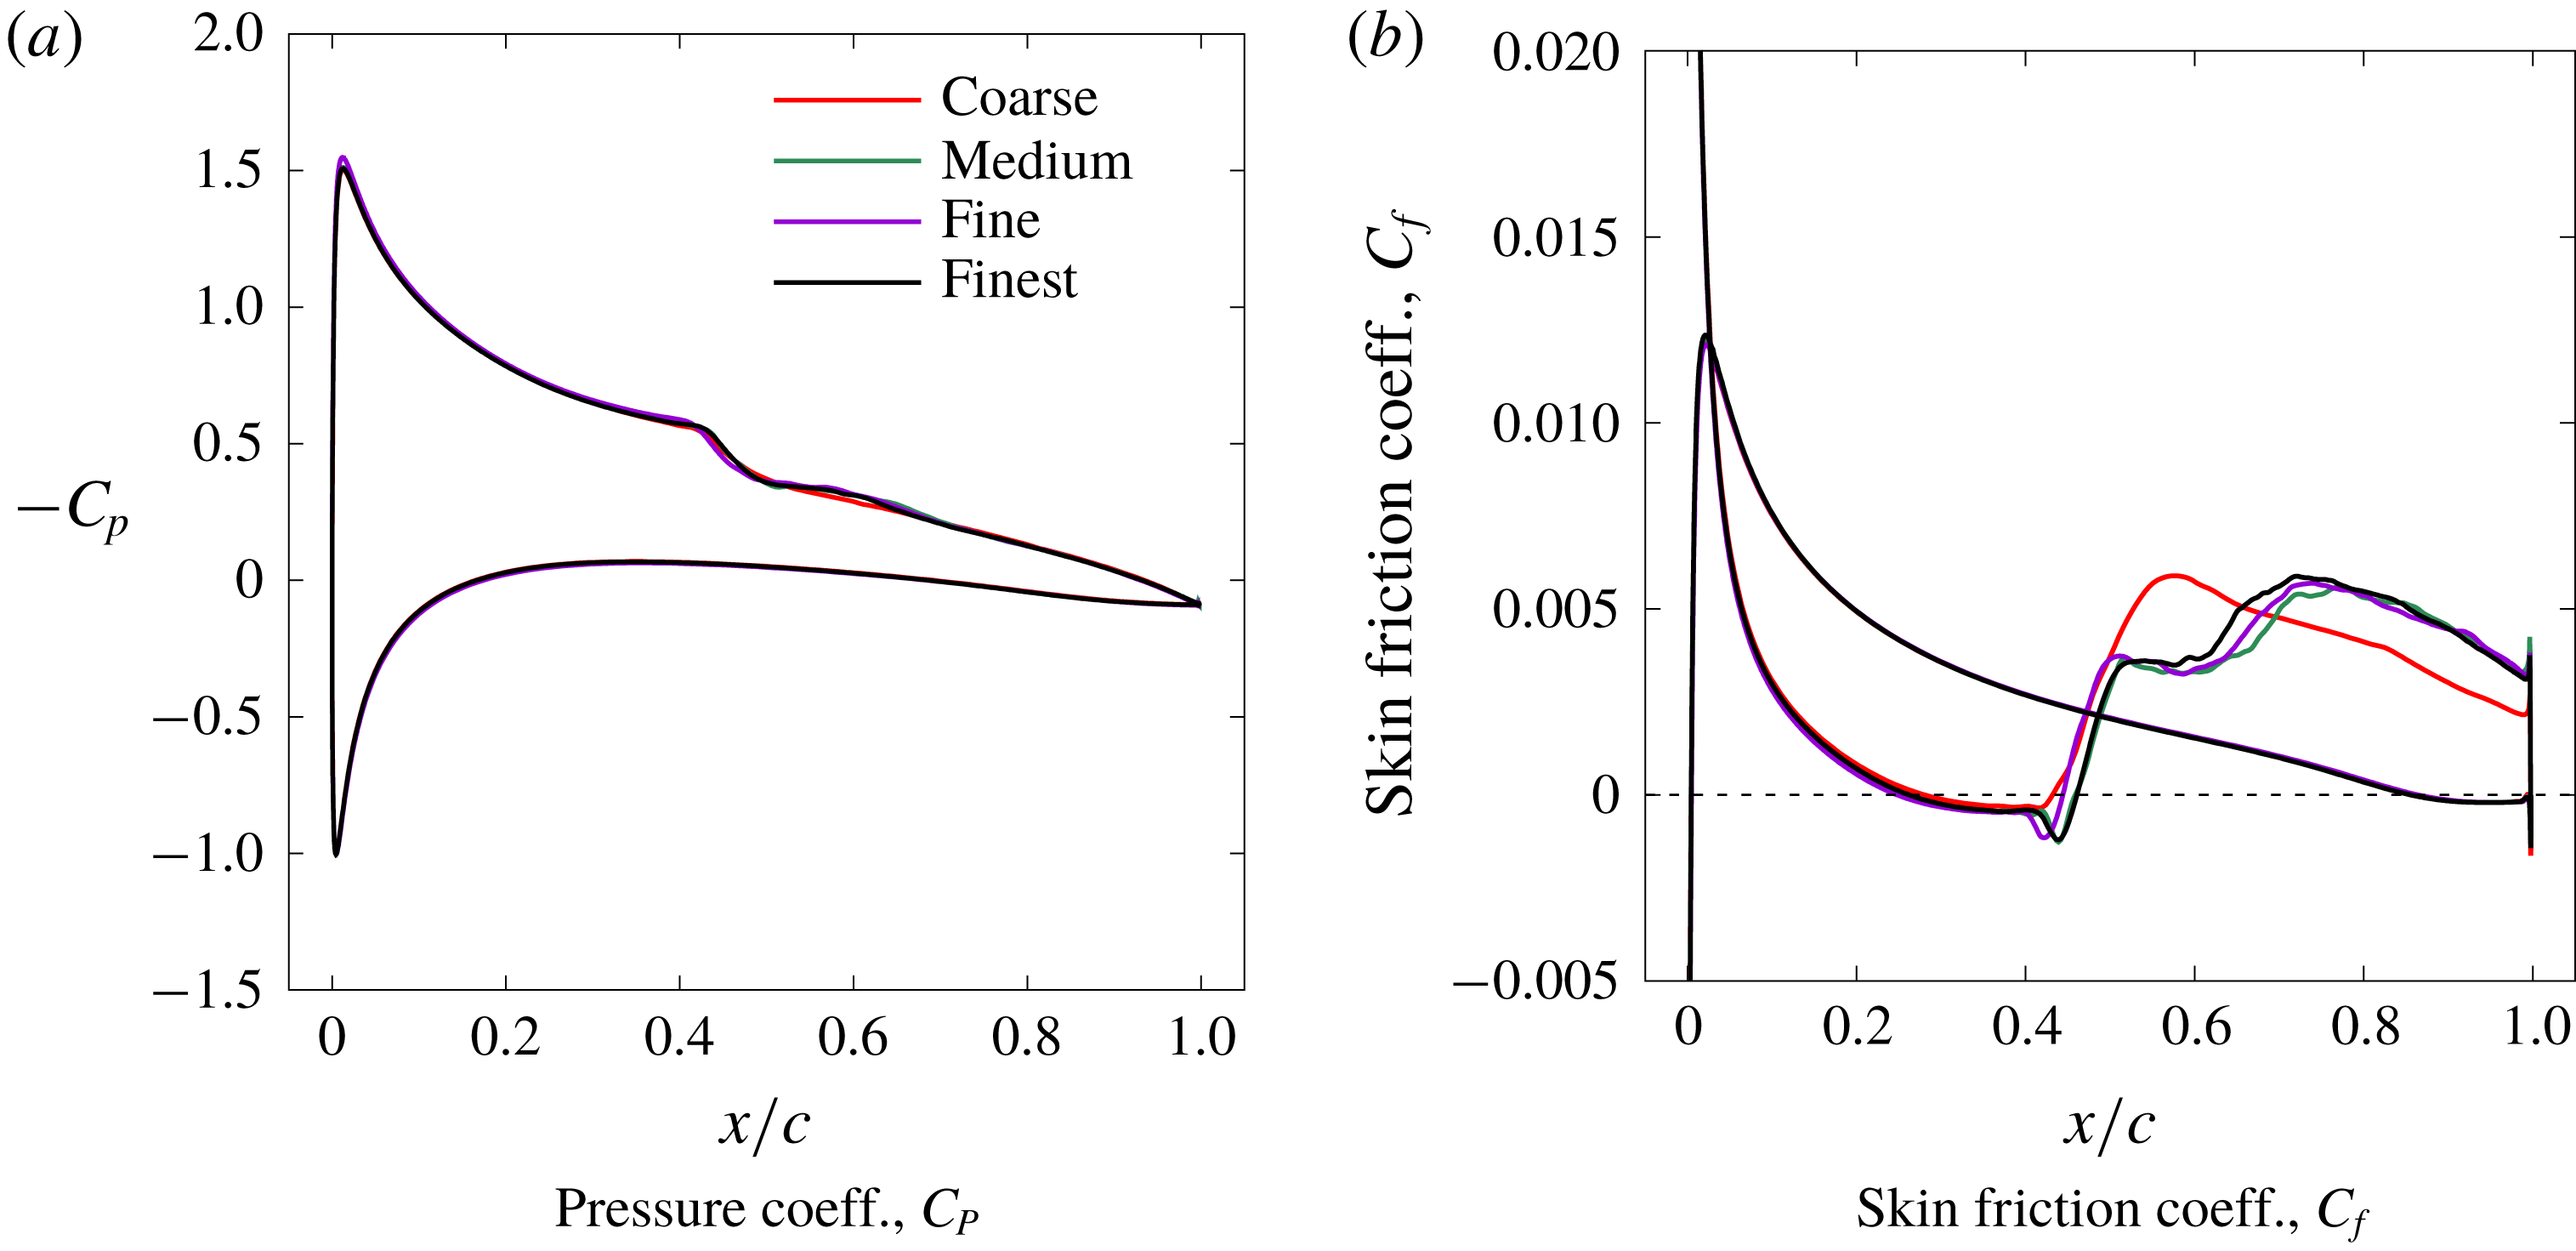
Aerodynamic pressure coefficient and skin friction coefficient for the static simulations are compared between the four grids in figure 18. All four grids capture the transition location (at
 $x/c\approx 0.45$
) on the suction surface, which is triggered in the shear layer formed due to the laminar separation. The turbulent boundary layer then reattaches to the surface forming a laminar separation bubble (LSB). The Coarse grid shows a slightly shorter LSB as seen by inspecting the
 $C_{f}$
plot (figure 18
b). Furthermore, the Medium, Fine and Finest grids show an extended transition region as compared to the Coarse grid. The Medium, Fine and Finest grids show very comparable results.
Results of static simulations to investigate mesh sensitivity.

The time step for the dynamic simulations is kept fixed at
 $2\times 10^{-5}$
units for all three grids. The airfoil is pitched up at a constant rate from
 $\unicode[STIX]{x1D6FC}=4^{\circ }$
until lift stall occurs. Figure 19(a,b) compares the predicted histories of lift and drag coefficients for the three grids. The differences between the Coarse grid and the other three grids are more apparent in the dynamic simulation results. Dynamic stall does not begin until
 $\unicode[STIX]{x1D6FC}=24^{\circ }$
with the Coarse grid, whereas stall onset is observed at around
 $\unicode[STIX]{x1D6FC}=17^{\circ }$
with the other three grids. The Medium, Fine and Finest grids exhibit very similar time histories for
 $c_{l}$
and
 $c_{d}$
. Figure 19(c–f) plots the
 $C_{p}$
distribution over the suction surface of the airfoil. The streak of large negative
 $C_{p}$
that moves downstream as
 $\unicode[STIX]{x1D6FC}$
is increased is associated with the dynamic-stall vortex (DSV). The formation of the DSV is significantly delayed in the Coarse grid simulation, whereas the Medium, Fine and Finest grids yield converged results. Based on this study, the Fine grid is selected for the simulations with cell counts in the radial, circumferential and spanwise directions equal to 410, 1341 and 134 respectively, giving a total cell count of approximately 74 million.
Results of dynamic simulations to investigate mesh sensitivity. Panels (a) and (b) show airfoil sectional lift and drag coefficients as functions of angle of attack,
 $\unicode[STIX]{x1D6FC}$
. Panels (c), (d), (e) and (f) show variation of
 $-C_{P}$
with
 $\unicode[STIX]{x1D6FC}$
over the suction side of the airfoil. The DSV formation occurs at much higher
 $\unicode[STIX]{x1D6FC}$
in the Coarse grid simulation.

Appendix B. Effect of finite span in the simulations
The impact of using finite span length is assessed by investigating spanwise coherence at different stages during the pitch-up manoeuver defined in figure 7. Magnitude squared coherence
 $\unicode[STIX]{x1D6FE}^{2}(\unicode[STIX]{x0394}z)$
is defined as
 $$\begin{eqnarray}\displaystyle \unicode[STIX]{x1D6FE}^{2}(\unicode[STIX]{x0394}z)=\frac{\langle |S_{xy}|^{2}\rangle }{\langle S_{xx}\rangle \langle S_{yy}\rangle }, & & \displaystyle\end{eqnarray}$$
where
 $S_{xy}=\int _{-\infty }^{\infty }\exp (-\text{i}\unicode[STIX]{x1D714}\unicode[STIX]{x1D70F})R_{xy}(\unicode[STIX]{x1D70F})\,\text{d}\unicode[STIX]{x1D70F}$
is the cross-spectral density of pressures between two points along the span separated by
 $\unicode[STIX]{x0394}z$
, at a fixed chordwise location of
 $x/c=0.5$
;
 $S_{xx}=\int _{-\infty }^{\infty }\exp (-\text{i}\unicode[STIX]{x1D714}\unicode[STIX]{x1D70F})R_{xx}(\unicode[STIX]{x1D70F})\,\text{d}\unicode[STIX]{x1D70F}$
and
 $S_{yy}=\int _{-\infty }^{\infty }\exp (-\text{i}\unicode[STIX]{x1D714}\unicode[STIX]{x1D70F})R_{yy}(\unicode[STIX]{x1D70F})\,\text{d}\unicode[STIX]{x1D70F}$
are power spectral densities at each of the two points. The cross-spectral and power spectral densities are respectively the Fourier transforms of the cross-correlation (
 $R_{xy}(\unicode[STIX]{x1D70F})$
) and auto-correlation (
 $R_{xx}(\unicode[STIX]{x1D70F})$
) functions of the signals (pressure time history). The angular brackets in (B 1) denote ensemble average, which is reduced to time averaging here by assuming ergodicity.
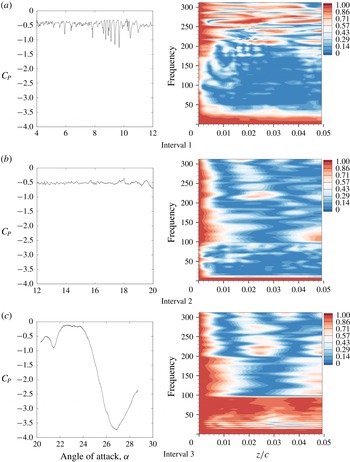
An assessment of the adequacy of the simulated span length shown for the NACA 0015 airfoil. The pitch-up manoeuver is divided into three intervals. The line plots on the left show
 $C_{P}$
at a reference point
 $x/c=0.5,z/c=0$
. The contour plots on the right show spanwise coherence (
 $\unicode[STIX]{x1D6FE}^{2}$
) of
 $C_{P}$
at
 $x/c=0.5$
for each time interval.

The entire pitch-up manoeuver is divided into three time intervals. The left plots in figure 20 plot the pressure signal in the time domain at a reference point on the airfoil suction surface (
 $x/c=0.5;z/c=0$
) for these three intervals. Magnitude square coherence,
 $\unicode[STIX]{x1D6FE}^{2}(\unicode[STIX]{x0394}z)$
plots for each of these intervals are shown on the right in figure 20. The first interval is characterized by strong instability modes that ultimately cause boundary layer transition on the suction surface. These instability modes are highly correlated in the span direction; they are essentially two-dimensional. The coherence plot for this time interval shows high spanwise correlation at several high frequencies corresponding to these essentially 2-D modes.
In the second interval, the boundary layer is turbulent at the selected chordwise location, and dynamic-stall onset occurs towards the very end of the interval (
 $\unicode[STIX]{x1D6FC}\sim 20^{\circ }$
). The corresponding coherence plot shows relatively small spanwise coherence, suggesting that the simulated span length is sufficient to investigate onset of dynamic stall.
In the third time interval, the DSV convects over the chordwise location,
 $x/c=0.5$
and the airfoil experiences deep stall. Very large coherence is observed at low frequencies corresponding to the large scale, slow-moving DSV. Visbal & Garmann (Reference Visbal and Garmann2018) performed similar dynamic-stall simulations with the model span varying from 0.1
 $c$
to 1.6
 $c$
and found the DSV to be highly correlated over the entire span, even for the largest span simulated. The spanwise contours of
 $C_{P}$
in figure 4 of Visbal & Garmann (Reference Visbal and Garmann2018) suggest that the correlation coefficient is very close to unity throughout the span in the region influenced by the DSV, until the DSV reaches the airfoil trailing edge (lift-stall point). The aerodynamic loads and surface pressure distributions were therefore found to be very similar between the different span simulation results until lift stall occurred. Finite-span effect was observed in the results only beyond the lift-stall point. The span length of 10 % chord used for the analysis in this paper, is therefore sufficient to study the dynamic stall phenomenon, particularly the onset of dynamic stall.
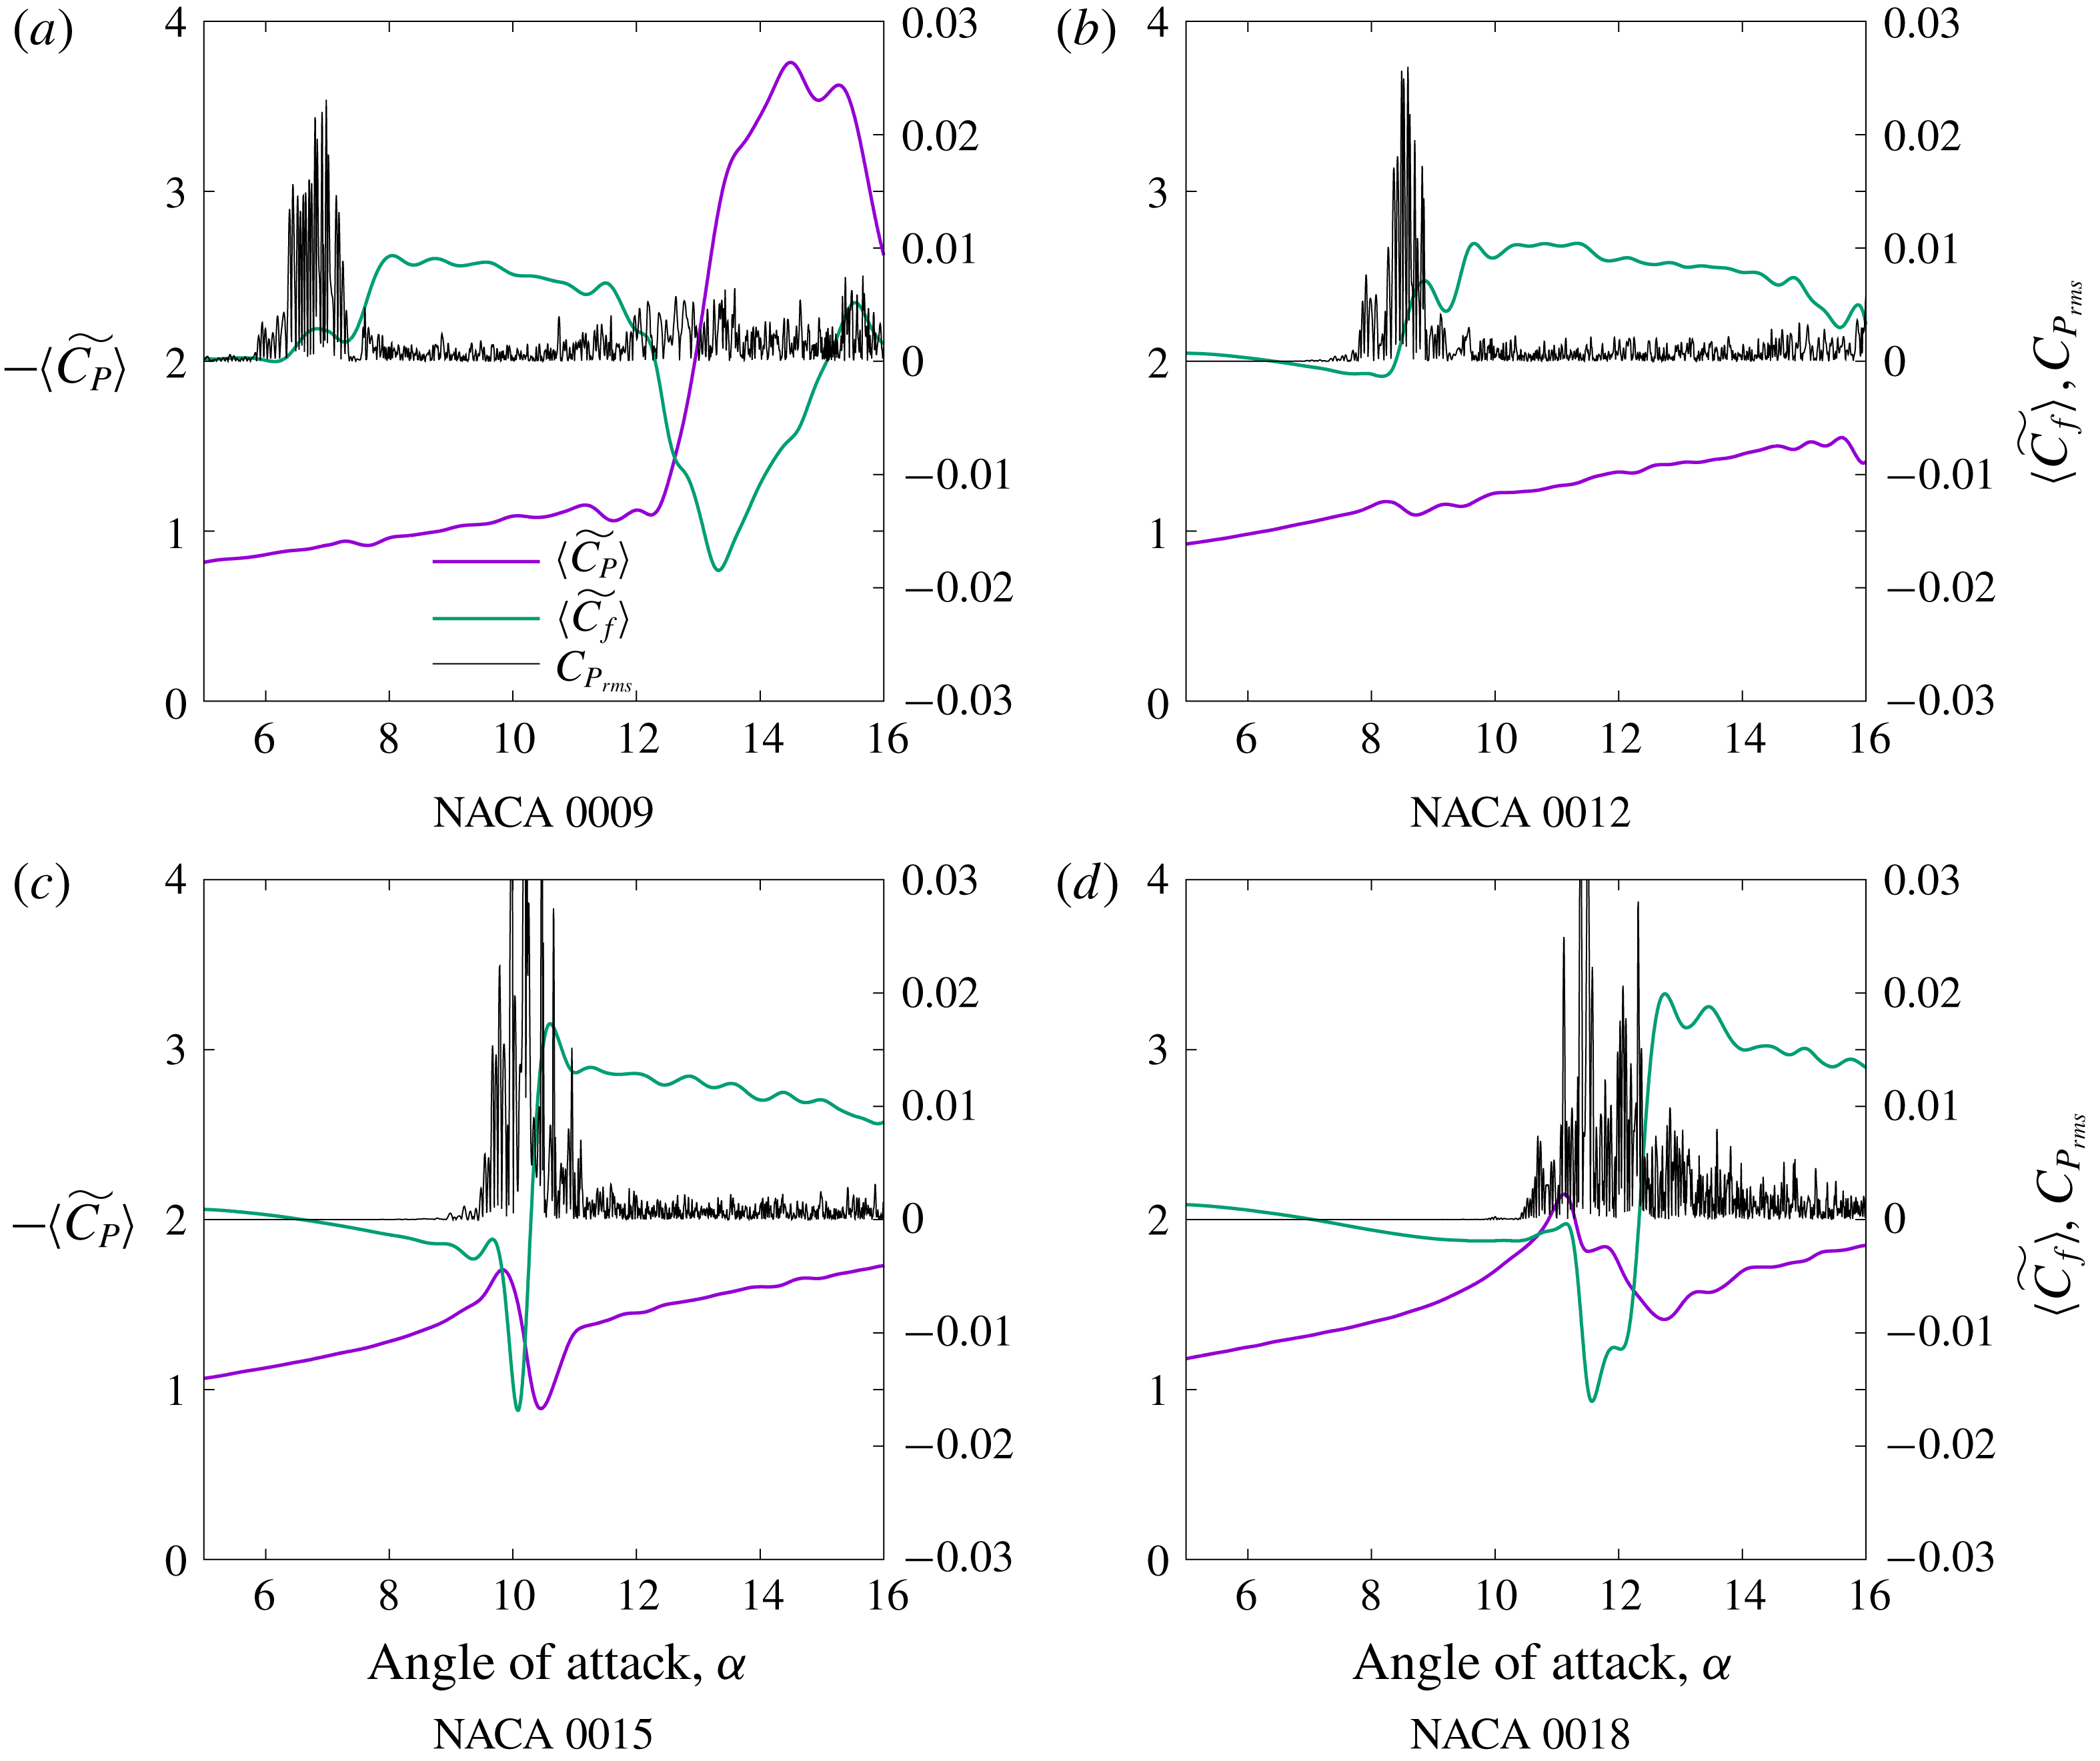
Identification of transition location using
 ${C_{P}}_{rms}$
,
 $\langle \widetilde{C_{P}}\rangle$
and
 $\langle \widetilde{C_{f}}\rangle$
.

Appendix C. Boundary layer transition
The transition location is investigated in detail using time accurate pressure data sampled at several stations along the airfoil suction surface. Pressure and velocity data are collected at one cell height away from the surface. The data are collected with a sampling rate of
 $\unicode[STIX]{x0394}f=25\,000\times u/c$
, which is approximately 80 000 data points for each degree of airfoil rotation. Aerodynamic pressure coefficient (
 $C_{P}$
) is averaged along the span to obtain
 $\langle C_{P}\rangle$
, which is further low-pass filtered, and the filtered quantity is denoted by
 $\langle \widetilde{C_{P}}\rangle$
. Considering
 $\langle \widetilde{C_{P}}\rangle$
as a quantity averaged locally in time, and following Visbal & Garmann (Reference Visbal and Garmann2018), we define the root-mean-square (r.m.s.) of pressure fluctuations with respect to this filtered value as
 ${C_{P}}_{rms}=|\langle C_{P}\rangle -\langle \widetilde{C_{P}}\rangle |$
. Early experiments (e.g. Lorber & Carta Reference Lorber and Carta1988) and some recent measurements at very high sampling rates (Gupta & Ansell Reference Gupta and Ansell2017), have used r.m.s. pressure to identify transition location during dynamic stall. Transition location is identified by a sharp increase in wall pressure fluctuations.
Figure 21 plots
 ${C_{P}}_{rms}$
,
 $\langle \widetilde{C_{P}}\rangle$
, and
 $\langle \widetilde{C_{f}}\rangle$
for the four airfoils at
 $x/c=0.02$
as they go through the pitch-up manoeuver. A large increase in
 ${C_{P}}_{rms}$
(defined with respect to
 $\langle \widetilde{C_{P}}\rangle$
) is clearly visible for each airfoil, which coincides with the angle of attack where
 $\langle \widetilde{C_{f}}\rangle$
increases sharply. For the simulations considered, the
 $\langle \widetilde{C_{f}}\rangle$
dips negative before the transition location, which is due to the reverse flow inside the LSB. The sharp jumps observed in
 ${C_{P}}_{rms}$
and
 $\langle \widetilde{C_{f}}\rangle$
are consistent with the increase in fluctuations due to the boundary layer turning turbulent. At the transition location, a dip in suction pressure (
 $\langle \widetilde{C_{P}}\rangle$
) is also observed, consistent with the measurements reported in Gupta & Ansell (Reference Gupta and Ansell2017).