INTRODUCTION
The coexistence of different individual phenotypes within populations of the same species has fascinated biologists for centuries (Bond Reference BOND2007). Understanding the forces behind the maintenance of different morphs within a population has provided important clues on the effects of natural selection in the wild (Carlson & Holsinger Reference CARLSON and HOLSINGER2010, White & Kemp Reference WHITE and KEMP2016). Studies of insect colouration, notably of colour patterns on the wings of butterflies and moths, have contributed excellent case studies of adaptive colour polymorphism.
One of the best-known examples of polymorphism is the co-occurrence of melanic and non-melanic morphs of Biston betularia (Cook & Saccheri Reference COOK and SACCHERI2013, Cook et al. Reference COOK, GRANT, SACCHERI and MALLET2012). Sexual and natural selection may also influence polymorphism as in sex-related mimicry (Kunte et al. Reference KUNTE, ZHANG, TENGER-TROLANDER, PALMER, MARTIN, REED, MULLEN and KRONFORST2014) where females mimic locally common model species, while males are fixed in their phenotype due to sexual selection by female choice.
The tropical genus Heliconius is well known for its widespread geographic variation in wing colour patterns within species (Kronforst & Papa Reference KRONFORST and PAPA2015). Yet, within population polymorphism is not common. Two examples are provided by Heliconius numata, in which coexisting morphs mimic different co-occurring ithomiine species models (Brown & Benson Reference BROWN and BENSON1974, Joron et al. Reference JORON, WYNNE, LAMAS and MALLET1999), and H. cydno galanthus where morphs mimic two different local model species (Kapan Reference KAPAN2001). Subtle polymorphism is found in the eastern South American race H. erato phyllis, which has variable number of red elements on its hind wing, so-called red raylets (Emsley Reference EMSLEY1964, Sheppard et al. Reference SHEPPARD, TURNER, BROWN, BENSON and SINGER1985). Field studies in Brazil have quantified polymorphism in natural populations (Pansera & Araujo Reference PANSERA and ARAUJO1983, Ramos & Freitas Reference RAMOS and FREITAS1999). These studies also suggest that the relative frequency of the phenotypes changes with the season.
The nature of this polymorphism remains unknown and previous works have described the phenomenon but have not evaluated why populations are polymorphic. Additionally, few explanations have been put forward to explain the seasonal variation and no rigorous statistical evaluation has been applied to the data.
Thus, we established a 3-y study in a highly seasonal area of the Brazilian north-east coast to test the hypotheses that (1) polymorphism is correlated with ecological traits and (2) polymorphism has a seasonal component.
MATERIALS AND METHODS
Field study
The study was conducted in the Mata do Jiqui (5°55′S, 35°10′W), an 80-ha Atlantic Forest remnant located 15 km south of the city of Natal, Brazil. From 2006 to 2009, we captured Heliconius butterflies along trails within the forest (~1000 m) and along the forest border (~2000 m). The study was conducted during the dry (January–March) and wet (July–September) periods of the year. Average temperatures (and rainfall) for the dry and wet seasons are 27.1°C (113 mm) and 24.5˚C (143 mm), respectively. Field visits were made at irregular intervals during each season, with an average number of 13 d per season (range = 7–21 d). During these surveys, we captured adult butterflies with hand nets and scored individuals for sex, age, wing length, phenotype and pollen-load size.
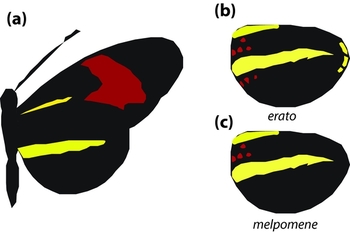
We scored phenotypes with regards to two wing colour elements, red basal spots and red raylets (Figure 1). To provide a more comprehensive view of the system, we also scored the co-mimic H. melpomene nanna.
Depiction of eastern Brazil Heliconius phenotypes and the colour elements scored for analysis of polymorphism. Variation in colour pattern elements was studied in an Atlantic forest remnant in highly seasonal north-eastern Brazil. Generalized view of dorsal wing colour pattern of eastern Brazil Heliconius erato and Heliconius melpomene co-mimics (a). Representation of an isolated ventral hind-wing showing the colour elements of H. erato phyllis. Dots above the central yellow band are called basal red dots, and dots below yellow band are called red raylets (b). Representation of an isolated ventral hind-wing of H. melpomene nanna. Note that this species lacks red raylets (c). Figure is based on a drawing from Sheppard et al. (Reference SHEPPARD, TURNER, BROWN, BENSON and SINGER1985).

Red basal spots are small red dots found on the wings of H. erato phyllis and H. melpomene nanna (Emsley Reference EMSLEY1964). These dots are located above the yellow bar that crosses the middle of the hind wing. Red raylets are small red dots or rays that are exclusive to H. erato and are most prominent in H. erato phyllis (Emsley Reference EMSLEY1964) (Figure 1b). The area below the yellow bar of the hind wing of H. melpomene nanna is devoid of red dots or any other markings (Figure 1c). Wing length was measured with a calliper to the nearest 0.1 cm.
We estimated pollen-load sizes by inspecting the proboscis of the butterfly and using a categorical scale like the one employed by Cardoso (Reference CARDOSO2001). Based on their relative size, loads were scored as 0 (no pollen), 0.5 (trace), 1, 2 or 3 (maximum amount).
Statistical analyses
Seasonal changes in phenotype frequency
To evaluate the hypothesis of seasonal changes in phenotype frequency we used contingency tables and tested for an association between season and frequency of wing pattern element. Season was a categorical variable with only two states (dry/wet). Number of dots was a count variable, with number of individual in each category entered as data in the contingency table. We used a G-test with no correction in the DescTools package (Signorelli, https://cran.r-project.org/package=DescTools) in R (R Developmental Core Team, http://www.R-project.org).
Although both Pansera & Araujo (Reference PANSERA and ARAUJO1983) and Ramos & Freitas (Reference RAMOS and FREITAS1999) claim that the distribution of red raylets in H. erato phyllis varies seasonally, they did not provide statistical tests of their data. To make a more formal statistical comparison with their studies, we recoded their data and performed the same association tests employed in our data. To do so, we coded their frequency data (Table I in Pansera & Araujo (Reference PANSERA and ARAUJO1983), and Table 4 in Ramos & Freitas (Reference RAMOS and FREITAS1999)) into categories and evaluated if red raylet frequency was associated with season.
Wing length
We used wing length to ascertain whether adult size changes as a function of season. Because adult size is an indication of larval feeding (Boggs Reference BOGGS1981, Karlsson Reference KARLSSON1995) we reasoned that one potential effect of season was on the availability of host plants or on the host quality to larvae. To test this, we used two-way analysis of variance, using species and season as predictors and wing length as the response variable. To test whether wing length was related to the number of dots (phenotype), we used general linear models with Poisson error for each species separately. The analysis was carried using the MASS package (Venables & Ripley Reference VENABLES and RIPLEY2002) in R (R Developmental Core Team, http://www.R-project.org).
Pollen loads
To analyse if pollen loads changed as a function of season and/or varied between species, we used log-linear models. In performing this analysis, we assumed that changes in pollen load size are a consequence of changes in resource availability and/or biophysical stress caused by changes in rainfall and temperature in the different seasons. Log-linear models construct contingency tables and use hierarchical modelling to test for independence between factors (Agresti Reference AGRESTI2002). Models are selected based on the loss of fit caused by the removal of a variable. The goals of this analysis were to assess whether pollen-load sizes varied with season and whether they vary between the two species. This approach was also employed to test for an association between size of pollen load, phenotype class and season. Because phenotypes were unique for each species, we performed three separate tests, two for H. erato (upper red dots and red raylets) and one for H. melpomene (upper red dots). Loglinear analyses were performed using the MASS package (Venables & Ripley Reference VENABLES and RIPLEY2002) in R (R Developmental Core Team, http://www.R-project.org).
RESULTS
We captured and scored 513 H. melpomene and 432 H. erato. The numeric superiority of H. melpomene over H. erato was evident in the dry (190 vs 145) as well as in the wet season (323 vs 287).
Variation in wing colour elements
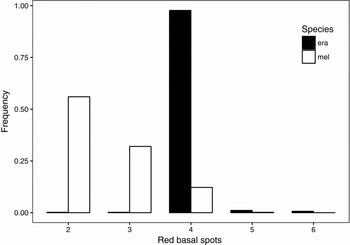
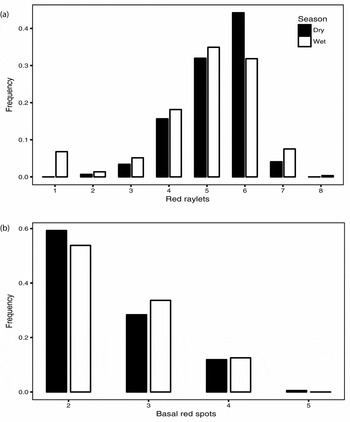
The nature and extent of variation of the number of dots depended on the wing element being scored. This was most obvious on the wings of Heliconius erato, where the number of red basal dots was highly canalized, with 98% of individuals having four dots (Figure 2). Contrast this to the amount of variation in number of red raylets, which ranged from one to eight, with four to six being the most common values (Figure 3a). Red basal dots on the wings of H. melpomene were more variable, ranging from two to five, with a preponderance of two dots (Figure 2).
Frequency distribution of the number of red basal spots on the hindwings of Heliconius erato phyllis (era) and Heliconius melpomene nanna (mel). Data were collected over a 3-y period in an Atlantic forest remnant in north-eastern Brazil.

Frequency distribution of wing colour elements in Heliconius wings as a function of season (dry vs. wet) over a 3-y sampling period in an Atlantic forest remnant in north-eastern Brazil. Number of red raylets in Heliconius erato phyllis (a). Number of red basal spots on the hindwings in Heliconius melpomene nanna (b).

Seasonal changes in phenotype frequency
Phenotype frequency was not associated with season. The distribution of red raylets showed a small shift of the mode from five dots in the wet season to six dots in the dry season (Figure 3a), but this was not strong enough to be significant (G = 10.2, df = 7, P = 0.18). The relative frequency of red basal spots in H. melpomene was similar in the two seasons as well (G = 3.8, df = 3, P = 0.29; Figure 3b). Not surprisingly, the invariant nature of the red basal spot in H. erato was not associated with season (G = 6.2, df = 4, P = 0.14).
Our re-analysis of previous published studies on H. erato seasonality was mixed. We were able to confirm seasonality in Pansera & Araujo (Reference PANSERA and ARAUJO1983) data (G = 19.0, df = 6, P = 0.004). In the data from Ramos & Freitas (Reference RAMOS and FREITAS1999) phenotype frequency was not significantly associated with seasonality (G = 10.9, df = 6, P = 0.09).
Wing size
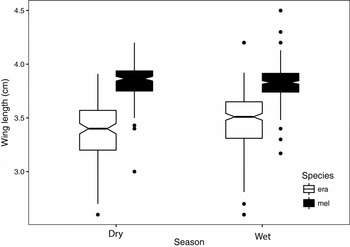
Wing length was different between the two species because H. melpomene (3.83 ± 0.26 cm, mean ± SD, N = 513) tends to be larger than H. erato (3.44 ± 0.16, N = 432) (two-way ANOVA, F1, 941 = 829, P « 0.0001). Season affected wing length (two-way ANOVA, F1,941 = 4.91, P = 0.03) but it was species-specific (two-way ANOVA, F(interaction)1,941 = 13.7, P = 0.0002). Nevertheless, the change was so small that the statistical result probably does not reflect a relevant biological fact (Figure 4). Wing length was not related to number of red raylets in H. erato (GLM, β = 0.12, df = 431, P = 0.14).
Wing length of Heliconius erato phyllis (era) and Heliconius melpomene nanna (mel) as function of season (dry and wet). The notch at the box plot represents the median value of the distribution, while the edges of the box represent the 1st and 3rd quartiles. Lines above and below the box show the interval containing ± 1.5.IQR (inter-quartile range). Dots represent outliers. Data compiled from a 3-y sampling on an Atlantic forest remnant in north-eastern Brazil.

Pollen loads
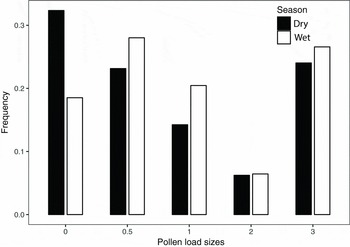
We first tested the association between load size, species and season. We observed a slight increase in the number of butterflies with larger pollen loads in the wet season and a large increase of individuals without pollen loads in the dry season (Figure 5). Consequently, there was a significant association between pollen load and season (likelihood ratio χ2 = 30.0, df = 9, P = 0.0004), but no association between species and pollen load (likelihood ratio χ2 = 10.3, df = 9, P = 0.32) or species and season (likelihood ratio χ2 = 6.01, df = 5, P = 0.30).
The distribution of pollen load sizes observed on the proboscis of adult Heliconius erato and Heliconius melpomene over a 3-y study in an Atlantic forest remnant in north-eastern Brazil. The data are pooled for both species. Different bar colours represent the dry and wet seasons. Zero values indicate individuals with no visible pollen on the proboscis, while 0.5 represent trace amounts. The remaining categories represent a rank order of increasing pollen load size.

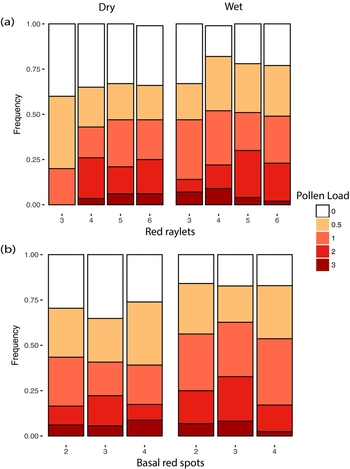
We then evaluated whether individual phenotypes were associated with pollen loads. This analysis focused on the trait itself and not on species comparisons. Our first analysis was of red raylets. Because there were few individuals at the extreme values of trait distribution, we excluded those with one, two and eight dots (N = 10). The data indicate that different phenotypes seemed to be similar in their pollen load distribution in both seasons (Figure 6a). Individuals at the lower end (three dots) seemed to be most affected by seasonality, because none was found with loads larger than 1 in the dry season. The log-likelihood model did not detect an association between pollen load and phenotypes (likelihood ratio χ2 = 24.8, df = 19, P = 0.17). In fact, the model did not find any association between the factors (likelihood ratio for the full independence model χ2 = 34.7, df = 31, P = 0.29). To analyse H. melpomene data, we also excluded individuals with five dots (N = 1) from the test. There was no significant association between phenotype and pollen load (likelihood ratio χ2 = 30.4, df = 22, P = 0.11), and no significant association between load and season (likelihood ratio χ2 = 30.4, df = 22, P = 0.06). Overall, removing all two-way associations did not significantly affect the model (likelihood ratio χ2 = 30.0, df = 22, P = 0.12). Consequently, we also concluded that there is no association between phenotype and pollen load in Heliconius melpomene (Figure 6b).
The distribution of pollen load sizes as a function of phenotype scores in Heliconius during the dry and wet seasons. Pollen loads with zero indicate individuals with no visible pollen on the proboscis, while 0.5 represent trace amounts. The remaining categories represent a rank order of increasing pollen load size. Data are from a 3-y study in an Atlantic forest remnant in north-eastern Brazil. Heliconius erato phyllis (red raylets) (a). Heliconius melpomene nanna (red basal spots) (b).

DISCUSSION
Our results, coupled with the reanalysis of previously published data on wing polymorphism in H. erato phyllis cast doubt on the phenomenon of seasonal polymorphism. In our data, we did not find evidence for seasonal effects on wing polymorphism in H. erato phyllis or H. melpomene nanna. The reanalysis of previously published data had mixed results. The southernmost populations studied by Pansera & Araujo (Reference PANSERA and ARAUJO1983) are located at the southern limit of the distribution (Brown Reference BROWN1979), in places where subtropical climate merges with more temperate climates of Argentina and Uruguay where cold winters in which frosts are not uncommon. Pansera & Araujo (Reference PANSERA and ARAUJO1983) tentatively suggested that cold weather caused reduction in population size in sites nearby and a bottleneck effect. On the other hand, the populations studied by Ramos & Freitas (Reference RAMOS and FREITAS1999) do not experience such drastic changes, and our reanalysis did not support an association between phenotype frequency and season in their data. In our study site, butterflies do experience seasonal fluctuations between a mild rainy season and a dry hot season that leads to reduced butterfly abundance. Nevertheless, such fluctuations are not enough to induce local extinction and females are seen laying eggs even in the driest months (M.Z. Cardoso, unpubl. obs.).
We found no evidence to support the hypothesis that polymorphisms of red raylets in H. erato and red dots in H. melpomene are tied to the life history (wing) or ecological traits (pollen load) we examined. This is in contrast to a well-known correlation between polymorphism in beak morphology in the bird species Pyrenestes ostrinus (Clabaut et al. Reference CLABAUT, HERREL, SANGER, SMITH and ABZHANOV2009, Smith Reference SMITH1993), where phenotypes differ in foraging ecology. We did observe that pollen loads changed with the seasons, notably in the increase in number of individuals with no pollen loads during the dry months, confirming that seasonality affects the foraging ecology of the butterflies. Nevertheless, this is independent of phenotypes or species.
While the genetic nature of the bird foraging polymorphism has been shown to be due to a single allele with Mendelian inheritance (Smith Reference SMITH1993), the genetic nature of the red colour characters in H. erato phyllis and H. melponene nanna has not been thoroughly explored. Genetic control for subtle changes in discrete characters have been reported for spot variation in Drosophila mediopunctata, which is controlled by a chromosomal inversion (Hatadani et al. Reference HATADANI, BAPTISTA, SOUZA and KLACZKO2004). The study by Sheppard et al. (Reference SHEPPARD, TURNER, BROWN, BENSON and SINGER1985) suggest that red raylets in H. erato phyllis are controlled by a single gene, but Pansera & Araujo (Reference PANSERA and ARAUJO1983) could not confirm this. In addition, Pansera & Araujo (Reference PANSERA and ARAUJO1983) estimated red raylet heritability to be 0.7, suggesting that these traits are not plastic and that variation among individuals can have adaptive explanations besides just natural variation. There is no information on the genetics of the red dots in H. melpomene nanna. Our novel result of polymorphism on Heliconius melpomene nanna calls for a more in-depth look at the genetic basis of variation and inheritance of these traits as well.
A potential explanation for subtle variation in wing pattern elements in our study system could be mate choice and avoidance of mate interference. Subtle signals have been shown to be important in mate recognition in a lycaenid butterfly (Fordyce et al. Reference FORDYCE, NICE, FORISTER and SHAPIRO2002), and Oliver et al. (Reference OLIVER, ROBERTSON and MONTEIRO2009) provide evidence for signal partitioning, whereby butterflies may use different regions of a wing for distinct purposes, such as predator avoidance and mate communication. Consequently, the non-overlap between red dot frequency in the comimetic pair and the compartmentalized nature of red colour elements on H. erato phyllis wing could be viewed as signals responding to mates and mutual interference between mimics. This would explain both the non-overlap between shared signals (basal red dots), and a flexible expression of the non-shared signal (red raylets). Although subtle in nature, such signals could be used at close contact between mates, a hypothesis that we are currently investigating (A. Silva & M. Cardoso, unpubl. data).
There is evidence that comimics interfere with each other while searching for prospective mates (Estrada & Jiggins Reference ESTRADA and JIGGINS2008), and populations of H. erato in Central-North America that are sympatric with H. melpomene are different in wing pattern elements (width of yellow bar) than populations that do not coexist with H. melpomene (Gilbert Reference GILBERT, Futuyma and Slatkin1983, Hill et al. Reference HILL, GILBERT and KRONFORST2013). One interesting aspect of our study site is that H. melpomene is more common than H. erato and we observed this in other forest patches near our study site, suggesting a wider phenomenon (Moura et al. Reference MOURA, QUEK, CARDOSO and KRONFORST2011). This opens the intriguing possibility of an inverted coevolutionary dynamic and a good candidate for a coevolutionary hotspot (Cuthill & Charleston Reference CUTHILL and CHARLESTON2015, Thompson Reference THOMPSON1997) in the ongoing coevolution between the Müllerian co-mimics (Flanagan et al. Reference FLANAGAN, TOBLER, DAVISON, PYBUS, KAPAN, PLANAS, LINARES, HECKEL and MCMILLAN2004).
ACKNOWLEDGEMENTS
We thank the State Agency for Agricultural Research for permission to work in the Jiqui Woods. We thank Cristiane Engelmann for conducting a pilot study, and José Elieudo Barbosa, Vicente Maciel and Daniel Oliveira for field assistance. We would like to thank the reviewers for improving the manuscript. We also thank CAPES (Ministry of Education, Brazil) for a graduate fellowship for LLFL, and CNPq for a productivity grant to MZC.