1. Introduction
Wave and oscillatory phenomena are omnipresent throughout the entire solar atmosphere. They are the subject of theoretical and observational studies related to the unsolved problem of heating the solar corona and the acceleration of the solar wind. The oscillations are interpreted in terms of magnetohydrodynamic (MHD) waves.
There exist many modes of oscillations, where transverse (kink) oscillations are one of the most studied wave phenomena in the solar atmosphere (Aschwanden Reference Aschwanden2005; Priest Reference Priest2014; Nakariakov et al. Reference Nakariakov, Anfinogentov and Antolin2021). They have been observed in coronal loops, solar prominences, or flux ropes, which are often defined as clusters of magnetic field lines twisting around a common axis.
Nakariakov et al. (Reference Nakariakov, Aschwanden and Van Doorsselaere2009) present a model suggesting that a possible mechanism for the excitation of kink oscillations is coronal mass ejections (CME) causing the vortex shedding phenomenon. This phenomenon, which is well known and described in hydrodynamic conditions, consists of a periodic alternate formation of vortices from each of the two sides of a blunt flow obstacle, which can form a structured chain of vortices called the Kármán vortex street. The frequency of the process depends on the obstacle size and fluid velocity according to the Strouhal number (Strouhal Reference Strouhal1878). In the model mentioned above, the blunt obstacle is represented by the upper horizontal section of a magnetic structure surrounded by vertical flow originating from a CME. The numerical study in Jelínek et al. (Reference Jelínek, Belov and Karlický2022) suggests that vortex shedding might excite kink oscillations in prominence threads.
2. Model and method
This study follows from our study presented in Jelínek et al. (Reference Jelínek, Belov and Karlický2022). This included a parametric study of vortex shedding around a single motionless cylinder with five different initial magnetic field values and a study of the oscillations of a single flexible cylinder excited by vortex shedding. For the calculations, we use the <monospace>LARE3D</monospace> code, which is a well-tested, parallel, and open science simulation code. <monospace>LARE3D</monospace> is a Lagrangian-Eulerian remap numerical code that implements a staggered grid and is second-order accurate in space and time (Arber et al. Reference Arber, Longbottom, Gerrard and Milne2001). The code uses the Lagrangian-remap method, splitting each time step into a Lagrangian step followed by a remap step, which does not involve adapting the grid resolution. When the medium is deformed, the grid evolves according to the fluid flow that caused this deformation. After that, the grid is remapped to its original state by Van Leer gradient limiters, which, apart from the interpolation inaccuracies, do not affect the fluid variables and only transfer them to the cells of the remapped grid – see, e.g., Griffies et al. (Reference Griffies, Adcroft and Hallberg2020).
2.1. Governing Equations
In our numerical model, the plasma dynamics is described by the 3D, time-dependent ideal MHD equations in the Cartesian coordinate system, which can be written in the following form – e.g. Arber et al. (Reference Arber, Longbottom, Gerrard and Milne2001):
 \begin{equation} \frac{\operatorname{D}\rho}{\operatorname{D}t}=-\rho\nabla\cdot\textbf{v},\end{equation}
 \begin{equation} \rho\frac{\operatorname{D}\textbf{v}}{\operatorname{D}t}=-\nabla p + \textbf{j} \times \textbf{B},\end{equation}
 \begin{equation} \frac{\operatorname{D}\textbf{B}}{\operatorname{D}t}=(\textbf{B}\cdot\nabla)\textbf{v},\end{equation}
 \begin{equation} \frac{\operatorname{D}e}{\operatorname{D}t}=-\frac{p}{\rho}\nabla\cdot\textbf{v},\end{equation}
 \begin{equation} \nabla\cdot\textbf{B}=0,\end{equation}
where all the terms have their usual meanings. As follows from Eq. 2, gravitational acceleration is not considered in the model. Also, fully ionized plasma was considered (and therefore the adiabatic coefficient was set as
 $\gamma=\frac{5}{3}$
) with an average mass of ions
 $1.2 m_\textrm{p}$
, typical for the solar corona.
2.2. Initial State
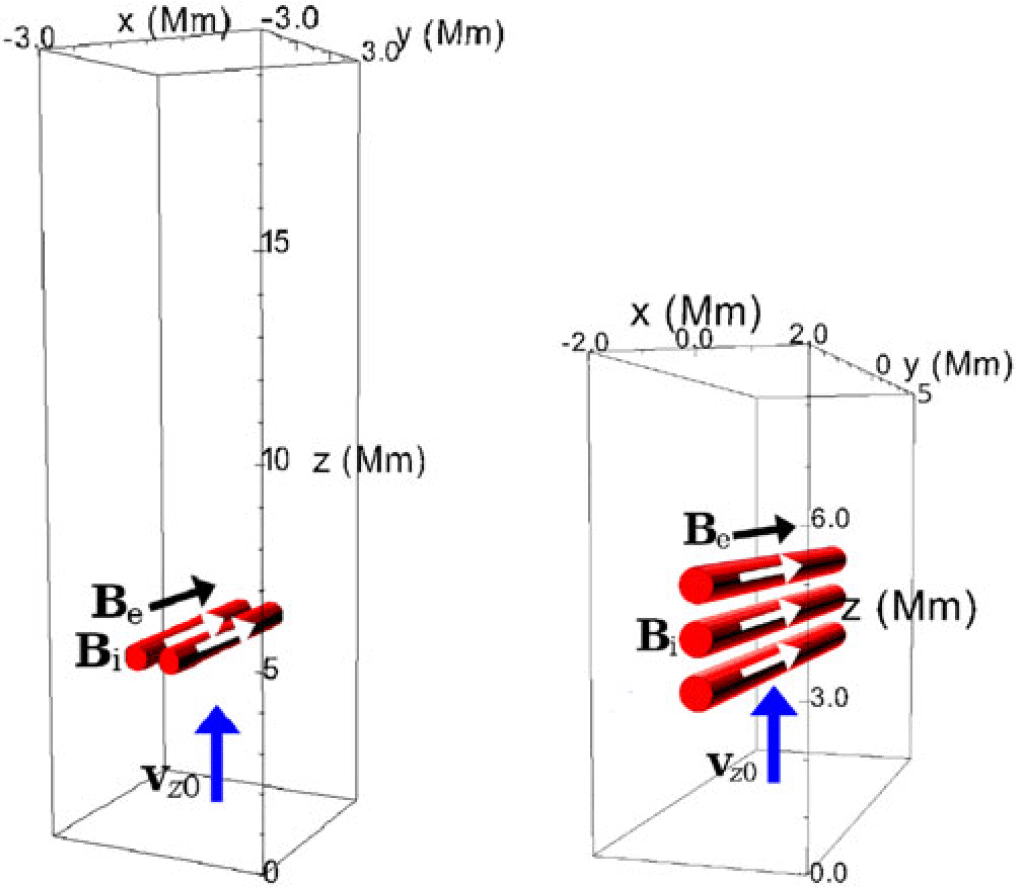
Figure 1 illustrates the simulation boxes in the initial state of each of the two studied cases (the one used for case #1 was covered by
 $360\times360\times1200$
grid points, i.e. its spatial resolution was 0.0167 Mm approximately; the one used for case #2 was covered by
 $444\times1110\times999$
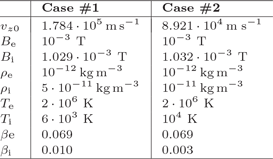
grid points, i.e. its spatial resolution was 0.009 Mm approximately). The parameters set in the initial conditions of each simulation are summarized in Tab. 1. All initial parameters are set in accordance with the equilibrium condition.
The sketches of the numerical boxes (not to scale) for cases #1 (left) and #2 (right) including their sizes. The red cylinders represent the obstacles. The initial flow is denoted as
 $\textbf{v}_{z0}$
.

Figure 1 Long description
Panel A: A 3D diagram of a numerical box with dimensions labeled in megameters (Mm) on the x, y, and z axes. The box contains a red cylinder representing an obstacle. Arrows labeled B_e, B_i, and v_z0 indicate magnetic fields and initial flow direction. Panel B: Another 3D diagram of a numerical box with different dimensions labeled in megameters (Mm) on the x, y, and z axes. This box contains multiple red cylinders representing obstacles. Arrows labeled B_o, B_i, and v_z0 indicate magnetic fields and initial flow direction.
Initial parameters of the studied cases.

Table 1 Long description
A table comparing initial parameters of two studied cases. The table has two columns labeled Case #1 and Case #2, and eight rows with different parameters. Row 1: v_0, 1.784 times 10^5 meters per second, 8.921 times 10^4 meters per second. Row 2: B_e, 10^-3 tesla, 10^-3 tesla. Row 3: B_i, 1.029 times 10^-3 tesla, 1.032 times 10^-3 tesla. Row 4: ρ_e, 5 times 10^-12 kilograms per cubic meter, 10^-12 kilograms per cubic meter. Row 5: ρ_i, 5 times 10^-11 kilograms per cubic meter, 10^-11 kilograms per cubic meter. Row 6: T_e, 2 times 10^5 kelvin, 10^4 kelvin. Row 7: T_i, 6 times 10^3 kelvin, 10^4 kelvin. Row 8: β_e, 0.069, 0.069. Row 9: β_i, 0.010, 0.003.
We consider two model cases: #1 – with two flexible cylindrical obstacles located next to each other with a radius square
 $r^2 = 0.1\;\textrm{Mm}^2$
, fixed at the boundaries, with only the y component of the magnetic field applied, with the centres 2r, 3r and 6r apart; and #2 – with the same configuration, except there are three obstacles located above each other with the centres 3r apart. There is a flow coming from the lower face of the box constantly throughout the simulations.
3. Numerical Results
3.1. Flow and oscillations
Figures 2 to 3 show the distribution of the mass density in the plane
 $y = 0$
of cases #1 and #2. The panels are shown for different time steps.
Mass density distribution in case #1 at configurations 2r, 3r and 6r respectively at different time steps indicated above. In each case, vortex shedding is taking place - see movies at QR codes. 2r: Kármán vortex street is captured; 3r: two halves of Kármán vortex streets are captured; 6r: two opposite Kármán vortex streets are captured.

Figure 2 Long description
Panel A: A heat map showing mass density distribution at t = 747.04 s. The x-axis ranges from -2 to 2 Mm and the z-axis ranges from 4 to 18 Mm. The color scale indicates the log of mass density in kg/m^3, with values ranging from -12 to -10.4. The heat map shows a concentration of higher density at the bottom center. Panel B: A heat map showing mass density distribution at t = 174.72 s. The x-axis ranges from -2 to 2 Mm and the z-axis ranges from 4 to 18 Mm. The color scale indicates the log of mass density in kg/m^3, with values ranging from -12 to -10.4. The heat map shows two symmetrical regions of higher density near the bottom center. Panel C: A heat map showing mass density distribution at t = 216.16 s. The x-axis ranges from -2 to 2 Mm and the z-axis ranges from 4 to 18 Mm. The color scale indicates the log of mass density in kg/m^3, with values ranging from -12 to -10.4. The heat map shows two symmetrical regions of higher density near the bottom center, with vortex shedding patterns visible.
In case #1, all three simulations show initial decaying oscillations in the xz plane and deformations before stabilizing (see movies linked via QR codes). In the 2r configuration (cylinders in contact), vortex shedding appears later (
 $t \approx 730$
s), leading to a single Kármán vortex street and kink mode oscillations. In the 3r configuration, vortex shedding occurs earlier but does not trigger oscillations; instead, two opposing Kármán vortex street halves form due to the destructive interference of the vortices in the centre. The 6r case also shows early vortex shedding, forming two Kármán vortex streets without triggering oscillations.
In case #2, clear vertical oscillations of magnetic structures are observed in the beginning. Also, a symmetric pair of vortices forms, but the symmetry does not break, and vortex shedding does not take place.
Mass density distribution in case #2 at different time steps indicated above.

3.2. Oscillation analysis
In Figs. 4–6, we approximately recorded the motion of the cylinders in the xz plane by locating the geometrical centre of the area identified as the cylinder’s transverse cross-section using the threshold method. In all #1 cases, the cylinders begin with decaying oscillations in the xz plane. The motions are slightly different but roughly symmetric within each pair. As shown in Fig. 5, z-direction oscillations are the strongest in case 3r; in the beginning, case 2r shows slightly more frequent z oscillations. Regarding the x motion (Fig. 4), the cylinder centres stabilize at a further x distance from each other compared to the initial distance; surprisingly, in the 3r configuration, the cylinders end up in the furthest position relative to the initial one; the 6r configuration leads to the most numerous oscillations in the x-direction. In case #2, a phase shift is observed between the middle and top cylinders, where the top one is ahead of the middle one (Fig. 6).
Left: evolution of absolute x-position; right: evolution of relative x displacement i.e. x displacement from initial positions, for two cylinders with the centres initially separated by 2r, 3r and 6r (case #1), period values calculated by wavelet analysis (Torrence & Compo Reference Torrence and Compo1998) are indicated.

Figure 4 Long description
Three line graphs show the evolution of z position over time for two cylinders with different initial separations. Panel 2r: The graph shows the z position in millimeters on the vertical axis and time in seconds on the horizontal axis. The blue line represents the left cylinder, and the red line represents the right cylinder. Period values calculated by wavelet analysis are indicated as 45.42 seconds and 57.10 seconds. Panel 3r: The graph shows the z position in millimeters on the vertical axis and time in seconds on the horizontal axis. The blue line represents the left cylinder, and the red line represents the right cylinder. Period values calculated by wavelet analysis are indicated as 48.68 seconds. Panel 6r: The graph shows the z position in millimeters on the vertical axis and time in seconds on the horizontal axis. The blue line represents the left cylinder, and the red line represents the right cylinder. Period values calculated by wavelet analysis are indicated as 46.70 seconds.
Evolution of absolute z-position for two cylinders with the centres initially separated by 2r, 3r and 6r (case #1), period values calculated by wavelet analysis (Torrence & Compo Reference Torrence and Compo1998).

Left: evolution of relative z displacement i.e. z displacement from initial positions; right: evolution of absolute x-position, for three cylinders with the centres initially separated by 3r (case #2), period values calculated by wavelet analysis (Torrence & Compo Reference Torrence and Compo1998).

4. Conclusions
Overall, initial oscillations in the xz plane occur in all configurations of the case of plasma flow around two magnetic structures located side by side. Initial z oscillations occur in the case of plasma flow around three magnetic structures located above each other. Vortex shedding can lead to kink mode oscillations, but it does not always trigger them. The spatial configuration influences the amplitude, frequency and duration of the resulting motions.
Acknowledgements
The work in this article is part of the project DynaSun. This project DynaSun has received funding under the Horizon Europe programme of the European Union under grant agreement (no. 101131534). Views and opinions expressed are, however those of the author(s) only and do not necessarily reflect those of the European Union and therefore, the European Union cannot be held responsible for them. This work was supported by the Ministry of Education, Youth and Sports of the Czech Republic through the e-INFRA CZ (ID:90254).
 vz0