Clinical testing detects only a fraction of carbapenem-resistant Enterobacteriaceae (CRE) carriers, an estimated 1 of every 9 carriersReference Pisney, Barron, Kassner, Havens and Madinger 1 – Reference Hayden, Lin and Lolans 3 ; therefore, it may underestimate true CRE burden. Because targeted interventions to prevent spread are applied only to known cases, the unseen part of the “iceberg” of CRE carriers can exacerbate pathogen spread through lack of applied contact precautions and other infection prevention strategies. We previously demonstrated that extensive patient sharing occurs among healthcare facilities in a region,Reference Lee, McGlone and Song 4 , Reference Lee, Song and Bartsch 5 which means that the extent of regional spread could be vastly underestimated. In other words, clinical testing reveals only the “tip of the iceberg,” and the entire iceberg could be much greater than anticipated. Here we estimate the size of the iceberg in a large US metropolitan area.
We used our previously described platform, the Regional Healthcare Ecosystem Analyst (RHEA),Reference Lee, McGlone and Wong 6 , Reference Lee, Wong and Bartsch 7 to generate an agent-based model of all adult inpatient facilities in Orange County, California (28 acute-care facilities, 74 nursing homes), the patients moving among them, and surrounding communities. We used this model to simulate the transmission and spread of CRE (previously described).Reference Slayton, Toth and Lee 8 , Reference Lee, Bartsch and Wong 9
On simulation day 0, we introduced CRE to reach observed target prevalence values of 10% in long-term acute-care facilities (LTACHs)Reference Singh, Jernigan and Slayton 10 and 3% in nursing homes in year 5, and current prevalence trends in hospitals (based upon epidemiologic surveys conducted in year 4 of emergenceReference Gohil, Singh and Gombosev 2 ). We assumed that CRE carriers had a 1.8-fold readmission risk within a year of dischargeReference Marquez and Terashita 11 and that 30% of carriers had persistent lifetime carriage,Reference O’Fallon, Gautam and D’Agata 12 , Reference Feldman, Adler and Molshatzki 13 whereas the remaining 70% experienced a spontaneous loss (ie, sigmoidal with 45% loss at 12 months,Reference Bart, Paul, Eluk, Geffen, Rabino and Hussein 14 so 70% of all carriers remained colonized at 1 year).
In each simulation run (50,000 trajectories), healthcare facilities detected only those CRE carriers incidentally identified from clinical cultures (1 in 9 carriersReference Pisney, Barron, Kassner, Havens and Madinger 1 – Reference Hayden, Lin and Lolans 3 ), regardless of having a clinical infection. In acute-care facilities, known carriers (ie, newly detected or historically known) were placed on contact precautions that reduced transmission by 40%, which accounted for both intervention efficacy and staff compliance based on existing studies.Reference Bearman, Marra and Sessler 15 – Reference Cromer, Hutsell and Latham 19 Because acute-care facilities often track CRE status, known carriers remained on contact precautions if readmitted to the same facility. We assumed that interfacility communication of a patient’s CRE status on direct transfer was 50%.Reference Kim, Segreti, Tomich, Tongma, Hayden and Lin 20 Nursing homes, which typically reserve contact precautions for overt infections, placed 10% of known carriers on contact precautions for 10 days. The number of daily CRE carriers on contact precautions represents each facility’s enacted response to the cumulative knowledge of obtained carrier status from cultures, maintained historical status, and interfacility communication. Thus, contact precautions were infrequently applied because only 1 in 9 carriers were detected or known, and this information was transferred in 50% of cases.
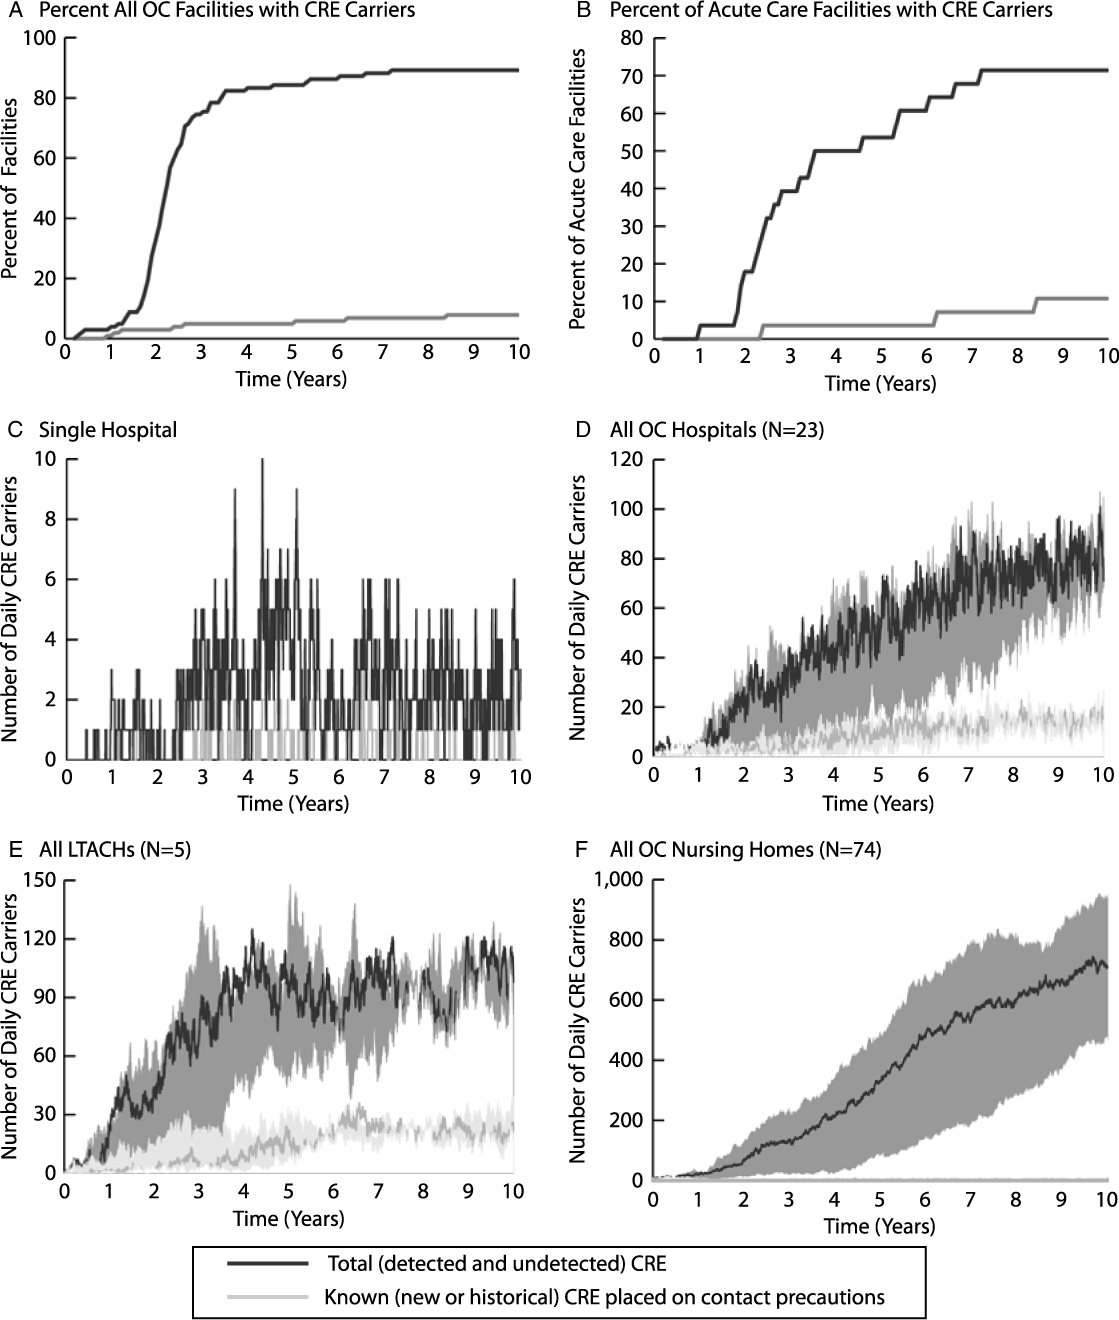
Figure 1A–B contrasts the percentage of facilities where ≥1 CRE carrier (detected and undetected) occurs with those that initiated contact precautions in response to ≥1 known carrier. The gap between these 2 groups begins around day 30 and grows significantly to year 4 when 85 facilities (83.3%) had cared for ≥1 CRE carrier yet only 5 facilities (4.9%) had placed any CRE carrier under contact precautions. Most facilities were unaware of CRE presence and spread for many years.
(A) Number of all Orange County (OC), California, healthcare facilities [102 total; 23 hospitals, 5 long-term acute-care hospitals (LTACHs), and 74 nursing homes] that have at least 1 known (new or historical) carbapenem-resistant Enterobacteriaceae (CRE) carrier under contact precautions compared to the number that have any CRE carriers (detected or undetected) over time. (B) Number of OC acute-care facilities (hospitals and LTACHs) that have at least 1 known CRE carrier on contact precautions compared to the number that have any CRE carriers (detected or undetected) over time. (C) Number of known CRE carriers on contact precautions and total CRE carriers on any given day in an example OC acute-care hospital. (D) Number of known CRE carriers and total CRE carriers each day in all OC hospitals over time (median and range of simulated trajectories). (E) Number of known CRE carriers and total CRE carriers each day in all OC LTACHs over time (median and range of simulated trajectories). (F) Number of known CRE carriers and total CRE carriers each day in all OC nursing homes over time (median and range of simulated trajectories). Note differences in scale across panels.

Figure 1C–F highlights the substantial gap in perceived versus actual carriers when solely relying on clinical cultures to signal the need for contact precautions. Figure 1C shows a single hospital’s daily CRE carriers. Figure 1D–F shows the number of carriers in hospitals, LTACHs, and nursing homes. The bands depict the range in the estimated number of daily carriers across simulations. On any day, there was a multifold underestimation of CRE carriers in facilities based on perceived burden from detected cases alone. In fact, even after 10 years, 70.4%–86.4% of daily CRE carriers in individual hospitals remained undetected. This gap was further magnified in nursing homes because few carriers are known and even fewer are placed under contact precautions for colonization despite recommendations. 21 On an average day, nursing homes had <1 CRE carrier on contact precautions (Fig. 1F).
The difference between total and known carriers represents the number of unknown carriers contributing to transmission. By year 5, clinical cultures identified ∼19 new carriers a month countywide, when 102 transmission events actually occurred per month. This increased to 30 detected carriers versus 159 actual transmissions per month by year 10. There is likely a difference in concern regarding CRE when a facility perceives 0–3 cases per day versus the full 5–15-fold burden. Countywide, 0.5%–11% of total carriers are known at any given point in time, while 89%–99.5% remain unknown. In the absence of effective facility-wide strategies for addressing unknown CRE, transmission will continue unabated. We quantified the rising daily difference between perceived spread based on clinical tests and actual spread. Not only are the number of cases substantially underestimated, but many facilities may be completely unaware that CRE carriers are present and actively transmitting. However, all models are simplifications and have limitations. Our model was tailored to one county’s healthcare facilities and their detailed patient-sharing data; therefore, these results may not be generalizable to other regions.
Knowing only the “tip of the iceberg” can significantly impair the ability to prevent and contain CRE spread. Extensive transmission is enhanced by complex patient sharing across healthcare facilities in a region.Reference Lee, McGlone and Song 4 , Reference Lee, Song and Bartsch 5 This phenomenon makes it particularly important for infection prevention and public health programs to respond to the entire iceberg and mitigate its growth over time.
Acknowledgments
Companies contributing products to the study had no role in design, conduct, analysis, or publication. The funders had no role in the design and conduct of the study; the collection, management, analysis, and interpretation of the data; or the preparation, review, or approval of the manuscript.
Financial support
This study was supported by the Agency for Healthcare Research and Quality (AHRQ grant no. R01HS023317), by the Centers for Disease Control and Prevention (CDC SHEPheRD Task Order 2015-05), by the Eunice Kennedy Shriver National Institute of Child Health and Human Development Office of Behavioral and Social Sciences Research (OBSSR NICHD grant no. U01HD086861) and by the Global Obesity Prevention Center (GOPC grant no. U54HD070725). Computing resources were provided by the University of Pittsburgh Center for Research Computing.
Conflicts of interest
G.M.G., J.A.M., L.G.M., and S.S.H. are conducting other clinical studies in which Orange County hospitals and nursing homes receive contributed products from Stryker (Sage), 3M, Xttrium, Clorox, and Medline. J.A.M. has received grants and personal fees from Achaogen, Allergang, Cempra, Expert Stewardship, Melinta, Menarini, Science 37, Theravance, and ThermoFisher Scientific for the conduct of other studies. All other authors report no conflicts of interest relevant to this article.