I. INTRODUCTION
Materials with high dielectric constants and low loss suitable for use over wide frequency and temperature ranges are desired for electronic applicationsReference Hippel, Breckenridge, Chesley and Tisza1 such as multilayered ceramic capacitors.Reference Sakabe2 Barium titanate (BaTiO3) is the most widely used ferroelectric material for this application.Reference Saito, Chazono, Kishi and Yamaoka3–Reference Sakabe, Hamaji, Sano and Wada7 However, its ferroelectric transition temperature (T c) is nearly 125 °C, and its dielectric constant rapidly decreases above 125 °C following the Curie–Weiss law. It was reported that only the PbTiO3–BaTiO3 solid solution increases the T c of BaTiO3 and improves its ferroelectric property.Reference Burns8 The Pb2+ ion has a 6p empty orbital, which mixes with the O2− 2p in PbTiO3 perovskites, leading to the formation of an asymmetric electric density at the top of the valence band.Reference Payne, Egdell, Walsh, Watson, Guo, Glans, Learmonth and Smith9 This asymmetrical Pb–O bond distorts the oxygen octahedron so that it induces a large ferroelectric property and high T c.Reference Kuroiwa, Aoyagi, Sawada, Harada, Nishibori, Takata and Sakata10
In recent years, some first-principles calculation studies have predicted that SnTiO3 would present excellent ferroelectric properties comparable to those of PbTiO3 (Refs. Reference Matar, Baraille and Subramanian11 and Reference Uratani, Shishidou and Oguchi12) because the electron configuration of Sn2+ is similar to that of Pb2+. Therefore, it is expected that the T c and ferroelectric property of BaTiO3 will be improved if the BaTiO3–SnO solid solution could be synthesized. However, no studies have yet reported an increase in the T c of a BaTiO3–SnO solid solution.Reference Xie, Yin, Hashimoto, Kimura and Sato13,Reference Lee, Randall, Kim and Kim14 It seems that the Sn2+ barely substitutes into the Ba sites because the Sn2+ ion has a smaller radius than the Ba ion.Reference Uratani, Shishidou and Oguchi12
In comparison, we have discovered that the T c of BaTiO3 can be increased by Sn and Ca co-doping.Reference Suzuki, Takeda, Ando and Takagi15–Reference Suzuki, Honda, Higai, Ando, Wada and Takagi17 It was also found that this T c increase was because of substituting Sn2+ into the Ba sites in the (Ba,Ca)TiO3.Reference Suzuki, Iwaji, Honda, Higai, Wada, Ando and Takagi18 Because Ca doping decreases the lattice size because of its ion radius being smaller than that of Ba, it was suggested that the decreased lattice size would be effective for substituting Sn2+ into the Ba sites. However, it was hard to distinguish whether the effects were due to a decreased lattice size or the Ca ion doping effects.
In this study, we have attempted to dope Sn2+ into the Ba sites using a high-pressure synthesis instead of the Ca co-doping at ambient pressure because the lattice size of BaTiO3 decreases effectively under high pressure.Reference Samara19 Moreover, the materials never evaporate, and the outside air never contacts the sample in this high-pressure synthesis. Thus, high-pressure synthesis has great advantages for not only preventing Sn evaporation but also for controlling the Sn valence, although the sample becomes too small (∼100 µm) to measure these electric properties. Therefore, it can be clarified fundamentally that the Sn2+ ions are substituted into the Ba sites of the shrinking BaTiO3 lattice using high-pressure synthesis.
First, the solution energies of substituted Sn2+ into the Ba and Ti sites in BaTiO3 were estimated using a first-principles calculation. Then, on the basis of the calculated results, the BaTiO3–SnO solid solutions have been synthesized at ∼20 GPa and ∼1500 K using a laser-heated diamond anvil cell (LH-DAC), which easily provides the range of high temperature and high pressure necessary for synthesizing compounds.Reference Hasegawa and Yagi20 After synthesis, samples were analyzed using x-ray diffraction (XRD), scanning transmission electron microscopy (STEM), energy-dispersive x-ray spectroscopy (EDS), and electron energy loss spectroscopy (EELS) to analyze the solubility and valence states of the Sn ions in the synthesized solid solutions and confirm the substitution of Sn2+ into the Ba sites.
II. METHODS
A. Calculations
First-principles calculations were carried out by the Vienna ab-initio simulation package (VASP),Reference Kresse21 which is based on density functional theory (DFT). Generalized gradient approximation (GGA)Reference Perdew, Burke and Ernzerhof22 including spin polarization was used to determine the exchange–correlation energy. A plane-wave basis set with a cutoff energy of 500 eV was used. Atomic potentials were calculated using the projector augmented wave (PAW)Reference Kresse23 method. A 3 × 3 × 3 supercell of cubic BaTiO3 with a perovskite structure was used. Moreover, a 2 × 2 × 2 k-point mesh was used in the reciprocal space. The local structural relaxation of the atomic positions around Sn2+ was allowed up to the second-nearest-neighbor atoms. In this study, we carefully compared the solution energies (E sol) of Sn2+ at the Ba sites (SnBa2+) and the Ti sites (SnTi2+) as a function of their pressure on each other. Further details about the calculation methods were presented in our previous papers.Reference Higai, Honda, Motoyoshi, Wada, Takagi and Sakabe24,Reference Honda, Higai, Motoyoshi, Wada and Takagi25
B. Experiments
The raw ceramic materials SnO and Ba0.96TiO2.96 were used as starting materials. Ba0.96TiO2.96 was selected in consideration that the reported solubility limit of TiO2 in BaTiO3 was ∼4 mol%.Reference Lee, Randall and Liu26 These were weighed and mixed to realize a composition of (Ba0.95Sn0.05)Ti0.99O2.98. The composition also considers that the maximum amount of Sn and the reported solubility limit of BaO in BaTiO3 was ∼1 mol%.Reference Lee, Randall and Liu26 Then, the mixed powders were ball milled and dried. A LH-DAC with 450-µm culet size diamond anvils was used for synthesis experiments under high pressure and temperature. A plate of the mixed powder was sandwiched between hexagonal boron nitride (h-BN) or KCl pellets. Then, the sample was loaded in the sample chamber along with ruby chips as pressure markers. The pressure was determined from the shift of the ruby fluorescence spectrum at room temperature.Reference Mao, Xu and Bell27 The sample was compressed to ∼20 GPa at room temperature, and then a fiber laser was used to irradiate the sample from one side through the diamond anvil. Although the synthesis temperature was not measured directly in this study, the sample temperature could be estimated at ∼1500 K because of the low thermal radiation from the heated spot. After laser heating for ∼5 min at∼20 GPa, the sample was quenched to room temperature by stopping the laser irradiation. The schematic illustrations of the DAC and laser system in this study are shown in Fig. 1.
Schematic illustrations of the diamond anvil cell and the laser heating system. (a) Sample chamber and diamond anvil cell and (b) full system of the LH-DAC for material synthesis under high pressure and temperature.

The crystalline phases of the recovered sample were analyzed and identified using the powder XRD technique. The composition of the recovered sample was analyzed by STEM (JEOL JEM-2200FS, JEOL Ltd., Tokyo, Japan) and EDS (JEOL JED-2300T, JEOL Ltd., Tokyo, Japan). The samples for the STEM measurements were fabricated using a focused ion beam lift-out method. The valence state of Sn in the recovered sample was determined by EELS (JEOL JEM-1000K RS equipped with a Gatan GIF Quantum equivalent) corresponding to the Sn L 2,3 edge. It was operated at room temperature with an accelerating voltage of 1000 kV.
III. RESULTS AND DISCUSSION
The pressure effects on the E sol of Sn2+ in the BaTiO3 are reported from DFT studies. Figure 2 shows the relationships among the pressure, the E sol of SnBa2+, and SnTi2+ in cubic BaTiO3 perovskites estimated from first-principles calculations. Note that the E sol of the SnBa2+ is larger than that of the SnTi2+ at ambient pressure. In Fig. 2, it is found that the E sol of the SnBa2+ decreases slightly initially with increasing pressure and then increases slightly, whereas that of the SnTi2+ increases monotonically. Consequently, the E sol of the SnBa2+ is smaller than that of the SnTi2+ under high pressures above ∼1 GPa, and it is smallest at ∼15 GPa. Furthermore, the E sol difference between the SnBa2+ and SnTi2+ becomes larger with increasing pressure. This means that the Sn2+ prefers the Ba sites to the Ti sites as a substitution site with increasing pressure. Based on these calculations, we tried to synthesize a BaTiO3–SnO solid solution at ∼20 GPa.
Relationship between pressure and solution energies of Sn2+ at the Ba (SnBa2+) and Ti sites (SnTi2+) in the cubic BaTiO3 estimated using first-principles calculations. The inset shows the relationship across the low-pressure region.
Figure 3 shows the photographs of the sample chamber at ∼20 GPa before and after laser heating. It is found that the sample diameters are about 100 µm. A large difference of the sample shape before and after laser heating was not observed, suggesting that the sample did not melt during laser heating.
Photographs of the sample chamber in the DAC at room temperature (a) before laser heating at ∼20 GPa and (b) after laser heating at ∼20 GPa.
The recovered sample after laser heating was characterized by XRD. Figure 4 shows the XRD patterns measured at ambient pressure before and after laser heating at ∼20 GPa. It was found that a SnO peak at ∼30°, which is clearly observed before the laser heating, disappeared after the laser heating, although distinguishable changes were not observed in the pattern of the BaTiO3 phase. In addition, it should be mentioned that no Sn or SnO2 peaks are detected in the XRD patterns after laser heating, and BaO or TiO2 peaks were also not detected. These results strongly suggest that the SnO reacts with BaTiO3, and additionally, the Sn ions are substituted into vacancy sites of the Ba0.96TiO2.96 under high pressure and temperature.
The XRD pattern of the BaTiO3–SnO sample before and after laser heating. The arrow indicates a main diffraction peak of SnO. Vertical lines indicate the (110), (111), and (200) peak positions of BaTiO3 before laser heating.
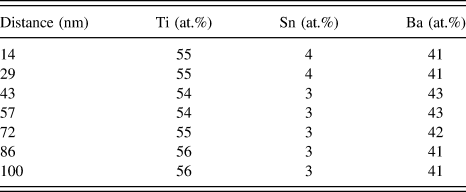
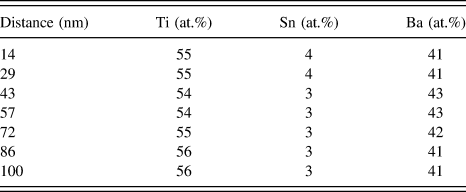
The microstructure of the synthesized sample was examined to confirm the reaction between the BaTiO3 and the SnO. Figure 5 shows the STEM image and the EDS distribution maps of Ba and Sn in the sample after laser heating at ∼20 GPa. It is found that the Sn is distributed almost uniformly in the sample. It should be noted that Sn is detected at the same positions as Ba in the EDS distribution maps. The quantitative EDS analyses indicated by the red arrow in Fig. 5(a) are summarized in Table I. Note that these data from the EDS analyses have an error of less than 5%. It is found that nearly identical amounts of Sn are detected at all points. Likewise, the Ba and Ti are also simultaneously detected at all points. In addition, the amount of Ti is shown to be greater than that of Ba, although this is not significant, taking in account the 5% error in the EDS spectra. As mentioned above, the XRD analysis indicates that the laser-heated sample comprises a single BaTiO3 phase. Accordingly, it is concluded that the SnO has reacted with the BaTiO3 and that the Sn is uniformly distributed in the BaTiO3 phase, indicating the formation of a solid solution of BaTiO3–SnO. Moreover, it is also suggested that the Sn ions are substituted into vacancy sites of the Ba0.96TiO2.96.
STEM-EDS analysis results of the BaTiO3–SnO sample after laser heating at ∼20 GPa. (a) STEM image. The red arrow indicates the EDS analysis line. (b and c) EDS distribution maps: (b) Ba, (c) Sn.
Compositions obtained from the EDS data at the position indicated by the red arrow in Fig. 5(a). Note that these data from the EDS analyses have an error of less than 5%.
Finally, the valence state of the Sn ions in the synthesized sample has been determined by its EEL spectra to identify the Sn substitution site in the BaTiO3. The Sn M edge is usually used to determine the Sn valenceReference Moreno, Egerton and Midgley28; however, it is difficult to determine the valence of the Sn in the BaTiO3 using the Sn M edge because its energy is close to that of the Ti L edge. Accordingly, we thus attempted to analyze the Sn L edge. The difference between the Sn L 3-edge energy of SnO and SnO2 has been previously reported in a study using x-ray absorption fine structure.Reference Liu, Handab, Kaibuchi, Tanaka and Kawai29 From this report, it is known that SnO shows a 5 eV chemical peak shift from SnO2. Figure 6 shows the EEL spectra corresponding to the Sn L edge of the BaTiO3–SnO solid solution sample after laser heating at ∼20 GPa. It is found that 4 peaks are observed at 3958, 4051, 4187, and 4477 eV around the L edge. The 3 peaks denoted with the letters L 1, L 2, and L 3 in Fig. 6 are assigned to the Sn L edge, according to the previous report.Reference Liu, Handab, Kaibuchi, Tanaka and Kawai29 Thus, it is found that the peak indicated with the arrow is unknown. Searching the literature for the unknown peak, we found that this peak is the Ca K-edge.Reference Neuville, Cormier, de Ligny, Roux, Flank and Lagarde30 Accordingly, we have compared a cross section of Ca EEL spectra with that of Sn to calculate the ratio of the Ca quantity against the Sn quantity. As a result, it was found that the amount of Ca is about 5% against that of Sn, i.e., (Ba0.95Sn0.05Ca0.0025)Ti0.99O2.98. A small amount of Ca hardly affects Sn substitution as shown from our previous report.Reference Suzuki, Takeda, Ando and Takagi15 Therefore, this estimation provides the conclusion that the Ca is an impurity and will not affect our results. Fortunately, the peak of the Ca K-edge becomes the reference of the Sn L-edge peak position. It was known that the peak position of the Ca K-edge is 4051 eV, determined from the previous report.Reference Neuville, Cormier, de Ligny, Roux, Flank and Lagarde30 The Ca K-edge position provides the Sn L 1, L 2, and L 3 edges at 3958, 4187, and 4477 eV, respectively. Hence, the Sn L 1-, L 2-, and L 3-edge positions indicate that the valence state of the Sn in the sample is 2+, i.e., Sn2+. If Sn were 4+, the Ca K-edge position would be 4056 eV, but this energy is unlikely for the Ca K-edge.
EEL spectra corresponding to the Sn L edge of the BaTiO3–SnO sample after laser heating at ∼20 GPa. Arrows indicate the L 3, L 2, and L 1 peak positions and unknown peak.
Sn2+ ions are too large to substitute into the Ti sites.Reference Matar, Baraille and Subramanian11 Accordingly, if all Sn2+ are substituted into Ti sites, the lattice constant of BaTiO3 would be increased. However, distinguishing changes are not observed in the pattern of the BaTiO3 phase before and after laser heating as shown in Fig. 4. Moreover, the TiO2 peak was not detected. It is evident that the Sn2+ is barely substituted into the Ti site and that instead the Sn2+ is substituted into the vacant Ba sites. Thus, the existence of Sn2+ allows us to conclude that almost all of the Sn2+ ions are substituted into the Ba sites of the BaTiO3 in the synthesized sample. This also indicates that the high-pressure synthesis, which decreases the BaTiO3 lattice, is effective for Sn substitution into the Ba site, as well as the reported Ca co-doping. Therefore, it is concluded that decreasing the lattice size of BaTiO3 is effective for substituting Sn into the Ba sites. Besides, this consideration is consistent with the calculation results mentioned above which indicate that the Sn prefers substituting into the Ba sites rather than the Ti sites under high pressure.
IV. CONCLUSIONS
Formation of BaTiO3–SnO solid solutions has been investigated by solution energy calculations, high-pressure synthesis, and Sn valence characterization. The first-principles calculations of the solution energy show that the Sn2+ ions are preferentially substituted into the Ba sites in BaTiO3 under high pressure rather than into the Ti sites. Then, on the basis of the calculated results, BaTiO3–SnO solid solutions have been synthesized under high pressure (∼20 GPa) and high temperature (∼1500 K) using the LH-DAC. The synthesized solid solutions have been characterized using XRD, STEM, and EDS. It is found from these methods that the synthesized solid solution is of a single phase with a uniform composition. In addition, it is also clarified from the Sn L 3-edge EEL spectra that the valences of the Sn ions in the solid solution are 2+. These results indicate that the Sn2+ ions are substituted into Ba sites, according to the ion size. Consequently, the Sn ions can be substituted into the Ba sites of the shrinking BaTiO3 lattice under high pressure, which is similar to the Ca and Sn cosubstitution into the Ba sites under ambient pressure reported previously.