INTRODUCTION
Molecular biomarkers, carbonates, and other geochemical proxies are useful for reconstructing paleoclimate from marine and lacustrine archives (Pancost and Boot Reference Pancost and Boot2004). For materials deposited within the last 50,000 years, radiocarbon (14C) dating provides one of the most robust methods for generating an age model for such paleoclimate reconstructions. However, the 14C content of multiple substrates in sedimentary archives may differ due to lags between production and incorporation in sediment or differences in 14C sources. These factors complicate the development of depositional age models for many types of sedimentary deposits, but can also, in the first two case, point to real and important differences in the time-integration of proxy signals from different substrates (Eglinton and Eglinton Reference Eglinton and Eglinton2008).
Almost as long as 14C measurements have been possible it has been recognized that dissolved inorganic carbon (DIC) in aquatic systems is commonly 14C-depleted relative to atmospheric CO2 (Deevey et al. Reference Deevey, Gross, Hutchinson and Kraybill1954; Broecker and Walton Reference Broecker and Walton1959), resulting in older apparent 14C ages for materials that derive some or all of their carbon from DIC (Figure 1; MacDonald et al. Reference MacDonald, Beukens, Kieser and Vitt1987; Cook et al. Reference Cook, Bonsall, Hedges, McSweeney, Boronean and Pettitt2001; Pearson et al. Reference Pearson, McNichol, Benitez-Nelson, Hayes and Eglinton2001; Caraco et al. Reference Caraco, Bauer, Cole, Petsch and Raymond2010; Olsen et al. Reference Olsen, Heinemeier, Lübke, Lüth and Terberger2010). Even in freshwater lakes where this “reservoir” or “hard water” effect is limited by C exchange with the atmosphere, aquatic materials may be somewhat depleted in 14C compared to their depositional age (Hajdas et al. Reference Hajdas, Zolitschka, Ivy-Ochs, Beer, Bonani, Leroy, Negendank, Ramrath and Suter1995; MacDonald et al. Reference MacDonald, Beukens, Kieser and Vitt1987). The reservoir age of a lake may vary both spatially, depending on how well mixed and how well ventilated the water is (Ascough et al. Reference Ascough, Cook, Hastie, Dunbar, Church, Einarsson, McGovern and Dugmore2011), and temporally, depending on inputs of 14C-dead carbonate from dissolved carbonates (Geyh et al. Reference Geyh, Schotterer and Grosjean1997).
Conceptual model for potential detrital and reservoir effects in the GSL system. Terrestrial substrates feature little to no reservoir age but may be significantly pre-aged at the time of deposition depending on their source(s) and pathways of storage and transport in route to the lake. Aquatic substrates may be variable affected by the lake’s reservoir age depending on how much of their C is sourced from DIC (e.g., Artemia may feed on both lake- and land-derived particulate organic carbon, POC). Both terrestrial and robust aquatic substrates (biomarkers, carbonates) may be affected by winnowing and redeposition within the lake.
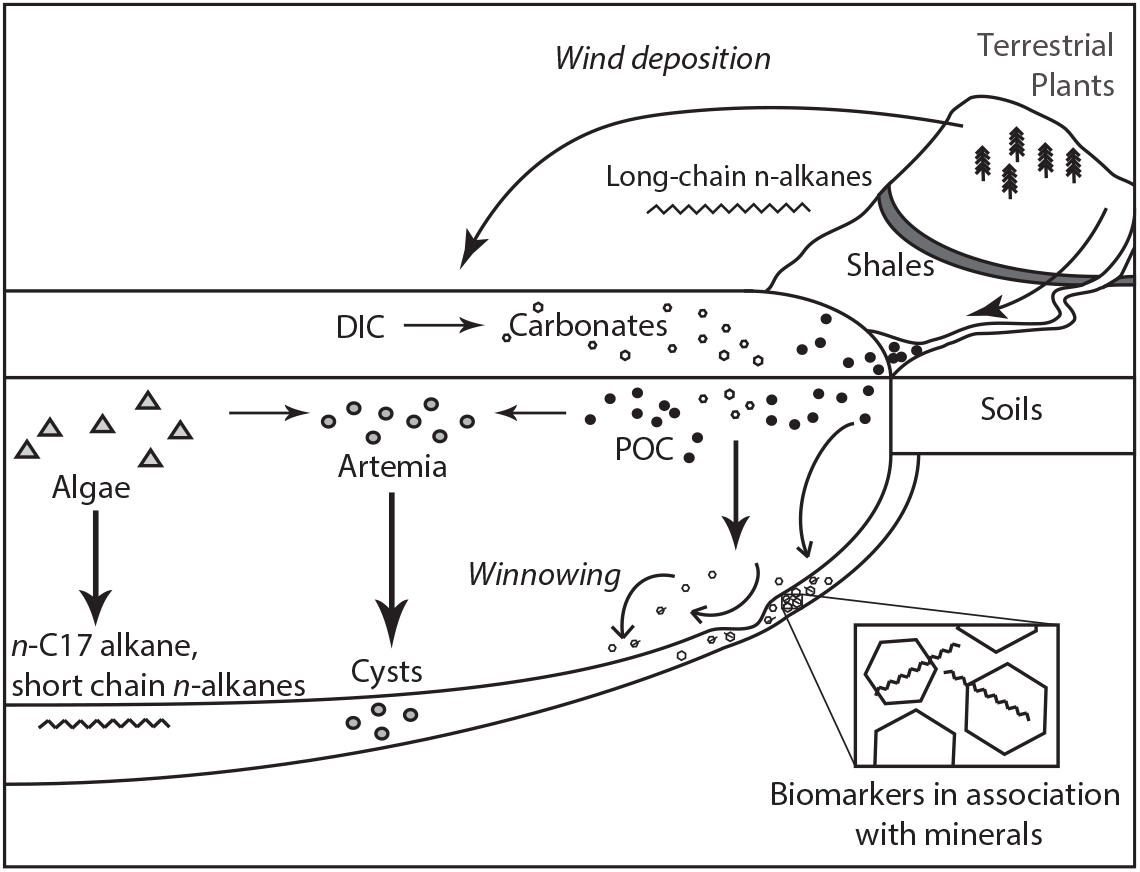
Detrital effects can lead to mixing of sedimentary materials with different levels of “pre-aging” (i.e. the amount of time between when C is fixed in a substrate and when it is deposited within sediments), producing older 14C ages for substrates that are physically and chemically robust enough to persist during long periods of storage and transport (Figure 1). Here we define detrital effects broadly to include lags introduced by residence in terrestrial environments (e.g., soils; Eglinton and Eglinton Reference Eglinton and Eglinton2008; Douglas et al. Reference Douglas, Pagani, Eglinton, Brenner, Hodell, Curtis, Ma and Breckenridge2014; Kusch et al. Reference Kusch, Rethemeyer, Schefuß and Mollenhauer2010b), long transit times within sedimentary transport systems or due to reworking and focusing of sediments (Ohkouchi et al. Reference Ohkouchi, Eglinton, Keigwin and Hayes2002; Mollenhauer et al. Reference Mollenhauer, Inthorn, Vogt, Zabel, Sinninghe and Eglinton2007; Kusch et al. Reference Kusch, Eglinton, Mix and Mollenhauer2010a; Mollenhauer et al. Reference Mollenhauer, McManus, Wagner, McCave and Eglinton2011), and contamination from eroding, carbon-dead geological materials (Eglinton et al. Reference Eglinton, Benitez, Pearson, McNichol, Bauer and Druffel1997; Blair et al. Reference Blair, Leithold, Ford, Peeler, Holmes and Perkey2003, Reference Blair, Leithold and Aller2004). These effects have attracted recent attention with respect to cycling and deposition of organic biomarkers, but also have potential affect some macrofossils and carbonate minerals. Detrital effects lead to attenuation and/or time-lags in paleoenvironmental proxy records, but the nature and magnitude of these effects depends on the detrital processes involved (Douglas et al. Reference Douglas, Pagani, Eglinton, Brenner, Hodell, Curtis, Ma and Breckenridge2014).
Multi-substrate 14C comparisons have been published for many depositional systems, but limited information is available for large terminal lake systems such as those common in the Pleistocene to Holocene record of the western USA. These systems preserve important evidence for environmental change during and following the Last Glacial Maximum, and growing interest in multi-substrate proxy reconstructions from them provides incentive to better understand the 14C systematics of the proxy materials they preserve (Thompson et al. Reference Thompson, Toolin, Forester and Spencer1990; Balch et al. Reference Balch, Cohen, Schnurrenberger, Haskell, Garces, Beck, Cheng and Edwards2005; Oviatt et al. Reference Oviatt, Madsen, Miller, Thompson and McGeehin2015). These lakes are situated within large drainage basins characterized by semi-arid climate and low primary productivity, where the balance of autochthonous and allochthonous inputs and nature of erosion and sedimentation may contrast with previously studied sites. As such, it is unclear whether results from existing multi-substrate studies provide a good model for the large lakes of the western interior.
The Great Salt Lake (GSL) is a terminal, saline lake located in the Great Basin, USA, and a remnant of Pleistocene Lake Bonneville (Hostetler et al. Reference Hostetler, Giorgi, Bates and Bartlein1994; Balch et al. Reference Balch, Cohen, Schnurrenberger, Haskell, Garces, Beck, Cheng and Edwards2005). Previous Late Pleistocene to Holocene paleoclimate work using GSL sediments has focused on interpretation of lithofacies and palynological data (Spencer et al. Reference Spencer, Baedecker and Eugster1984, Reference Spencer, Eugster and Jones1985a; Balch et al. Reference Balch, Cohen, Schnurrenberger, Haskell, Garces, Beck, Cheng and Edwards2005; Oviatt et al. Reference Oviatt, Madsen, Miller, Thompson and McGeehin2015) and on stable isotope measurements of lacustrine carbonates (McKenzie and Eberli Reference McKenzie and Eberli1985, Reference McKenzie, Eberli, Berger and Labeyrie1987). Organic matter preservation in GSL sediments is limited (Domagalski et al. Reference Domagalski, Orem and Eugster1989), but includes both macrofossils and quantifiable concentrations of molecular fossils (Collister and Schamel Reference Collister, Schamel and Gwynn2002).
Previous 14C studies of the GSL have produced conflicting interpretations of the significance of the lake’s reservoir effect and detrital processes. Waters of the modern GSL are stratified and carbonate rich (Spencer et al. Reference Spencer, Eugster, Jones and Rettig1985b), and measurements taken in the 1950s showed that GSL DIC was variably depleted in 14C relative to the atmosphere (Broecker and Walton Reference Broecker and Walton1959; Broecker and Kaufman Reference Broecker and Kaufman1965) as is common in many hard-water lakes. In contrast, recent data from the brine-shrimp Artemia have been used to suggest that the reservoir effect is insignificant in the modern GSL (Oviatt et al. Reference Oviatt, Madsen, Miller, Thompson and McGeehin2015). Dates from bulk organic matter in Holocene GSL sediments, however, have been reported to be ∼1800–2600 years older than independent stratigraphic markers identified in core (Spencer et al. Reference Spencer, Baedecker and Eugster1984; Oviatt et al. Reference Oviatt, Madsen, Miller, Thompson and McGeehin2015). This observation raises the question of whether a significant hard-water effect existed in the Holocene GSL, or whether the bulk organic matter measured in these studies was instead strongly affected by detrital processes. These two possibilities have contrasting implications for age models and interpretation of paleoclimate records from GSL sediments.
Here we present new multi-substrate 14C data for organic and mineral material obtained from Holocene sediments of the Great Salt Lake. These data provide a more comprehensive picture of 14C distributions among co-deposited substrates of interest for paleoclimate reconstruction than previously available for this or other Holocene lakes of the U.S. western interior. We compare data among substrates to assess potential reservoir and detrital influences on substrate-specific ages, propose models to explain the observations, and consider the implications of these findings with respect to paleoclimate proxy signals preserved in these materials.
MATERIALS AND METHODS
Core Description
The material studied here was collected in the year 2000 as part of the Global Lakes Drilling (GLAD) effort. Holocene sediments in GLAD core 1B were recovered and preserved in five sections, the top four of which are examined in this study. The cores are composed of fine-grained, gray sediment made of aragonite and clay with varying amounts of organic macrofossils. Most of the studied sediments are weakly laminated at cm to dm scale, with both planar and lens-shaped laminations suggesting relatively low-energy deposition with some shallow winnowing and reworking. Several horizons, particularly in core section 3, show 2–3-mm green laminae which contain large concentrations of green filamentous algae. Core section 5 was not studied because of the presence of large salt crystals that disturbed the sediments within the bottom half of the section. This salt-disturbed sapropel facies has been described previously at multiple locations in the GSL and associated with lake stratification during the earliest Holocene ( > 10.2 cal ka; Oviatt et al. Reference Oviatt, Madsen, Miller, Thompson and McGeehin2015). The stratigraphy of the site 1 cores is similar to that of the shallow core sections from GLAD site 4 studied by Balch et al. (Reference Balch, Cohen, Schnurrenberger, Haskell, Garces, Beck, Cheng and Edwards2005), but appears to be slightly expanded (with salt crystals first appearing at 8.2 m blf at site 4, versus ∼11.6 m blf at site 1; m blf = meters below lake floor).
Macrofossil Preparation
Materials for 14C determination were prepared from samples integrating approximately 1 cm depth and weighing approximately 5 g (wet weight). A single sample of modern Artemia cysts was collected from the water surface of the GSL in summer 2007 and prepared alongside the core samples. Organic macrofossils (cysts, algal mat biomass, and charcoal/terrestrial macrofossils) were isolated from sediment either by hand-picking using pre-combusted pipettes or by density separation using NaI with a density of 1.83 g/cc. With the exception of charcoal, all samples were picked and prepared by the authors during a ∼1.5-year period in 2007–2008; macroscopic charcoal fragments were picked and prepared approximately 4 years later by a student with limited experience in organic geochemistry and 14C analysis, leading to some concerns about potential contamination (see discussion). Organic substrates were subjected to a standard acid-base-acid treatment to remove carbonate and humic acids. Briefly, samples were placed in 1N HCl and heated to 60°C for 1 hr to remove carbonate and rinsed with 0.01 N HCl three times. A 0.5N NaOH solution was then added to all samples with the exception of algal biomass, which was dried after the first HCl rinse to avoid hydrolyzing the biomass. NaOH-treated samples were heated for 20 minutes at 60°C to remove humic acids and then rinsed three times with 0.01 N HCl. A final 1N acid treatment identical to the first was then performed to remove any carbonate that precipitated during the base treatment. Samples were rinsed with 0.01N hydrochloric acid three times and stored in the final rinse before drying and weighing, then submitted to the National Ocean Sciences Accelerator Mass Spectrometry Facility (NOSAMS) where they were combusted, graphitized, and analyzed for δ13C and 14C. During the 2007–2008 preparation period, two samples of FIRI A wood were treated using the organic sample pre-treatment procedure and submitted for analysis as process blanks.
Carbonate Preparation
Bulk sediment samples for carbonate 14C analysis were freeze-dried and ground by hand in a mortar and pestle. A 40–60-mg aliquot of each sample was weighed into a pre-combusted glass vial. Samples were hydrolyzed at NOSAMS and 14C and stable isotope determinations were made on the resulting CO2.
Molecular Biomarker Preparation
Six horizons were chosen for compound-specific 14C analysis (3.42–3.46, 3.46–3.505, 5.225– 5.26, 5.26–5.295, 7.485–7.535, and 7.535–7.575 m blf). The integration of material from a larger depth interval was necessary for these samples due to the much larger sample size requirements (∼30 g) for these versus the other substrates. Horizons were paired so that if insufficient material was recovered, fractions could be combined. Sediments were stored in pre-combusted glass vials and covered with combusted aluminum foil to prevent contamination from the plastic vial caps.
Sediments were freeze-dried overnight, weighed, and transferred to nitrogen-free polyester bags, which were then sealed. A total lipid extract (TLE) was obtained from each sediment sample by refluxing in a soxhlet extractor with 2:1 DCM:MeOH for approximately 24 hr. The TLE was saponified by adding a 0.5N KOH in methanol solution and heating overnight. Acid, neutral, and basic fractions were extracted from the saponified TLE by two-phase extraction with hexane at acid (pH = 1), neutral (pH = 7), and basic (pH = 14) pH, respectively. Fractions were dried down under N2 gas, and n-alkanes in the neutral fraction were further purified using silica gel chromatography (4 cm long, 0.5 cm diameter, 1% deactivated) with four eluents: hexane, 1:1 hexane:DCM, DCM, and MeOH. The hexane fraction (F1) was run on an HP 5890 GC to check for purity and for quantification.
n-Alkane homologues were separated and purified by preparatory gas chromatograph (PCGC; an HP 5890 GC joined to a Gerstel preparative fraction collector (Eglinton et al. Reference Eglinton, Aluwihare, Bauer, Druffel and McNichol1996)). Because at least 20 µg of C is required for 14C analysis, in most cases purified extracts were combined to obtain adequate material for analysis. Two approaches were used, combining material either from adjacent horizons (as in the case of the C17 n-alkane homologue, which was combined to produce a 5.225–5.295 m blf sample and a 7.485–7.575 m blf sample) or from several homologues within a single horizon. For all sediment samples except the 3.42–3.46-m blf interval it was necessary to combine all odd chain-length homologues from C19-33. For the 3.42–3.46-m blf sediment sample, the C19-23 homologues were combined, as were the C25-27 homologues, and the C29-33 homologues, allowing more detailed examination of the distribution of 14C ages with chain-length. Combined fractions were dried down in quartz tubes, copper was added, and quartz tubes were sealed under vacuum. Samples were combusted at 850°C and the resultant CO2 was separated from water in a vacuum distillation line and submitted to NOSAMS. A separate process blank was not run for the compound specific samples.
Data Analysis
Data analysis was conducted in the R programming environment (R Core Team 2018). Comparisons between cysts and all other substrates were made based on uncalibrated ages with reference to the cyst data, as discussed below. Evaluation of the reservoir age of paleo-lake water was made using the F14R and R metrics as defined in Soulet et al. (Reference Soulet, Skinner, Beaupré and Galy2016). For these calculations we used reported Fm values for substrates thought to represent un-aged terrestrial material (charcoal and a vascular plant seed) and compared these with estimated Fm values for cysts at the depths of those samples. Because concentrations of 14C follow an exponential decay with time, we estimated cyst Fm at the levels of the terrestrial samples using log-linear interpolation of measured values from adjacent cyst samples:
 $$F{m_y} = {e^{ln\left( {F{m_{y1}}} \right){w_1} + ln\left( {F{m_{y2}}} \right){w_2}}}$$
where y, y1, and y2 are the core depths of the target terrestrial sample and adjacent overlying and underlying cyst samples, respectively, and w is a weight proportional to the inverse of the core depth distance between the cyst and terrestrial samples. 14C dates were calibrated with the Intcal13 calibration curve (Reimer et al. Reference Reimer, Bard, Bayliss, Beck, Blackwell, Ramsey, Buck, Cheng, Edwards and Friedrich2013) using rbacon 2.3.3 (Blaauw and Christen Reference Blaauw and Christen2011). Depth-age models for reservoir-corrected brine shrimp cysts ages were developed in rbacon using 10 cm depth slices and default priors, with the exception of accumulation rate mean value (8 years/cm), mean accumulation rate memory (0.5), and accumulation rate memory strength (8).
RESULTS
Substrate Recovery
Recovery of cysts varied widely, from as few as four cysts per 5 g of wet sediment to approximately 0.8 mg cysts/g. Samples submitted for 14C determination ranged from 0.24 mg to 2.8 mg, with a median size of 0.66 mg cysts. Algal mat biomass was recovered non-quantitatively by hand picking, and samples ranged in mass from 2.43 mg to 8.48 mg wet weight. Charcoal was rare in all core intervals examined, and recoveries ranged from 0.134 mg to 0.22 mg of material. Recovery of n-alkanes was highest for the sample from a composite depth of 3.42 to 3.46 m, from which approximately 16,000 ng n-alkanes/g dry sediment was extracted. Recoveries for n-alkanes from the four lowest sampling horizons (below 5 m blf) were consistent and low, ranging from 4000 ng/g dry sediment to 5500 ng/g dry sediment. Recoveries from the PCGC separation ranged from 40% to 70% and were typically ∼50%.
14C Ages
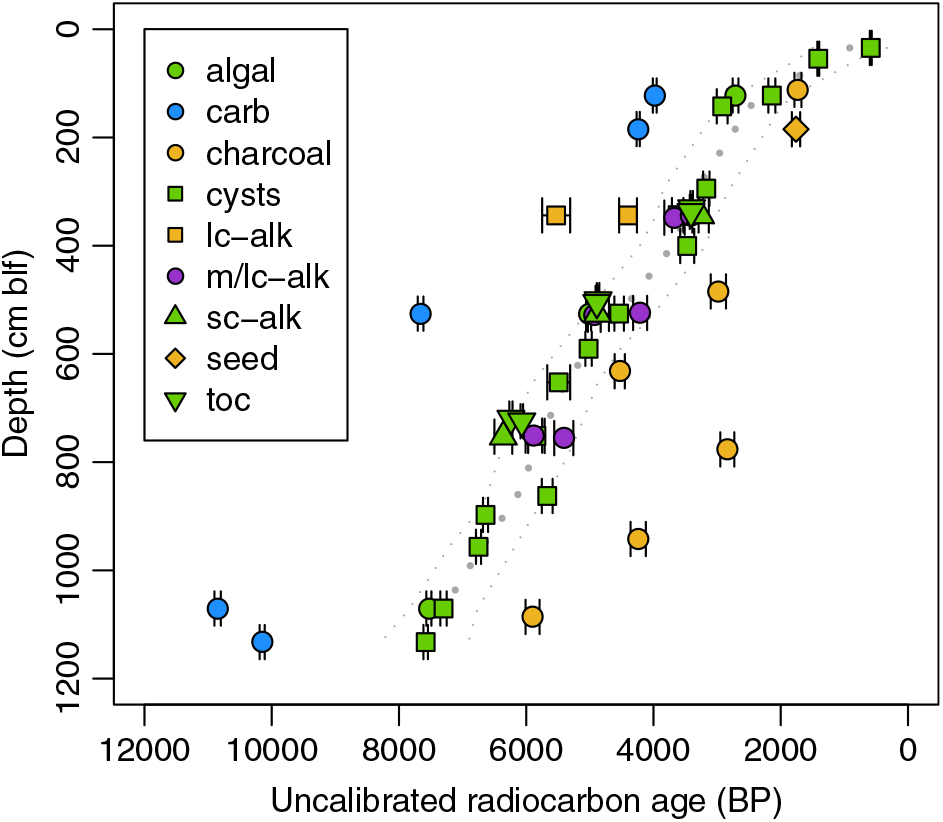
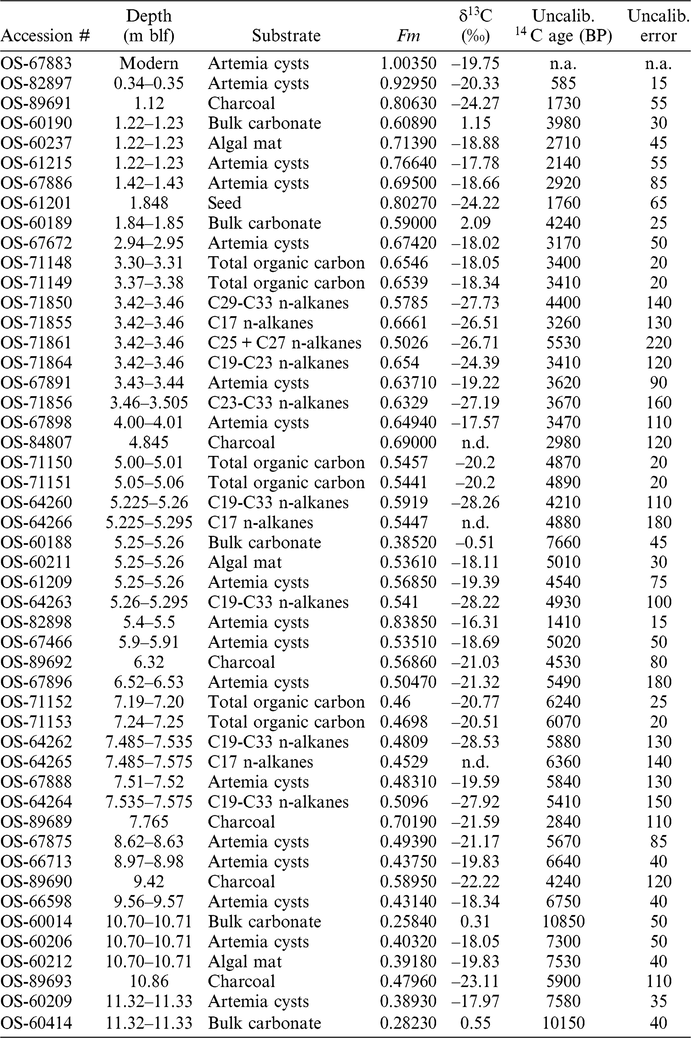
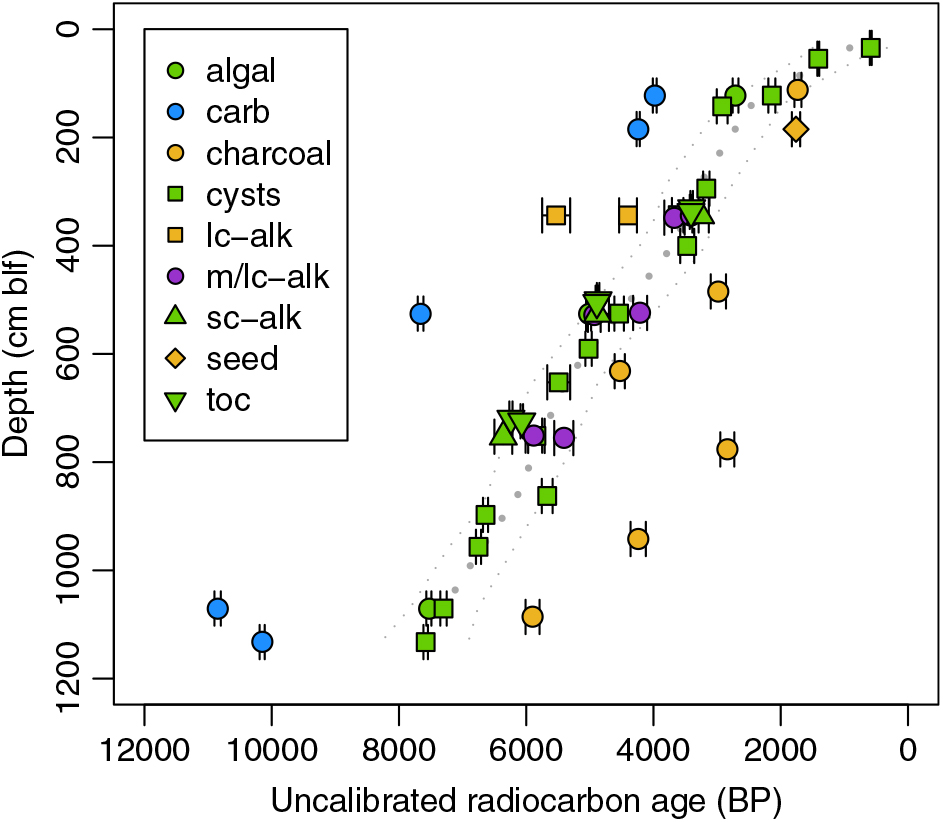
Process blanks for the organic carbon treatment yielded Fm values of 0.0031 and 0.0024, indicating that any contamination associated with sample preparation during the 2007–2008 work period was insignificant. Analytical precision for all substrates was high, with the average standard error of uncalibrated 14C ages ranging from a low of 0.6% for carbonates to a high of 3.1% for the smaller biomarker samples (Table 1). The modern cyst sample produced a post-bomb age. Ages for down-core substrates ranged from 585 BP, for brine shrimp cysts recovered at 0.34 m blf, to a maximum of 10,850 BP, for carbonates recovered at 10.7 m blf (Figure 2; Table 1).
Uncalibrated 14C ages for all subsurface samples and substrates measured. Colors correspond to inorganic (blue) and organic (green) materials of aquatic origin, material of predominately terrestrial origin (tan), and material of potential mixed aquatic and terrestrial origin (purple). Dotted gray lines show a smoothing spline fit to the cyst data (best fit ±95% confidence intervals). carb = carbonate, lc-alk = long-chain n-alkanes, m/lc-alk = combined mid- and/or long-chain n-alkane fractions, sc-alk = short-chain (C17) n-alkanes, toc = total organic carbon. (Please see electronic version for color figures.)
Sample information and isotopic data.

Substrate Comparisons
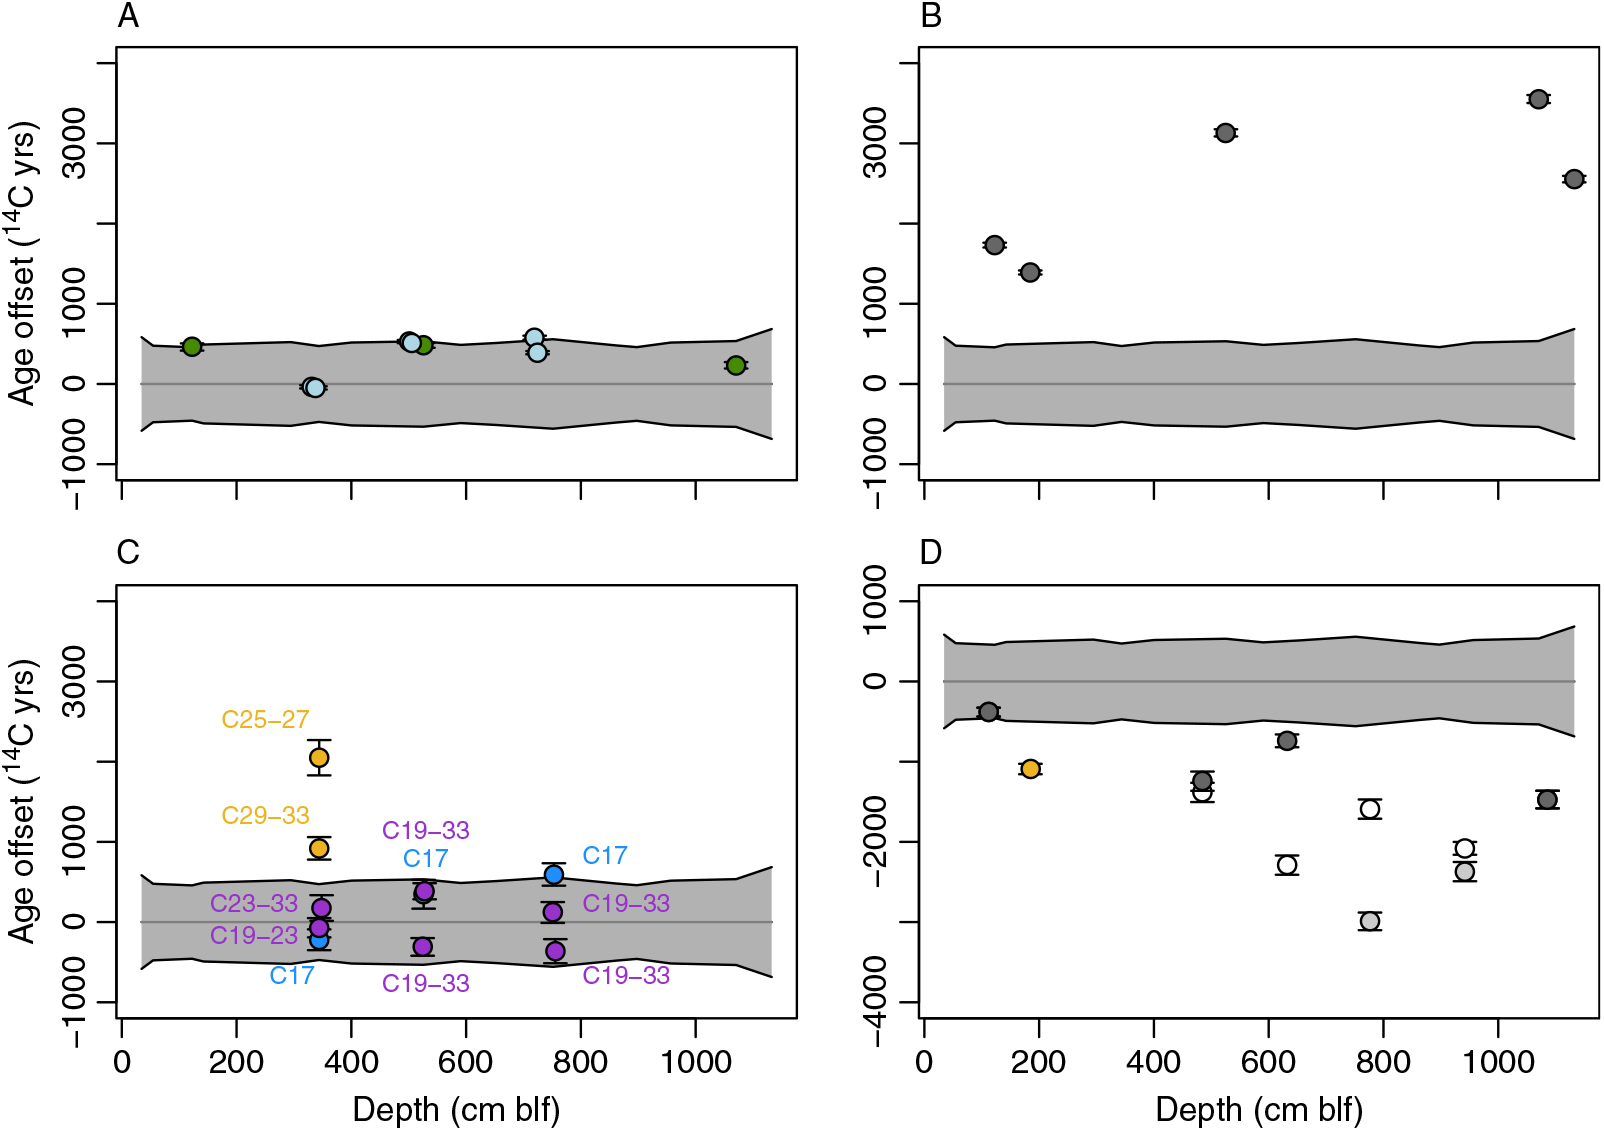
We used 14C dates for Artemia cysts as a baseline for comparisons among substrates. Cysts are identifiable authochthonous macrofossils and are fragile enough to degrade with prolonged environmental exposure (Gostling et al. Reference Gostling, Dong and Donoghue2009), and we suggest that detrital effects related to transport and reworking are unlikely to significantly affect cyst ages. In order to characterize between-substrate age offsets, we fit a smoothing spline to the uncalibrated cyst data (Figure 2; R function smooth.spline, smoothing parameters optimized using cross-validation) and compared data for non-cyst substrates to the spline-predicted values and associated prediction intervals at the sample’s depth (Figure 3).
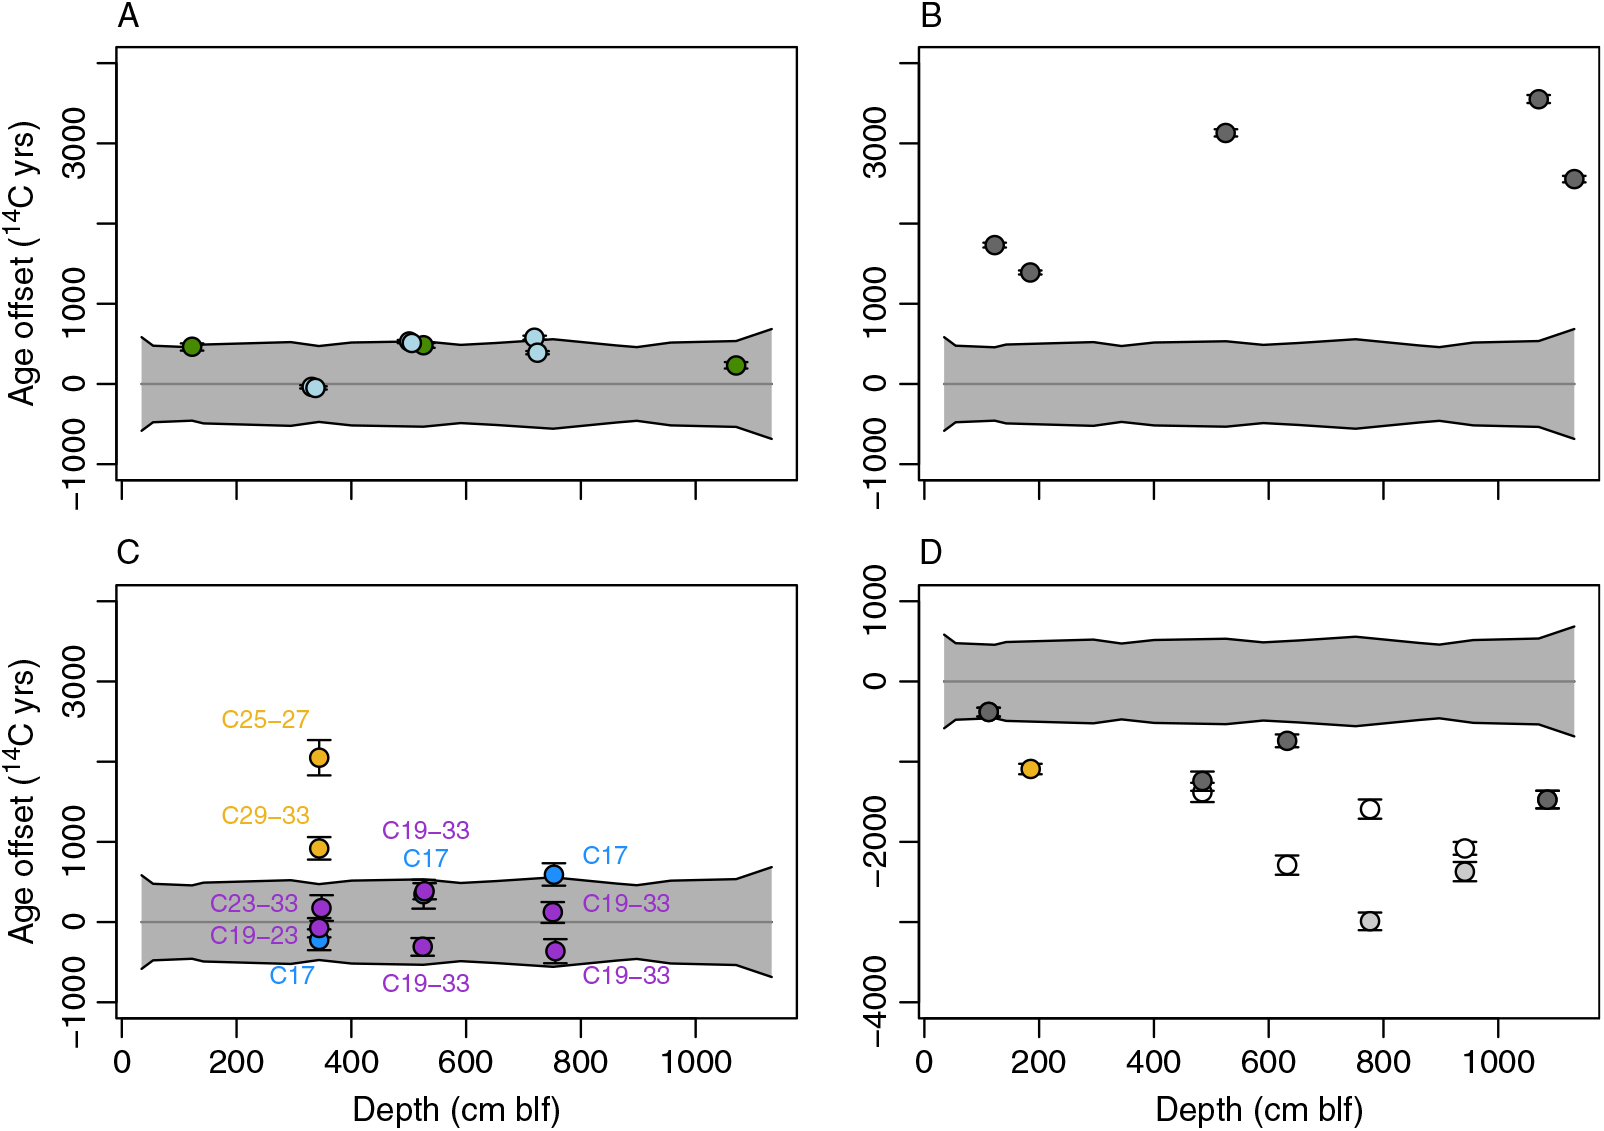
Uncalibrated 14C age offsets between cysts and all other substrates. Values in all panels are referenced to ages from a spline fit to all cyst data (gray line; 95% prediction interval in gray). Points show the measured 14C ages for other substrates, calculated as differences relative to the cyst median age, and 2σ errors. (A) Algal mats (green) and total organic carbon (blue). (B) Carbonate mineral. (C) N-alkane fractions, as labeled, dominated by aquatic (blue), terrestrial (tan), or potential mixed (purple) production. (D) Charcoal and land-plant seed (tan). Charcoal data show two alternative interpretations discussed in text: gray symbols show original data, with lighter gray points indicating samples suspected of contamination; white symbols show offsets based on proposed potential re-ordering of samples between 4 and 10 m blf.
Total and Algal Organic Carbon
TOC was measured at the six depth intervals from which molecular fossils were extracted. 14C ages of TOC were similar to or slightly older than those of brine shrimp cysts in all cases and overlapped with the uncertainty envelope of the cyst ages with one exception (7.19 m blf) (Figure 3A). Algal mats were measured at three depths, giving ages that were somewhat older than but overlapping with the cyst age distribution at all levels (Figure 3A). Dates for the algal mat carbon ranged from 480 14C years older than cysts for the highest sample to 230 14C years older for the lowest one.
Carbonates
Carbonates were measured at five depths, with one sample being obtained from core 1A (1.84 m blf, OS-60189). In all cases, carbonates were depleted in 14C relative to cysts, giving ages at least 1700 14C years older than cysts and most other organic substrates from the same levels (Figure 3B). Offsets generally increased down-core, with the largest offset of 3550 14C years at 10.7 m blf. The sample from core 1A gave results that were similar to and concordant with those from a sample collected at a slightly shallower depth in 1B (1.22 m blf).
Molecular Fossils
Molecular fossils were extracted and measured from six paired intervals. The n-alkanes were divided into short-chain (C17), mid-chain (C19-C23) and long-chain length (C25-C33) molecules. The C17 n-alkane is a major component of cyanobacterial cell walls (Blumer et al. Reference Blumer, Guillard and Chase1971). Vascular plants, including emergent aquatic vegetation and land plants, produce a broad range of mid- and long-chain compounds. For land plants this peaks at longer chain lengths, typically between C27 to C31, though the highest abundance homologue varies among species (Bush and McInerney Reference Bush and McInerney2013; Diefendorf et al. Reference Diefendorf, Freeman, Wing and Graham2011). The distribution of compounds observed here is similar to that reported for GSL surface sediments (Collister and Schamel Reference Collister, Schamel and Gwynn2002) and is bimodal with peaks in abundance at the C17 and C27-31 chain lengths (Figure 4). As a result, we assume the short-chain n-alkanes analyzed here were produced by predominantly by aquatic algae and the long-chain n-alkanes by vascular land plants. The origin of the mid-chain compounds is less certain but may include minor contributions from land plants and aquatic vegetation growing at the margins of the less saline parts of the GSL.
Representative GC traces for extracted GSL sediments. (A) F1 (hexane) fraction of sample from 3.42-3.46 m blf showing n-alkanes (red, number labels indicate chain length) dominated by short-chain (C17) compounds likely of aquatic origin and strongly odd-over-even dominant long-chain compounds (C27-C33) likely produced by terrestrial plants. (B) Preparatory GC mid- and long-chain fraction for sample from 5.26–5.295 m blf showing lower yield and chain length distribution shifted toward the mid-chain n-alkanes.

14C ages for the C17 n-alkanes overlapped with the confidence envelope for cysts in all cases (Figure 3C). Cyst ages were slightly younger than C17 ages at 5.22 and 7.48 m blf, and slightly older than the C17 age at 3.42 m blf. Ages of the C17 n-alkanes and TOC were very similar in all three sampled depth intervals (compare Figure 3A and 3C).
Molecular fossil samples from sediments at depths of 5.22, 5.26, 7.48, and 7.53 m blf had low n-alkane yields, and as a result C19 to C33 were combined for 14C analysis. In these samples the 14C ages for the combined n-alkane samples again overlapped with the uncertainty envelope for cysts ages (Figure 3C). In three of four cases, ages for the C19-33 fractions were shifted toward younger ages than those of C17 from the same core interval, generally by 1000 14C years or less. For the uppermost sediment sample, at a depth of 3.42–3.46 m blf, lipid yields were high enough to allow measurement of multiple mid-chain and long-chain n-alkanes fractions (C19-C23, C25-C27, and C29-C33). Here, the 14C age for the mid-chain fraction overlapped that of the C17 n-alkanes and cysts, but fractions containing only lengths above C25 were significantly older. Offsets varied for the two long-chain fractions, with the C25-C27 n-alkanes having the oldest 14C age (2050 14C years older than co-occurring cysts) and the C29-33 fraction showing a somewhat smaller offset (920 14C years).
Terrestrial Macrofossils
Macroscopic charcoal fragments were measured from six intervals (Table 1). These samples were assumed to be of terrestrial origin given that fires are unlikely to affect aquatic vegetation. Moreover, the relatively large size and elongate shape of the particles collected suggests that they experienced limited transport and detrital aging before burial. The “old wood” effect, related to the age of trees from which charcoal is derived, may be relevant to some of the fragments sampled, but is unlikely to bias the ages obtained by more than a few hundred years (Ascough et al. Reference Ascough, Cook and Dugmore2005), well within the uncertainty range of all interpretations drawn here. All charcoal samples gave ages that were younger than cyst ages (Figure 3D), with age differences ranging from 380 to 2990 14C years. The largest offsets, by far, were associated with two samples at 7.75 and 9.4 m blf, which also gave younger ages than overlying charcoal samples from 4.84 and 6.31 m blf, producing an age inversion. A single spherical, equant seed assumed to have originated from a terrestrial plant (given the absence of aquatic macrophytes within most of the GSL) was found at 1.848 m blf in core 1A. The age offset relative to cysts, assuming an equivalence of depths between the 1A and 1B cores, was 1090 14C years. The δ13C value of the seed was several per mil lower than those measured for all aquatic substrates and consistent with values for tissues of valley-dwelling C3 land plants in the Great Basin (DeLucia and Schlesinger Reference DeLucia and Schlesinger1991), supporting the conclusion that the seed was derived from outside of the lake (Table 1).
DISCUSSION
Age Inversions and Record Quality
Stratigraphically inverted ages are commonly interpreted to represent redeposition of older, reworked material (e.g., Kusumgar et al. Reference Kusumgar, Agrawal, Bhandari, Deshpande, Raina, Sharma and Yadava1992; Edwards and Whittington Reference Edwards and Whittington2001), however they could also reflect sample contamination or temporal fluctuations in the reservoir effect (for aquatic samples). Excluding biomarkers and substrates sampled at only one level, age inversions were observed for brine shrimp cysts at two levels, carbonates near the base of the study interval, and charcoal samples throughout the middle part of the interval.
Minor age inversions were observed for cyst samples at 3.43 and 7.51 m blf, where in each case the uncalibrated sample ages are ∼150 14C years older than those of the underlying samples. In both cases there is substantial overlap in the age errors for the discordant samples and their underlying partners, and we do not consider the inversions to be significant. In addition to minor reworking and redeposition of cysts, the age inversions could reflect either (1) transient changes in the reservoir age of GSL DIC, or (2) changes in the fraction of terrestrial organic matter consumed by the Artemia (discussed further below). Theoretically the δ13C of cysts might be used to identify either of these mechanisms, since in both cases the more 14C-depleted sources (i.e. rock-derived DIC and aquatic primary production) should have higher δ13C values. Cyst δ13C values range between –17.8 and –21.3‰, similar to the values we measured for algal mat samples (–18.1 to –19.8‰). This suggests that the diet of Holocene Artemia was dominated by algal biomass, though at least occasionally may have included a 13C-depleted terrestrial component. Cyst δ13C values within the intervals of 14C age inversion, however, were not consistently 13C-depleted, with the sample at 3.43 m blf having lighter values, and that at 7.51 m blf heavier values, than adjacent samples (Table 1). Given this, and given the relative infrequency of inversions and the pseudo-linear age/depth relationship for the cyst dataset (Figure 2), we suggest that variation in Artemia diet and/or DIC reservoir age had a relatively small impact on the cyst-based age record.
A small age inversion (700 14C years) in carbonate dates near the base of the study interval exceeds the uncertainty range for these samples but could easily be explained by minor differences in the contribution of reworked carbonate to the two samples in question. Far more significant is the inversion created by the four charcoal samples between 4.84 and 9.42 m blf, with the lower two samples having ages as much as 1690 14C years younger than those of the overlying ones. Accepting that charcoal is unlikely to derive from aquatic vegetation or experience detrital or old wood effects of this magnitude, it is challenging to explain this inversion of ages based on any of the mechanisms discussed thus far.
We suggest two possible explanations for the charcoal age inversion, both related to potential mis-handling of the samples (see above). First, it is possible that the samples for the lower two levels may have been contaminated with modern carbon during handling. All charcoal samples were quite small, and even trace contamination could have significantly impacted the measured dates. Dates for the lower two samples within the inversion are anomalously young relative to the cysts and other substrates from the same core interval, whereas the cyst-charcoal offsets from the upper two samples are much more consistent with the other three levels where terrestrial material can be compared with cysts (Figure 3D, light gray points). Moreover, if the ages for the lower two charcoal samples were accurate depositional ages for their core levels this would imply a ∼9-fold increase in average sediment accumulation rates through the Middle Holocene. Such a change is not observed based on evidence from 14C and the position of the Mazama Ash in other GSL cores (Balch et al. Reference Balch, Cohen, Schnurrenberger, Haskell, Garces, Beck, Cheng and Edwards2005; Oviatt et al. Reference Oviatt, Madsen, Miller, Thompson and McGeehin2015) and would require large and systematic changes in the reservoir age of the GSL to explain the near-linear age-depth relationship in our cyst data (Figure 2). Accepting only the upper two charcoal ages from the inversion interval as correct implies a somewhat smaller (factor of 5) and less systematic variation in accumulation rates. Collectively, this suggests that if a subset of the inverted charcoal data was affected by contamination, the lower values are likely suspect, and the upper ones may have yielded accurate ages.
The second possibility we consider is a mix-up of sample IDs, such that all charcoal ages are accurate depositional ages, but their stratigraphic order is incorrect. Assuming that the relative ages of the four samples indicate their correct stratigraphic order gives a somewhat more consistent age offset between cysts and charcoal throughout the core, with values ranging from approximately 1400–2300 14C years excluding the highest sample (Figure 3D, white points). This solution implies even larger changes in sediment accumulation rates (factor of 16) throughout the study interval, but over smaller depth intervals where such changes may be more plausible. Without additional constraints it is not possible to unequivocally determine which of these possibilities is correct, but in the remaining discussion we prefer the first (contamination of the lower two inversion interval dates) given the lower implied variation in sediment accumulation rates. The implications of this preference are limited and are discussed below where relevant.
Carbon Pathways to Sediment
Our data show a wide range of apparent 14C ages for different substrates at the same core depth. Next, we consider the nature of these differences as they may relate to detrital processes affecting materials preserved in the GSL sediments.
Algae, Cysts, and Total Organic Carbon
Filamentous algae found in the mats sampled here are the most fragile of the substrates measured, as any reworking and consequent exposure to oxygen would cause decomposition of the cells and loss of the green pigments (Villanueva and Hastings Reference Villanueva and Hastings2000). The origin of these layers is uncertain, but their filamentous morphology suggests they are not comprised of the Dunaliella that dominate photic zone productivity today (Stephens and Gillespie Reference Stephens and Gillespie1976). The mats could reflect transient shifts in phytoplankton composition associated with freshening of the lake or changing zooplankton dynamics (Wurtsbaugh and Berry Reference Wurtsbaugh and Berry1990), or be derived from benthic cyanobacterial production during periods when grazing within the upper water column deepened the photic zone. In either case, the 14C content of algae should be a direct recorder of paleo-lake DIC, as their biomass carbon is inherited from photic zone DIC fixed during photosynthesis (Moroney and Somanchi Reference Moroney and Somanchi1999). Algae thus provide a benchmark for “fresh,” lake-derived organic matter, against which other lacustrine substrates can be assessed for detrital effects.
Cyst ages at all three levels sampled for algae show ages that are younger than algae by 200–500 14C years (Figure 3A), and thus the age comparison provides no support for detrital pre-aging or re-working of cysts. If the filamentous algae were deposited during discrete hydrographic events in which the lake freshened, the differences between brine shrimp and algae ages may reflect minor, short-term fluctuations in the reservoir age of lake DIC. Alternatively, we suggest that the younger ages of the brine shrimp cysts may reflect a contribution of 14C-enriched (relative to DIC, assuming a non-zero DIC reservoir age) terrestrial particulate organic carbon (POC) to the diets of filter-feeding Artemia. Artemia are non-selective filter feeders (Mohebbi Reference Mohebbi2010), and although their diet in the modern, hydrologically modified GSL is dominated by phytoplankton (Wurtsbaugh and Gliwicz Reference Wurtsbaugh and Gliwicz2001), allochthonous particulate matter may also have contributed to their diet at times in the past. Evidence for similar effects on the 14C values of zooplankton has been reported from other lakes and used to characterize variation in terrestrial subsidies to aquatic food webs across time and taxa (Fernandes et al. Reference Fernandes, Dreves, Nadeau and Grootes2013; Ishikawa et al. Reference Ishikawa, Uchida, Shibata and Tayasu2014; Keaveney et al. Reference Keaveney, Reimer and Foy2015).
Input of terrestrial POC to the lake might also be reflected in the 14C values of total sedimentary organic carbon. Lake sediments can contain a mixture of allochthonous terrestrial organic matter delivered via rivers (Raymond and Bauer Reference Raymond and Bauer2001) or aeolian transport (Simoneit et al. Reference Simoneit, Cardoso and Robinson1991) and autothonous lacustrine organic matter. This could lead to a spectrum of 14C age offsets, with aeolian transport likely to be rapid and deliver fresh carbon lacking a lake reservoir effect (and thus “younger” than co-occurring algae or cysts) and riverine transport potentially delivering carbon from soils and/or eroding rocks that might be much older than lacustrine material. We observe a broad similarity between 14C contents of TOC, cysts, and algae: within two of the sampled intervals the apparent ages of TOC are older than cysts by several hundred years, similar to algal biomass, and in a third, uppermost, interval they match cyst values closely. Although this suggests potential for some “fresh” terrestrial component in the upper interval, overall the similarities imply either that neither detrital effect strongly contributes to the TOC or that the balance of effects produces a pool of TOC that, on average, has an age at the time of deposition similar to that of lacustrine organics. The prevalence of autochthonous lacustrine sources is supported by the δ13C values of TOC (–18.1 to –20.8‰), which are similar to those of algal material and higher than expected for most terrestrial sources given the dominance of C3 vegetation in this region throughout the Holocene (Cotton et al. Reference Cotton, Cerling, Hoppe, Mosier and Still2016). Although the presence of long-chain hydrocarbons in the lake sediments suggests some input of terrestrial material, we argue that the most parsimonious interpretation of our results is that, in contrast to some other lake systems (Abbott and Stafford Reference Abbott and Stafford1996), TOC in the GSL is little affected by allochthonous organic matter. TOC may thus provide a relatively consistent archive of lacustrine organic matter suitable for 14C and geochemical proxy work (e.g., Oviatt et al. Reference Oviatt, Madsen, Miller, Thompson and McGeehin2015).
Molecular Fossils
Ages of short chain C17 n-alkanes are nearly identical to those of TOC from the same levels (Figure 3). Given that these biomarkers are produced primarily by algae (Blumer et al. Reference Blumer, Guillard and Chase1971; Gelpi et al. Reference Gelpi, Schneider, Mann and Oro1970), this provides further support for the primacy of autocthonous aquatic organic matter as a source of TOC. These ages overlap in all cases with the cyst age model, and what offsets are suggested are similar to those seen for algal mat biomass, implying little to no winnowing and redeposition of the short-chain n-alkanes.
The longer chain n-alkane splits (C25-27 and C29-33) measured at 3.42 m blf, which are most likely dominated by allochthonous material produced by vascular land plants, are depleted in 14C compared with cysts (Figure 3C), suggesting they are derived at least in part from a pre-aged reservoir. The magnitude of the offset observed here is similar to that seen in other study systems with contrasting catchment characteristics (e.g., Eglinton et al. Reference Eglinton, Benitez, Pearson, McNichol, Bauer and Druffel1997; Blair et al. Reference Blair, Leithold, Ford, Peeler, Holmes and Perkey2003; Drenzek et al. Reference Drenzek, Montluçon, Yunker, Macdonald and Eglinton2007; Douglas et al. Reference Douglas, Pagani, Eglinton, Brenner, Hodell, Curtis, Ma and Breckenridge2014). These compounds are known to be transported both by wind and water (e.g., Schreuder et al. Reference Schreuder, Stuut, Korte, Sinninghe and Schouten2018), and given the semi-arid environment of the GSL we had expected that aeolian deposition might be an important vector for the delivery of long-chain n-alkanes to the lake sediments. The data from this level, however, suggesting a substantial lag between synthesis and deposition, imply that direct transport by wind ablation and entrainment is unlikely, and that these lipids were more likely eroded and transported aquatically or resided in soils and were mobilized by wind erosion prior to deposition. The older age for the C25-27 fraction relative to C29-33 is difficult to explain by these mechanisms, in that if these compounds shared a common land-plant source they would likely have been subject to similar transport pathways and lags. Instead, it is possible that the shorter-chain fraction may include a contribution of fossil carbon, as has been observed, for example in sediments of the Black Sea (Eglinton et al. Reference Eglinton, Benitez, Pearson, McNichol, Bauer and Druffel1997).
Data from lower-yielding samples, where the mid- and long-chain fractions were pooled, contrast with the 3.42 m blf sample in that the pooled fractions all give ages similar to those of the C17 n-alkanes and the brine shrimp cysts (Figure 3C). The similarity between the 14C content of cysts and the composite samples suggests a very minor contribution of pre-aged n-alkanes to these composite samples. Gas chromatography shows that the distribution of mid- and long-chain n-alkanes in these samples is shifted toward the mid-chain lengths relative to that in the high-yielding sample (Figure 4). Ficken et al. (Reference Ficken, Li, Swain and Eglinton2000) proposed that the ratio of mid-chain (C23-25) to long-chain (C29-31) n-alkanes in sediments may be reflective of the relative contributions of aquatic to terrestrial macrophytes. Although macrophytes are limited in their distribution to freshwater bays of the GSL and wetlands around the lake, and presumably have been throughout the Holocene (Balch et al. Reference Balch, Cohen, Schnurrenberger, Haskell, Garces, Beck, Cheng and Edwards2005), applying the index of those authors would suggest that aquatic production might have contributed more substantially to the total pool of mid- and long-chain compounds in low-yielding relative to the high-yielding samples (∼45% vs. ∼25%). This may in part explain the lower alkane-cyst age offsets for the pooled mid- and long-chain fractions from the low-yielding samples. On the other hand, δ13C values for the combined fractions are, with one exception, significantly lower than those of the short-chain alkanes (Table 1), consistent with these compounds having originated from plants using an atmospheric (rather than aquatic) carbon source. Another contributor to the reduced age offsets for these samples might be a change in the relative contribution of lipids sourced from wind ablation and entrainment vs. soil erosion or riverine transport.
Given the difference in 14C age offsets and n-alkanes yields between the 3.42 m blf level and samples lower in the core, it seems likely that the sample at depth 3.42 m blf represents a period of exceptional preservation of longer-chain n-alkanes, possibly due to enhanced riverine delivery of terrestrial material. Depending on interpretations of the paleo-lake reservoir age, discussed, below, the approximate age of this core level is similar to that of a major late Holocene GSL highstand previously inferred from other methods (Currey et al. Reference Currey, Atwood, Mabey, Roy and Brown1984; Murchison Reference Murchison1989), and climate change during this period may have contributed to a shift in the dominant modes of transport of alkanes to the lake. We note that at this level the 14C values of TOC converge with those of Artemia cysts, perhaps suggesting that rivers were delivering elevated fluxes of both “old” long-chain n-alkanes and “young” POC to the GSL at this time, with latter contributing substantially to the bulk sedimentary OC.
Carbonates
In the absence of detrital effects carbonate ages should be similar to those of aquatic organic substrates, but 14C ages measured for all carbonates are several thousand years older than those of any organic substrate from the same intervals. Spencer et al. (Reference Spencer, Baedecker and Eugster1984) reported age offsets of as much as 900 years between carbonate and TOC at two Holocene levels in the GSL, and attributed these differences to a detrital carbonate fraction. The ages reported here suggest even more significant detrital effects at GLAD Site 1, and the nature of the processes involved may have significant implications for the quality of paleo-environmental information preserved in the GSL carbonate record.
The millennial-scale age offsets observed here may reflect in-lake winnowing and reworking, in a manner similar to reworking observed in Bear Lake, Utah and Idaho where older, aragonitic sediments are eroded from shallow depths and re-deposited deeper in the lake (Dean et al. Reference Dean, Rosenbaum, Kaufman, Rosenbaum and Kaufman2009). Bathymetric gradients within the GSL are small in comparison with Bear Lake, however, and it is also possible that windblown carbonate from deflationary surfaces in the Great Basin might contribute old, 14C-dead, material to the lake floor (Prospero et al. Reference Prospero, Ginoux, Torres, Nicholson and Gill2002). We are unable to distinguish among these possibilities based on the data gathered here, but speculate that the increase in age offsets for carbonates at lower levels of the core could potentially be explained if deposition of reworked carbonate from glacially eroded landscapes and/or exposed Lake Bonneville sediments declined through the Holocene as these landscapes became stabilized. The two mechanisms for the age offsets would carry differing implications for use of GSL sedimentary carbonates in paleoenvironmental reconstruction. In the first case variation in carbonate proxy records from the lake might be both attenuated and shifted in the time domain through time-averaging associated with reworking, whereas in the second an input of an exogenous carbonate fraction would be expected primarily to damp the amplitude of climate signals in the carbonate record.
Reservoir Age and Age Model
Based on the 14C content of colloidal dissolved organic matter, which is largely produced by algae, Leenheer et al. (Reference Leenheer, Noyes, Rostad and Davisson2004) estimated the 14C content of GSL DIC in 2002 was 104 pMC (percent modern carbon). A sample of modern brine shrimp cysts collected from the lake in 2007 and analyzed here gave a value of 100.3 pMC (Table 1). Given estimated atmospheric 14C contents of about 108 and 106 pMC for these two years (Hua et al. Reference Hua, Barbetti and Rakowski2013), this suggests a reservoir age of about 300 years for the DIC and 440 years for cysts. These values are similar to the 500-year hard-water effect assumed by Broecker and Kaufman (Broecker and Kaufman Reference Broecker and Kaufman1965) based on their analysis of the 14C balance of the lake during the aboveground testing era (Broecker and Walton Reference Broecker and Walton1959), and probably reasonably constrain the modern reservoir age of the lake.
Paleo-lake reservoir ages are best assessed by comparing the 14C content of well-preserved terrestrial macrofossils and co-occurring material that is likely to derive its carbon exclusively from DIC; e.g., primary carbonates, non-emergent plant tissues, or tissues of aquatic animals. Terrestrial macrofossils suitable for dating here include charcoal from GLAD core 1B and a subfossil seed from core 1A. A discussion of the charcoal data quality has been presented above. Although there is no stratigraphic control between GLAD cores 1A and 1B, the cores were collected in close proximity and preserve sediment of similar character, and we assume equivalency between the depth of the seed recovery and the core 1B depth scale. This is supported by the concordant age for carbonate from the seed-bearing level of 1A assuming equivalence of the 1A and 1B depth scales. We evaluate the terrestrial data against data from Artemia cysts, using Fm values interpolated to the level of the terrestrial organic samples. We have already argued for little to no influence of detrital effects on the cyst ages, aside from perhaps a small contribution of young terrestrial POC to their diet. Thus we argue that any age offsets between cysts and terrestrial materials most likely result from a reservoir effect in GSL lake water DIC, and that R values estimated from cysts likely give a minimum estimate for the reservoir age of paleo-lake DIC (given that they may assimilate some terrestrial C from their diet).
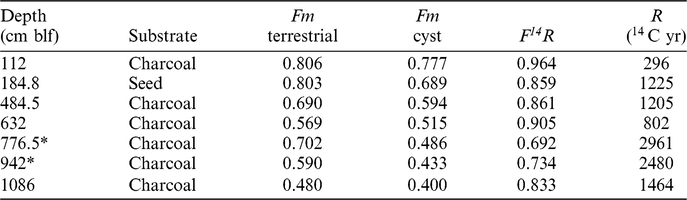
Given our preferred interpretation of the charcoal sample ages, reservoir ages for the four “valid” charcoal levels and one seed level range from 300 to 1460 years (Table 2). With the exception of the uppermost charcoal level (1.12 m blf), which gives the youngest value of R, these values are relatively consistent, averaging 1170 years (1σ = 275). The alternative interpretation of the charcoal data, invoking mis-ordering of the samples, gives a somewhat larger and more variable value of R below the 1.12-m level (1690 ± 470 years). A recent measurement of TOC in GSL sediments at the level of the well-dated Mazama Ash (6740 14C years) gave a value that is ∼1.8 kyr older than the ash (Oviatt et al. Reference Oviatt, Madsen, Miller, Thompson and McGeehin2015), and earlier measurements on larger, depth-averaged samples gave similar or somewhat larger offsets (Spencer et al. Reference Spencer, Baedecker and Eugster1984). Given the observed age offsets between TOC and cysts in our dataset, both interpretations of our charcoal data produce cyst apparent reservoir ages consistent with these published data. Oviatt (Reference Oviatt, Madsen, Miller, Thompson and McGeehin2015) suggested that the TOC age offset in their study might reflect processes other than a reservoir effect; we argue here that the consistency of ages between cysts, TOC, and other demonstrably aquatic substrates, including those not prone to re-working (e.g., algal mat biomass), strongly favors the reservoir effect as an explanation for these age offsets.
Radiocarbon reservoir age estimates. blf = below lake floor, Fm = fraction modern, F14R and R give initial content of 14C in cysts relative to stated substrate and associated reservoir age, respectively.

* Small, age-inverted samples.
The uncalibrated age-depth relationship for cysts is pseudo-linear below the uppermost ∼1.4 meters of core (Figure 2), suggesting that if any substantial changes in R occurred in the lake, they must have been systematically coupled with changes in sediment accumulation rates. Although this is possible, the more parsimonious explanation is that both R and accumulation were near-constant. Independent evidence supporting changes in accumulation rate (e.g., facies changes or significant unconformities) is lacking at any point in the study interval.
In this context, the dramatic shift in the age-depth relationship near the top of the core is of interest. Both the uppermost charcoal sample, which lies within this upper interval, and the modern data described above imply similar reservoir ages of ∼200–400 years, much lower than estimated lower in the core. We suggest that the 14C reservoir age of GSL DIC may have decreased substantially, from > 1200 to < 500 years, during the late Holocene. Given the presence of only one charcoal-based age in this upper portion of our record, additional data from shallow sediments will be required to constrain the timing and drivers of this change; it is possible, however, that it may relate to anthropogenic alteration of the carbon cycle in the GSL and/or its drainage basin.
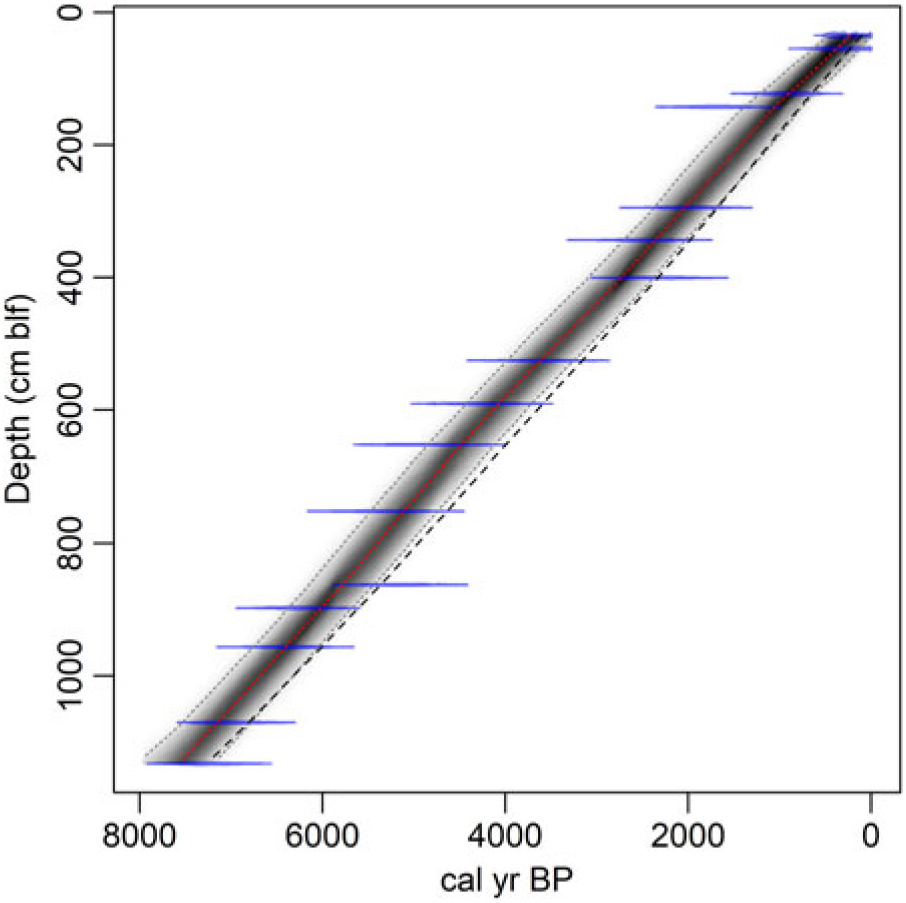
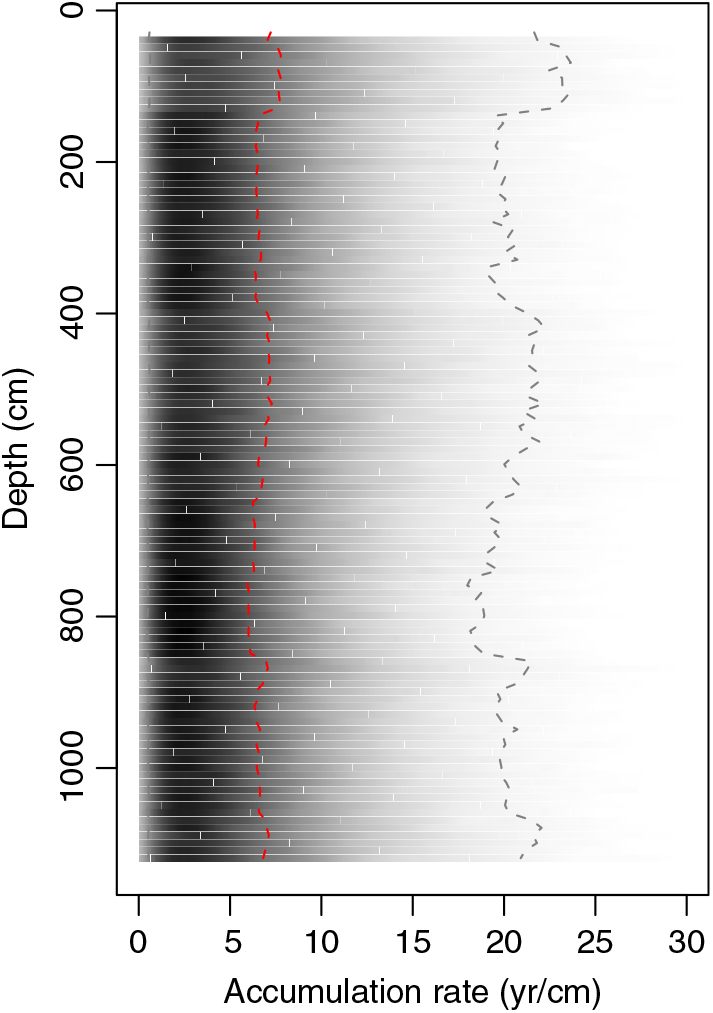
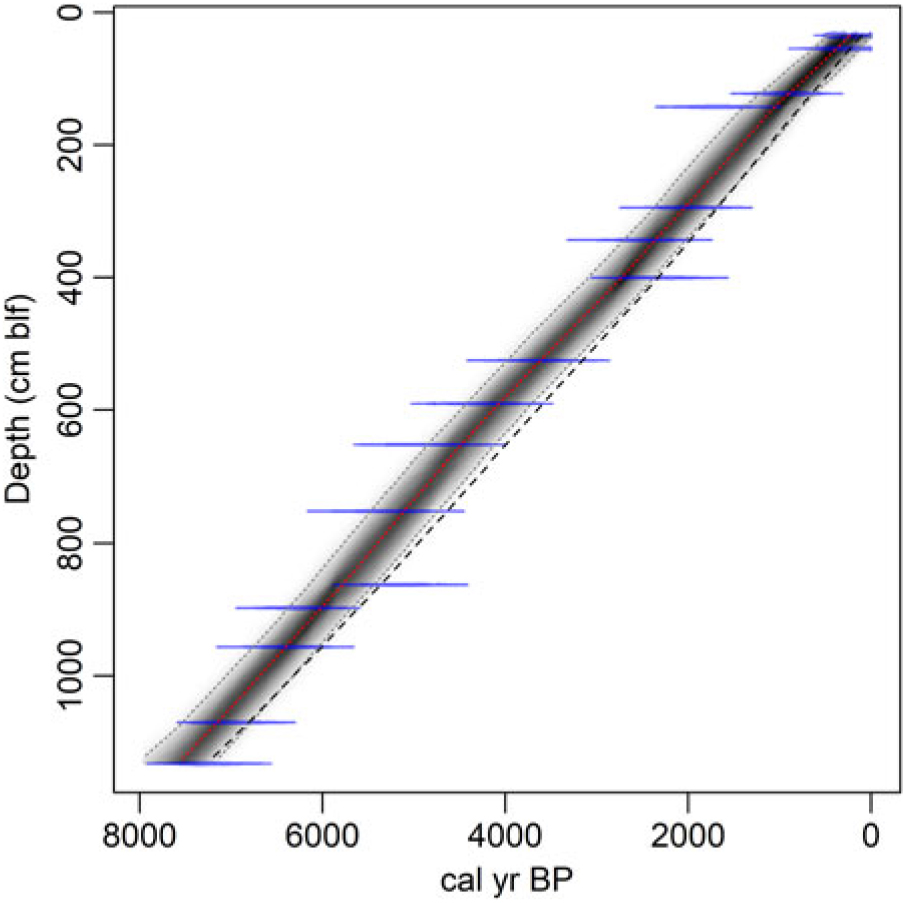
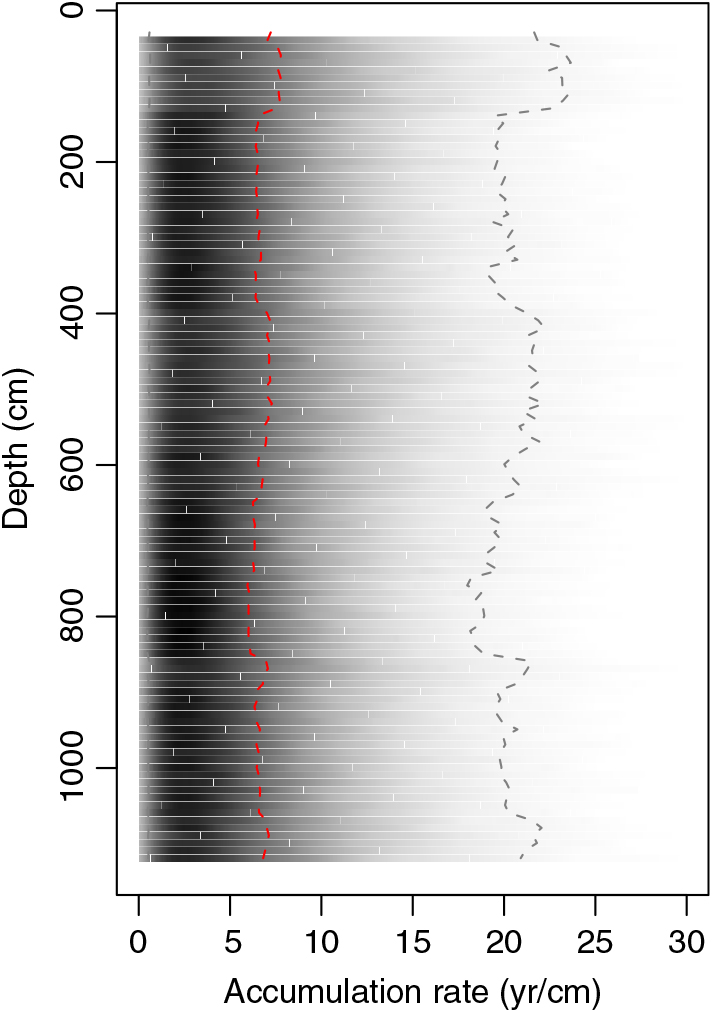
We developed two reservoir-corrected age models based on the cyst ages and incorporating the average reservoir age estimates from our two interpretations of the charcoal data (Figure 5). Markov Chain Monte Carlo simulations converged robustly (Gelman and Rubin reduction factor << 1.05; Gelman and Rubin Reference Gelman and Rubin1992), and all dates fell within the age model’s 95% confidence bounds. We applied a single value of R (and standard deviation) based on the average seed and charcoal data from below 1.4 m blf to all cyst dates except the top-most one; for the top-most cyst age we used R = 350 ( ± 82) based on the average of the modern measurements and the uppermost charcoal-based estimate described above. This associates the change in reservoir age with the abrupt change in sediment accumulation rate implied by our original spline fit to the uncalibrated cyst ages (Figure 2) but applies the larger reservoir correction to several cyst samples taken above the level of our uppermost charcoal date. We explored alternative age models that placed the shift in R lower in the core; these implied abrupt fluctuations in sediment accumulation rates within the uppermost 1.4 m of the core, whereas the ones presented here give nearly constant mean accumulation throughout the Holocene (Figure 6). We note that the suggestion that R changed significantly and lack of robust constraints on the timing of this change add significant uncertainty to the reservoir-corrected age model above 1.4 m blf. Below this level, the two models overlap strongly, with the preferred interpretation of the charcoal data giving a somewhat tighter distribution of ages (average 95% CI = 705 and 840 years, respectively) and median ages several hundred years older throughout the studied core sections (Figure 6). Both models place the base of the studied section between 7000 and 8000 ka, consistent with the top of the Early Holocene sapropel, estimated at 10.2 ka (Oviatt et al. Reference Oviatt, Madsen, Miller, Thompson and McGeehin2015), occurring within section 5 of the core.
Cyst-based age models incorporating reservoir effect corrections. Ghost and spindle plots show the age model and data for the preferred interpretation of the charcoal data. Dashed line shows the median ages for an age model based on the alternative charcoal interpretation.
Sediment accumulation rates estimated from the cyst-based age model (Figure 3). Median estimates are shown by red dashed line, shading shows the probability density of all estimates, and gray dashed lines give the 95% confidence bounds.
CONCLUSIONS
Multi-substrate 14C data show that, as in other lake and marginal marine settings, sedimentary substrates in the GSL include material from a range of sources and reflecting a diversity of transport pathways. Despite the relatively large size, low productivity and semi-arid setting of the GSL watershed, however, the influence of detrital effects observed here did not exceed that seen in many other systems. In fact, most aquatic substrates preserved in the Holocene sediments of the GSL are minimally affected by detrital effects, meaning that proxy records derived from these substrates should provide coherent and comparable information on changes in the paleo-lake. In contrast, carbonates and long-chain n-alkanes will produce records that may be shifted in time and/or attenuated in amplitude due to aging of this material prior to deposition and/or deposition of eroded geological material. We suggest that reservoir ages of GSL dissolved inorganic carbon were larger throughout much of the Holocene than they are today and declined by between 700 and 1500 years sometime within the past ∼2000 years. Uncertainties in the timing of this change and the magnitude of the reservoir effect during the Holocene limit the precision of 14C-based age models, but a reservoir-corrected model with an uncertainty of ∼700 years (95% CI) implies nearly consistent mean sediment accumulation rates since 8000 ka and implies potential for reconstruction of paleo-environmental conditions from the GSL sedimentary archive.
ACKNOWLEDGMENTS
We thank the staff of the LacCore facility for facilitating access to and sampling of the GLAD cores and the NOSAMS facility for analytical guidance and support. This work was funded by U.S. National Science Foundation award EAR-0602162 to GJB.