INTRODUCTION
The complexity of the rumen ecosystem, the difficulties of working with fistulated animals and the increased public awareness of animal rights have contributed to the development of numerous in vitro techniques to simulate rumen fermentation. In recent years, there has been an increased use of batch cultures (BC) of ruminal microorganisms, which are being widely utilized for nutritive evaluation and screening feed additives, among other multiple purposes. The use of BC is a rapid and precise in vitro method that needs only a small amount of substrate, but requires an inoculum (IN) which may influence the fermentation process (Mould et al. Reference Mould, Kliem, Morgan and Mauricio2005). As has been previously stated (Warner Reference Warner1956; Czerkawski & Breckenridge Reference Czerkawski and Breckenridge1977), it is challenging to evaluate how closely an in vitro system can mimic the in vivo rumen and to select the most appropriate parameters for measurement. To date, studies comparing fermentation patterns in BC with those found in vivo are very limited and have contradictory results. Rymer & Givens (Reference Rymer and Givens2002) tested three mixed diets and found significant relationships between the volatile fatty acid (VFA) pattern produced in BC and in the rumen of sheep. In contrast, Brown et al. (Reference Brown, Rymer, Agnew and Givens2002) found no relationship between the VFA pattern measured in BC and in the rumen of steers fed eight different forages, and attributed the lack of correlation between in vitro and in vivo data to differences in the diets fed to the steers and those fed to the ruminal fluid donors in the in vitro trial.
Any in vitro system designed to simulate rumen fermentation should mimic the natural rumen, including the physical environment and the maintenance of key microbial populations (Ziemer et al. Reference Ziemer, Sharp, Stern, Cotta, Whitehead and Stahl2000). Ideally, the microbial composition in the in vitro system should be representative, in terms of quantity and quality, of that found in the rumen of the host animal. Despite the importance of this aspect, the number of studies comparing microbial populations in the rumen with those in the in vitro systems is limited, and most of them have been conducted in continuous fermenters. To our knowledge, only Prates et al. (Reference Prates, De Oliveira, Abecia and Fondevila2010) have compared the structure of bacterial communities in BC with that in the rumen fluid used as IN, and reported a mean similarity index of 70·2% between both bacterial communities; this would indicate that some changes in bacterial composition were produced over the 24 h incubation period, although only one diet was tested in that study and the magnitude of the changes may be influenced by the composition of the incubated diet.
The objectives of the current study were to assess how closely BC can mimic the in vivo rumen fermentation of diets of variable composition and to analyse changes in bacterial communities over the incubation period as assessed by automated ribosomal intergenic spacer analysis (ARISA). For that purpose, four different diets were incubated in BC, and the results were validated with those determined in sheep fed the same diets.
MATERIALS AND METHODS
Animals, diets and experimental design
All the experimental procedures were approved by the León University Institutional Animal Care and Use Committee. The in vitro experiment was conducted in conjunction with an in vivo study analysing the effects of forage-to-concentrate ratio (FCR) and type of forage on rumen fermentation characteristics, diet digestibility and microbial protein synthesis in sheep (Ramos et al. Reference Ramos, Tejido, Martínez, Ranilla and Carro2009a). For the current study, four of the six Merino sheep utilized in the previous study were selected. The sheep (58·5 ± 3·16 kg of body weight) were fitted with permanent ruminal and T-type duodenal cannulae. Animals were housed in individual pens and had continuous access to fresh water and vitamin–mineral blocks over the experimental period.
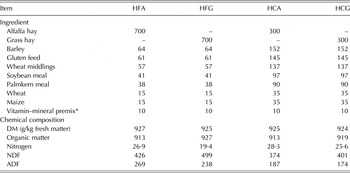
The four experimental diets had high forage (HF; 700 g/kg; dry matter (DM) basis) or high concentrate (HC; 700 g/kg DM) content, with either alfalfa hay (HFA and HCA) or grass hay (HFG and HCG) as forage. The same concentrate was used in all the diets. Ingredient and chemical composition of diets are shown in Table 1. Diets were fed twice daily (08·00 and 20·00 h) at a daily rate of 56 g DM/metabolic weight (kg body weight0·75) to minimize feed selection. Diet intake was monitored daily and all animals consumed all the diet offered, with the exception of one sheep that occasionally left some refusals (<100 g/day) of diet HFG.
Ingredient (g/kg DM) and chemical composition (g/kg DM) of the experimental diets with 700 g of forage/kg DM (HF) or 300 g of forage/kg DM (HC) and alfalfa hay (A) or grass hay (G) as forage

* Vitamin–mineral premix contained per kilogram of DM: 11250 IU of vitamin A; 2250 IU of vitamin D3; 25 mg of vitamin E; and 10 mg of CuSO45H2O.
The experiment had a 4 × 4 Latin square design with four 34-day experimental periods. Each period consisted of 22 days of dietary adaptation, 8 days (days 23–30) for determination of in vivo parameters, and 2 days for conducting the in vitro experiment. Sheep data collection included measurements of rumen fermentation characteristics (pH and concentrations of ammonia (NH3–N), VFA and lactate) and of rumen apparent degradability of dry matter (DMD) and neutral detergent fibre (NDFD). On day 30 of each period, ruminal content samples (c. 50 g) were taken through the cannula of each sheep at 0, 2, 4, 6, 8, 10, 12, 14, 16, 18, 20 and 22 h after the morning feeding and strained through four layers of cheesecloth. The pH of the fluid was immediately measured, and three samples were taken: 5 ml of fluid were added to 5 ml of deproteinizing solution (100 g of metaphosphoric acid and 0·6 g of crotonic acid/litre) for VFA analysis, 2 ml were added to 2 ml of 0·5 m chloridric acid (HCl) for NH3–N determination and 5 ml were frozen at −20 °C for total lactate analysis. In order to assess the duodenal flow of digesta, chromium-mordanted (Cr-mordanted) fibre and cobalt-ethylendiaminetetraacetic acid (Co-EDTA) were used as solid and fluid phase markers, respectively. From days 18 to 26, 15 g of Cr-mordanted fibre were administered daily via the ruminal cannula into four equal portions at 08·00, 14·00, 20·00 and 02·00 h and Co-EDTA was infused into the rumen (60 mg of cobalt (Co) in 250 ml of distilled water/day) by means of a peristaltic pump. On days 23, 24 and 25 duodenal digesta samples were collected at 6 h intervals and samples were pooled by sheep and stored at −20 °C. Duodenal samples were thawed at 4 °C, homogenized, and one-half of each sample was centrifuged (1000 g, 5 min, 4 °C) to obtain particulate matter (Faichney Reference Faichney, Warner and McDonald1975). Both samples of whole duodenal digesta and particulate matter were lyophilized and analysed for ash and neutral detergent fibre (NDF). More details on in vivo procedures are given in Ramos et al. (Reference Ramos, Tejido, Martínez, Ranilla and Carro2009a).
Samples of each diet offered to sheep were ground (1 mm sieve) and used as substrates for the BC incubations. On day 32 of each experimental period, 400 g of rumen contents were taken through the cannula of each sheep immediately before the morning feeding and strained through four layers of cheesecloth. Rumen fluid from each sheep was mixed with the buffer–mineral solution of Goering & Van Soest (Reference Goering and Van Soest1970), modified to reduce the content of sodium bicarbonate (NH4HCO3) to half of its initial concentration with no trypicase added, in proportions of 1 : 4 (vol/vol) at 39 °C under continuous flushing with carbon dioxide (CO2). About 100 ml of each mixture (IN) were placed immediately into sterile containers, frozen at −80 °C and freeze-dried before deoxyribonucleic acid (DNA) extraction. Four bottles (120 ml of volume) containing 400 mg DM of each diet were filled (40 ml/bottle) with the IN from the sheep fed the same diet. Bottles were capped and incubated at 39 °C. After 24 h, two bottles of each diet were opened, the pH was measured immediately and samples of the bottles’ contents were taken for VFA, NH3–N and total lactate analyses as described above. The contents of the bottles were then transferred to previously weighed filter crucibles, washed with 50 ml of hot (50 °C) distilled water, and the crucibles dried at 50 °C and weighed to calculate apparent DMD. Finally, the residue of the crucibles was analysed for NDF to calculate NDFD. The remaining two bottles of each diet were emptied into sterile containers, mixed, frozen immediately at −80 °C and freeze-dried before DNA extraction.
Deoxyribonucleic acid extraction and automated ribosomal intergenic spacer analysis
In order to analyse the changes in bacterial communities over the 24 h of incubation in the BC, DNA was isolated in duplicate from samples (100 mg of DM) of IN and BC contents after mechanical disruption of microorganisms with a MiniBeadbeater (3 min; Biospec Products, Bartlesville, OK, USA). The DNA was extracted following the procedure described by Yu & Morrison (Reference Yu and Morrison2004), with the exception that an additional step involving the treatment of samples with cetyltrimethylammonium bromide was included to remove polymerase chain reaction inhibitors. QIAamp DNA Stool Mini Kit columns (QIAgen, Valencia, CA, USA) were used to purify the DNA. Absorbance ratios (A260 : A280) of eluted DNA measured in a Nanodrop ND-1000 (Nano-Drop Technologies, Wilmington, DE, USA) were between 1·71 and 2·00. The DNA was amplified using universal bacterial primers 16S-1392F and 23S-125R as described by Saro et al. (Reference Saro, Ranilla and Carro2012). Thermocycling and the ARISA technique were conducted in a 2720 Thermal Cycler (Applied Biosystem, Foster City, CA, USA) and a MegaBACE 500 (Amersham Biosciences, Little Chalfont, Bucks, UK), respectively, as reported by Ramos et al. (Reference Ramos, Tejido, Ranilla, Martínez, Saro and Carro2009b). Peaks were identified by comparison with an internal size standard using the GeneMarker Software v1·80 (SoftGenetics, State College, PA, USA) and the presence/absence of the different peaks was considered to compare the electropherogram profiles using a similarity matrix. Shannon's diversity index was used to evaluate the diversity of bacterial communities, and dendrograms were constructed using the per cent similarity and unweighted pair-group method using arithmetic averages options in the MVSP v3·12d software (Kovach Computing Service, Anglesey, Wales, UK).
Chemical analyses
Dry matter (ID 934·01), ash (ID 942·05) and nitrogen (ID 984·13) were determined according to the Association of Official Analytical Chemists (1999), and NDF and acid-detergent fibre (ADF) analyses were carried out according to Van Soest et al. (Reference Van Soest, Robertson and Lewis1991) in an ANKOM220 Fibre Analyser unit (ANKOM Technology Corporation, Fairport, NY, USA) using sodium sulphite and a heat-stable amylase. The concentration of ammonia nitrogen (NH3–N) was determined using a spectrophotometer by the phenol–hypochlorite method (Weatherburn Reference Weatherburn1967) and those of VFA by gas chromatography as described by Carro et al. (Reference Carro, Lebzien and Rohr1992). Analysis of lactate concentration was carried out following the procedure of Taylor (Reference Taylor1996).
Calculations and statistical analyses
Duodenal flow was calculated from the concentrations of Cr and Co in duodenal digesta phases using the dualphase maker method of Faichney (Reference Faichney, Warner and McDonald1975). Samples were mathematically reconstituted to create a representative sample from the concentrations of each nutrient analysed in each of the duodenal phases (Faichney Reference Faichney, Warner and McDonald1975). The concentrations of VFA, NH3–N and lactate in sheep rumen were averaged across sampling times before statistical analysis (four values per diet). Values measured in the two bottles incubated for each IN in each period in the in vitro trial were averaged before statistical analysis (four values per diet).
In vivo and in vitro data were analysed separately to assess the effects of dietary treatments on each fermentation system. Data were analysed as a mixed model using the PROC MIXED of SAS (2012). The effects FCR, forage, FCR × forage interaction and period were considered fixed, while sheep (in vivo trial) and IN (in vitro study) effects were considered random. Effects were considered significant at P ≤ 0·05. Relationships between fermentation variables determined in BC and in sheep were tested by correlation analyses using the CORR procedure of SAS (2012).
RESULTS
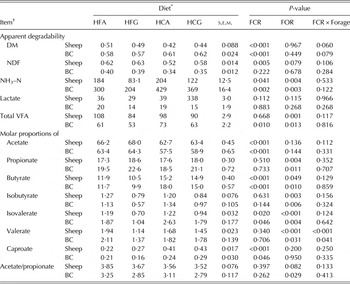
The effects of FCR and type of forage on ruminal fermentation parameters and diet degradability in sheep and BC are shown in Table 2. There were no FCR × forage interactions for any measured variable in BC, with the exception of the molar proportion of valerate (P = 0·041) and a trend for apparent DMD (P = 0·060). This agrees well with the results obtained in sheep, in which FCR × forage interaction was only found for valerate proportion (P < 0·001) and a trend for apparent DMD (P = 0·079).
Effect of forage : concentrate ratio (FCR) and type of forage on apparent degradability(g/g) of DM and neutral-detergent fibre, concentrations of NH3–N (mg/l), lactate (mg/l) and total VFA (mmol/l), molar proportions (mol/100 mol) of individual VFA and acetate/propionate ratio (mol/mol) in sheep and in BC of rumen microorganisms inoculated with sheep ruminal fluid

* HFA: 700 g of alfalfa hay/kg DM; HFG: 700 g of grass hay/kg DM; HCA: 300 g of alfalfa hay/kg DM; HCG: 300 g of grass hay/kg DM. The same concentrate was used in all diets.
† Values for pH, NH3–N, lactate and VFA in sheep are means across sampling times of 0, 2, 4, 6, 8, 10, 12, 14, 16, 18, 20 and 22 h after the morning feeding. Values in BC were measured after 24 h incubation.
Final pH values in BC were 6·76, 6·83, 6·65 and 6·69 for diets HFA, HFG, HCA and HCG, respectively, whereas mean pH values in sheep rumen were 6·36, 6·49, 6·23 and 6·17, respectively. Reducing the forage proportion in the diet decreased rumen pH in sheep (P = 0·003), but only a trend was observed in the BC (P = 0·064). While fermentation of HF diets in sheep resulted in greater (P < 0·05) apparent DMD and NDFD compared with HC diets, HF diets in BC tended to have lower (P = 0·052) DMD than HC diets and no differences (P = 0·222) in NDFD were observed. Concentrations of NH3–N were lower (P < 0·05) in both fermentation systems for HF compared with HC diets, but no differences were observed in lactate concentrations.
The lack of FCR effect on VFA concentrations in sheep contrasts with the greater (P = 0·010) VFA concentrations observed for HC diets in the BC. There was good agreement between BC and sheep in the interpretation of the effects of FCR on VFA profile, and in both systems fermentation of HF diets resulted in greater (P < 0·05) proportions of acetate and acetate : propionate ratio, and lower (P < 0·05) proportions of butyrate, isovalerate and caproate compared with the fermentation of HC diets.
Both fermentation systems detected similar differences attributable to forage type for most parameters measured. Diets containing alfalfa hay promoted higher (P < 0·05) apparent DMD, NH3–N and total VFA concentrations, and proportions of butyrate, isobutyrate, isovalerate and valerate than those containing grass hay in both sheep and BC. Degradability of NDF tended to be higher (P = 0·079) for alfalfa hay-diets than for grass hay-diets in sheep, but no differences due to forage type were detected in BC.
There were differences between fermentation systems in the magnitude of most determined parameters. Values of pH were higher (P < 0·001) in BC than in sheep (0·37 and 0·47 units for HF and HC diets, respectively). Sheep had apparent DMD values lower (P < 0·001) than BC for both HF (0·502 and 0·574 g/g, respectively) and HC diets (0·471 and 0·617 g/g, respectively). For all the diets, values of NDFD were between 1·55 and 1·69 times lower in BC than in sheep. Concentrations of NH3–N in BC were between 1·63 and 3·02 times higher than in vivo, whereas lactate and total VFA concentrations were 0·47–0·55 and 0·57–0·74 of those in vivo, respectively. Despite the differences in the magnitude of total VFA concentrations, there were significant relationships between in vivo values and those in BC (n = 16) for acetate (r = 0·831; P < 0·001), propionate (r = 0·647; P = 0·007) and butyrate (r = 0·582; P = 0·018) proportions and acetate : propionate ratio (r = 0·675; P = 0·004).
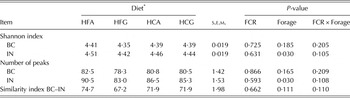
A total of 181 peaks were detected in the ARISA electropherograms across the full set of 32 samples, and the number of peaks in individual samples ranged from 75 to 94 in the inocula and from 65 to 90 in the BC samples. As shown in Table 3, the number of peaks and Shannon index in samples from BC were unaffected by FCR and forage type, but inocula from sheep fed diets with alfalfa hay had higher (P = 0·030) number of peaks and Shannon index than inocula from grass hay-fed sheep. The similarity index between the bacterial communities in the inocula and those in the corresponding BC was unaffected by the studied dietary factors.
Effect of FCR and type of forage on values of Shannon index and numbers of peaks detected in the ARISA electropherograms of samples from BC of rumen microorganisms and from the sheep rumen fluid (IN) used to inoculate the BC, and similarity index (%) of ARISA profiles between BC and IN

* HFA: 700 g of alfalfa hay/kg DM; HFG: 700 g of grass hay/kg DM; HCA: 300 g of alfalfa hay/kg DM; HCG: 300 g of grass hay/kg DM. The same concentrate was used in all diets.
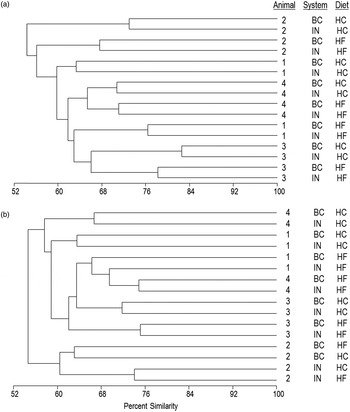
Figures 1(a) and (b) show the dendrograms of the ARISA profiles of inocula and BC samples for diets containing alfalfa hay and grass hay, respectively. No clear clustering according to fermentation system or FCR was observed, but for diets containing alfalfa hay samples from Sheep 4 and 3 formed two clearly differentiated clusters; similarly, samples from Sheep 2 clustered together in the dendrogram constructed for diets with grass hay.
Dendrograms of ARISA profiles of bacterial communities in ruminal fluid from sheep used as IN and in BC after 24 h of incubation for diets with either 700 (HC) or 300 (HF) of concentrate per kg DM and alfalfa hay (Fig. 1(a)) or grass hay (Fig. 1(b)) as forage. Numbers 1–4 correspond to individual sheep. In each case, sheep were fed the same diet incubated in the BC.

DISCUSSION
The BC are frequently used to analyse rumen fermentation characteristics of different diets, and from a practical point of view it would be interesting to assess whether they can detect differences between diets similar to those observed in vivo. Therefore, the effects of FCR and forage type on rumen parameters in BC were assessed, and the results were compared with those obtained in the sheep used as rumen fluid donors.
The lack of marked differences in pH between HF and HC diets observed in BC was partly due to the high buffer capacity of the buffer–mineral solution, which prevented a pH drop in the BC with HC diets. Therefore, the pH decrease observed in sheep fed HC could not be reproduced in the BC, and this was also reflected in the greater in vitro pH values compared with those in sheep observed for all diets. Concentrations of NH3–N in BC were higher than those in vivo and much higher than those usually observed in the rumen of animals fed similar diets (Mackie et al. Reference Mackie, Gilchrist, Robberts, Hannah and Schwartz1978; Carro et al. Reference Carro, Valdés, Ranilla and González2000). This was possibly due to the use of an N-enriched buffer–mineral solution, but also to the lack of absorption in the BC. Mean values of NH3–N concentrations in the inocula used to fill the BC were 131, 105, 167 and 167 for HFA, HFG, HCA and HCG diets, respectively. In addition, it should be taken into account that the modified buffer–mineral solution of Goering & Van Soest (Reference Goering and Van Soest1970) used in the present study supplied 84·11 mg N per litre in the form of NH4HCO3, which can be rapidly degraded to NH3 by ruminal microorganisms. These results would indicate that reducing the amount of N in the buffer–mineral solution (i.e., NH4HCO3 being replaced by NaHCO3) would help to achieve more physiological NH3–N concentrations in BC when incubating diets similar to those used in practical feeding of ruminants. In contrast, lactate concentrations were lower in BC than in vivo, which confirms previous studies (Tejido et al. Reference Tejido, Ranilla, García-Martínez and Carro2005; Mateos et al. Reference Mateos, Ranilla, Tejido, Saro, Kamel and Carro2013). These results may suggest either lower lactate production or greater lactate utilization in BC compared with sheep, but probably the high buffer capacity of the buffer–mineral solution prevented low pH values that might have stimulated the growth of lactate producers.
Absolute amounts of feed input and rumen digesta outflow are different in the in vivo and in the in vitro systems, and that could explain some of the observed differences in the magnitude of several parameters. The lower concentrations of total VFA in BC compared with the sheep rumen agree with previous observations (Rymer & Givens Reference Rymer and Givens2002; Brown et al. Reference Brown, Rymer, Agnew and Givens2002) and were attributed to the lower feed/rumen fluid ratio in the BC (0·01; 0·4 g DM in 40 ml) than that in vivo (0·17; 1,184 g DM in an estimated rumen volume of 7000 ml; Ranilla et al. Reference Ranilla, López, Giráldez, Valdés and Carro1998). Moreover, dilution of ruminal fluid with the buffer–mineral solution before incubation also leads to a lower initial concentration of VFA in the BC. However, it should also be considered that VFA are removed from the rumen by absorption and flow to the lower tract, whereas there is no absorption or digesta flow in the BC. Despite the differences in the magnitude of total VFA concentrations, significant relationships between both measurements were observed for the main VFA proportions. This is in agreement with results of Rymer & Givens (Reference Rymer and Givens2002), who also found significant relationships between the VFA pattern in BC and in the rumen of sheep fed three mixed diets. In contrast, Brown et al. (Reference Brown, Rymer, Agnew and Givens2002) reported no relationship between the VFA measured in BC and those in the rumen of steers fed eight different forages; they attributed the lack of relationship to the use as IN for the BC trial of rumen fluid from a different animal species (sheep). In addition, the in vivo experiment was conducted with steers fed only forage, whereas the sheep donors of rumen fluid for the in vitro experiment were fed a mixed diet (600 g forage/kg and 400 g concentrate/kg).
The significant relationships observed in the current study between in vivo and in vitro VFA profile would indicate a similar fermentation pattern in both systems, although in paired t test comparisons acetate proportions were lower (P < 0·001) and those of propionate greater (P = 0·002) in BC than in sheep. As pointed out by Rymer & Givens (Reference Rymer and Givens2002), some differences between in vitro and in vivo fermentations can be partly explained by fibrolytic bacteria being more active in vivo v. in vitro. Manipulation of rumen contents for its use as IN inevitable implies a certain exposure to oxygen that reduces the viability of the fibrolytic bacteria (Russell & Wilson Reference Russell and Wilson1996). This would help to explain the lower acetate proportions in the BC, which is consistent with the lower (P < 0·001) NDFD observed in the in vitro system, as acetate is mainly produced from the fermentation of structural carbohydrates. The higher concentrations of isovalerate (P < 0·001) and valerate (P = 0·049) in the BC than in sheep may also indicate a lower capture of these branched-chain VFA by fibrolytic bacteria, as they use these VFA for the synthesis of essential amino acids, long-chain fatty acids and aldehydes (Bryant Reference Bryant1973).
The similarity index between the bacterial communities in the ruminal fluid from sheep used as IN and those in the corresponding BC ranged from 67·2 to 74·7% for the different diets. These values are similar to the 70·2% of similarity found by Prates et al. (Reference Prates, De Oliveira, Abecia and Fondevila2010) when comparing the bacterial communities’ structure in semi-continuous BC with alfalfa hay as substrate after 24 h of incubation with that in the rumen fluid used as IN. These results would indicate that some changes in bacterial communities were produced over the incubation period. Different conditions in BC, such as the buffer capacity of the incubation medium, feeding rate (substrate/cultivation medium), digesta retention time, movements, etc., compared with the sheep rumen may have caused a selection of some bacterial strains. Given the wide range of bacteria inhabiting the rumen, it would be expected that some community members adapt well to the environmental conditions in BC, whereas others cannot grow under the same conditions. In accordance with this hypothesis, in paired Student's t test comparisons across diets both the number of peaks and Shannon index’ values were lower (P < 0·001) in BC (79·3 and 4·37, respectively) than in the inocula (86·3 and 4·46), and 14 peaks appearing in the inocula samples were never detected in any BC sample. When individual pairs of samples (inocula for each diet and sheep and its corresponding BC) were compared the number of peaks appearing in the inocula and not detected in BC ranged from 21 to 34, and this number was not affected (P > 0·05) by FCR (mean values of 28·8 and 26·5 for HF and HC diets, respectively), forage type (mean values of 26·6 and 28·6 for diets containing alfalfa and grass hay, respectively) or individual sheep (28·0, 26·5, 27·5 and 28·5 for sheep 1, 2, 3 and 4, respectively). These results seem to indicate that environmental conditions in BC were the main factors influencing transition of the bacterial communities, as diet characteristics and animal donor had no influence on the number of peaks in the inocula not appearing in the BC.
The cluster pattern observed in the dendrograms would indicate that sheep had a larger effect on bacterial communities than diet or fermentation system. Interestingly, in all the cases each BC sample showed the highest similarity index with its corresponding IN, with the exception of samples from Sheep 2 fed the diet containing grass hay. These results highlight the importance of using an IN from donors fed a diet similar to that being incubated in BC when conducting in vitro experiments.
In conclusion, although there were differences between sheep and BC in the magnitude of most parameters, differences between diets attributed to forage type in BC were similar to those in sheep for most of the measured parameters. However, there were discrepancies between in vivo and BC in the interpretation of the effects of FCR on some parameters, such as pH, NDFD and total VFA concentrations. The similarity in bacterial communities between the IN and BC was >67% for all diets, but the lower bacterial diversity in BC compared with rumen fluid from sheep used as IN would indicate a selection of some bacterial strains over the incubation period. Studies identifying changes in specific microbial populations through the incubation period in BC would be helpful to understand the observed differences in fermentation parameters between in vivo and in vitro systems and might contribute to improve in vitro fermentation systems. Moreover, reducing the NH4HCO3 concentration in the buffer-mineral solution would help to achieve more physiological NH3–N concentrations in BC when incubating diets similar to those used in practical feeding of ruminants.
Funding provided by the Spanish C.I.C.Y.T. (Project No. AGL2011-22628) is gratefully acknowledged.