1. Introduction
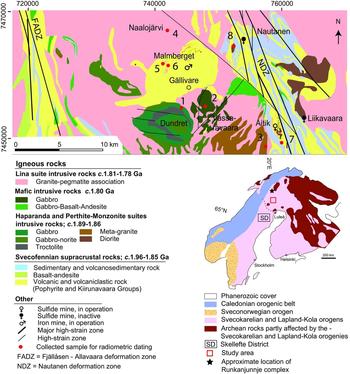
Northern Norrbotten, Sweden is a world-class mining district with several active mines, including the Kiirunavaara and Malmberget iron deposits and the Aitik Cu-Au deposit, hosting in total more than 4 billion tons of ore with a combined annual production of up to 70 Mt (Boliden 2015, LKAB 2015). The Malmberget and Aitik mines are located only 20 km apart in the southern part of northern Norrbotten, in the vicinity of Gällivare town. Several minor prospects and mineralizations also occur in the area (Fig. 1). These deposits are hosted within volcano-sedimentary units intruded and surrounded by multiple generations of igneous suites, including large bodies of ultramafic–mafic layered complexes (Bergman, Kübler & Martinsson, Reference Bergman, Kübler and Martinsson2001). Some of these intrusive bodies are suggested to have provided the heat and/or metal source to the magmatic and hydrothermal mineralizations in the area (Wanhainen, Billström & Martinsson, Reference Wanhainen, Billström and Martinsson2006; Billström et al. Reference Billström, Broman, Eilu, Martinsson, Niranen, Ojala, Wanhainen, Weihed and Porter2010; Martinsson et al. Reference Martinsson, Billström, Broman, Weihed and Wanhainen2016). However, the role and timing of these igneous suites in relation to ore formation in the Gällivare area has only been investigated in a few studies.
Generalized map of the Gällivare area with NDZ (Nautanen deformation zone) in east and FADZ (Fjällåsen-Allavaara deformation zones) in the west (modified from the Geological Survey of Sweden (SGU)). Coordinates in Swedish national grid system, SWEREF 99 TM. Inset map shows the generalized geology of the Fennoscandian shield (modified from Koistinen et al. Reference Koistinen, Stephens, Bogatchev, Nordgulen, Wennerstrom and Korhonen2001). Dashed line marks the southern limit of hidden Archean basement as revealed by Nd isotopes in younger rocks (Mellqvist et al. Reference Mellqvist, Öhlander, Skiöld and Wikström1999; Öhlander et al. Reference Öhlander, Skiöld, Elming, Claesson and Nisca1993). The red square marks the study area.

Previous U–Pb age determinations of a few of the igneous rocks, within active mines and surrounding the deposits, have returned partly inconclusive results with low precision (Skiöld et al. Reference Skiöld, Öhlander, Vocke and Hamilton1988; Smith, Storey & Jeffries, Reference Smith, Storey and Jeffries2005; Smith et al. Reference Smith, Storey, Jeffries and Ryan2009; Storey, Smith & Jeffries, Reference Storey, Smith and Jeffries2007).
Wanhainen (Reference Wanhainen2005), Wanhainen et al. (Reference Wanhainen, Billström, Martinsson, Stein and Nordin2005) and Wanhainen, Billström & Martinsson (Reference Wanhainen, Billström and Martinsson2006) determined ages of igneous crystallization and hydrothermal reworking of igneous rocks at the Aitik mine using thermal ionization mass spectrometry (TIMS) and obtained zircon and titanite ages of c. 1.89 and 1.75–1.80 Ga. Romer (Reference Romer1996) reported two generations of fracture mineralization in the Malmberget mine: 1.74–1.71 Ga (monazite and stilbite) and 1.64–1.60 Ga (titanite and apatite). Molybdenite rhenium-osmium (Re–Os) dating on various veins and both deformed and undeformed pegmatite dykes in the Aitik mine returned ages of 1.88, 1.85 and 1.73 Ga, respectively (Wanhainen Reference Wanhainen2005; Wanhainen et al. Reference Wanhainen, Billström, Martinsson, Stein and Nordin2005).
However, these were deposit-scale studies focusing on genetic aspects of some specific deposits rather than regional. There are therefore only a few ages on major rock suites in the larger Gällivare area. Good-quality and robust radiometric ages from igneous rocks surrounding and within active mines are of considerable importance and currently required to reconstruct the geological evolution of the Gällivare area; they are also important in order to understand ore-forming processes. This study presents new secondary-ion mass spectrometry (SIMS) data of single zircon crystals from a set of intrusive rocks emplaced in the vicinity of the major ore bodies, as well as from the large igneous intrusions in the Gällivare area.
2. Geological background
The geology of northern Norrbotten comprises an Archean cratonic nucleus which has been subjected to a complex geodynamic evolution, including several plume-related rifting events, followed by subduction and compressional events (Martinsson, Reference Martinsson2004; Weihed et al. Reference Weihed, Billström, Persson and Weihed2002, Reference Weihed, Arndt, Billström, Duchesne, Eilu, Martinsson, Papunen and Lahtinen2005; Lahtinen, Korja & Nironen, Reference Lahtinen, Korja and Nironen2005; Lahtinen, Garde & Melezhik, Reference Lahtinen, Garde and Melezhik2008). Archean basement rocks are cropping out mainly in northernmost Norrbotten, but also in the south (e.g. Martinsson, Vaasjoki & Persson, Reference Martinsson, Vaasjoki, Persson and Bergman1999; Mellqvist et al. Reference Mellqvist, Öhlander, Skiöld and Wikström1999; Lundqvist, Skiöld & Vaasjoki, Reference Lundqvist, Skiöld and Vaasjoki2000; Bergström, Bergman & Hellström, Reference Bergström, Bergman and Hellström2015). The Archean basement comprises meta-granitoids emplaced at c. 2.8 Ga, and subsequently metamorphosed and recrystallized at 2.7 Ga and later (e.g. Skiöld, Reference Skiöld1979; Martinsson, Vaasjoki & Persson, Reference Martinsson, Vaasjoki, Persson and Bergman1999; Bergman, Kübler & Martinsson, Reference Bergman, Kübler and Martinsson2001). Palaeoproterozoic rocks are uncomformably overlying the Archean rocks and range in age over 1.8–2.5 Ga. Basaltic to andesitic volcanic rocks, basaltic lavas, volcaniclastic rocks and clastic rift-related sedimentary rocks of the Kovo group form the lowest part of the Palaeoproterozoic stratigraphy (Martinsson, Reference Martinsson1997; Martinsson, Vaasjoki & Persson, Reference Martinsson, Vaasjoki, Persson and Bergman1999). The lower portions of this sequence comprise poorly sorted sedimentary units overlain by finer material (Hanski et al. Reference Hanski, Huhma, Rastas and Kamenetsky2001; Vaasjoki, Reference Vaasjoki2001) and intruded by multiple generations of layered intrusions with noritic composition generated during 2.505–2.440 Ga (Alapieti & Lahtinen, Reference Alapieti, Lahtinen and Cabri2002). These layered noritic intrusions strongly indicate a plume-driven continental uplift leading to continental rifting as the basis for the generation of the voluminous basaltic material, as well as the thick pile of clastic sedimentary units (Bergman, Kübler & Martinsson, Reference Bergman, Kübler and Martinsson2001; Lahtinen, Garde & Melezhik, Reference Lahtinen, Garde and Melezhik2008).
Rifting of the Archean craton in the SW at c. 2.1 Ga generated a passive margin that later shifted to a convergent zone with subduction beneath the Archean craton at 1.9 Ga (Öhlander et al. Reference Öhlander, Skiöld, Elming, Claesson and Nisca1993; Martinsson et al. Reference Martinsson, Billström, Broman, Weihed and Wanhainen2016). The border between the original Archean craton and juvenile accreted crust has been delineated as the Archean–Proterozoic palaeoboundary, based on Nd isotopes, running WNW–ESE between Luleå and Jokkmokk (e.g. Öhlander et al. Reference Öhlander, Skiöld, Elming, Claesson and Nisca1993; Mellqvist et al. Reference Mellqvist, Öhlander, Skiöld and Wikström1999; Öhlander, Mellqvist & Skiöld, Reference Öhlander, Mellqvist and Skiöld1999).
A subduction system was initiated at 1.9 Ga when an oceanic plate subsided beneath the Norrbotten micro-continent, lead to the generation of 1.89–1.87 Ga calc-alkaline magmatism north of the Skellefte district (Öhlander et al. Reference Öhlander, Skiöld, Elming, Claesson and Nisca1993; Wanhainen, Billström & Martinsson, Reference Wanhainen, Billström and Martinsson2006; Martinsson et al. Reference Martinsson, Billström, Broman, Weihed and Wanhainen2016). The subduction activity was short lived in northern Norrbotten and ceased at 1.88 Ga (Cliff, Rickard & Blake, Reference Cliff, Rickard and Blake1990; Romer, Martinsson & Perdahl, Reference Romer, Martinsson and Perdahl1994) but arc-magmatism was active at 1.876 Ga further towards the south (Skiöld, Öhlander & Markkula, Reference Skiöld, Öhlander and Markkula1993). Volcanic and intrusive rocks in northern Norrbotten of this episode were dominated by intermediate compositions (andesites/diorites/granodiorites) with typical calc-alkaline character (high in Al and low in Ti, Zr contents); assigned to a subduction regime, they are referred to as the Porphyrite group and the Haparanda suite, respectively (e.g. Martinsson & Perdahl, Reference Martinsson, Perdahl and Perdahl1995; Martinsson, Reference Martinsson2004). The Haparanda suite ranges in composition from gabbro to granite but is dominated by diorite and granodiorite, with alkali-calcic to calc-alkaline affinities (Martinsson & Perdahl, Reference Martinsson, Perdahl and Perdahl1995; Bergman, Kübler & Martinsson, Reference Bergman, Kübler and Martinsson2001; Martinsson, Reference Martinsson2004).
A change from calc-alkaline to mildly alkaline magma compositions with high Ti, P, Y and Zr contents, in addition to high-Ti flood basalts with a tholeiitic character, in the Kiruna area were interpreted as a shift from a subduction regime to an extensional environment (Martinsson & Perdahl, Reference Martinsson, Perdahl and Perdahl1995). Extensional arc-related volcanic and intrusive igneous rocks are grouped into the Kiirunavaara group and the Perthite monzonite suite (PMS), respectively (Martinsson & Perdahl, Reference Martinsson, Perdahl and Perdahl1995; Martinsson, Reference Martinsson2004; Martinsson et al. Reference Martinsson, Billström, Broman, Weihed and Wanhainen2016). The PMS rocks include gabbro, diorite, monzonite and granite, with syenitoid compositions dominating (Bergman, Kübler & Martinsson, Reference Bergman, Kübler and Martinsson2001). Rocks belonging to this suite are medium- to coarse-grained and commonly reddish in colour. Zoned intrusive complexes with felsic centres and gabbroic outer margins are typical for intrusive complexes of the PMS (Kathol & Martinsson, Reference Kathol and Martinsson1999). The dominant chemical trend is alkali-calcic. Radiometric ages for the Haparanda suite and PMS range over 1.86–1.89 Ma and 1.86–1.88 Ma, respectively (Bergman, Kübler & Martinsson, Reference Bergman, Kübler and Martinsson2001).
A giant array of batholiths stretching approximately 1400 km from southernmost Sweden to northern Norway have been referred to as the Transscandinavian Igneous Belt (TIB; Högdahl, Andersson & Eklund, Reference Högdahl, Andersson and Eklund2004). Rocks belonging to the TIB are coarse-grained monzodiorites to granites, as well as gabbroic to intermediate rocks with destructive plate margin affinity (Högdahl, Andersson & Eklund, Reference Högdahl, Andersson and Eklund2004). The TIB is divided into four main geographical areas, including the Revsund magmatism (1.81–1.76 Ga) to the south of the present area (Högdahl, Andersson & Eklund, Reference Högdahl, Andersson and Eklund2004). It is suggested that TIB rocks south of the Archean–Proterozoic palaeoboundary formed in response to an eastwards subduction (Wilson, Reference Wilson1980; Nyström, Reference Nyström1982; Andersson, Reference Andersson1991; Romer & Wright, Reference Romer and Wright1992; Weihed et al. Reference Weihed, Billström, Persson and Weihed2002; Andersson et al. Reference Andersson, Sjöström, Högdahl, Eklund, Högdahl, Andersson and Eklund2004b; Rutanen & Andersson, Reference Rutanen and Andersson2009), mainly by reworking juvenile Svecofennian crust supplemented by mantle additions in a continental arc setting (Andersson, Reference Andersson1991, Reference Andersson, Ahl, Andersson, Lundqvist and Sundblad1997; Andersen et al. Reference Andersen, Andersson, Graham, Åberg and Simonsen2009). TIB rocks in western Norrbotten comprise two generations of monzonite or syenite to quartz monzonite and granite that formed at 1.79–1.71 Ga (Romer, Martinsson & Perdahl, Reference Romer, Martinsson and Perdahl1994; Martinsson, Reference Martinsson2004). In northeastern Norrbotten, 1.80 Ga monzonitic, syenitic and gabbroic intrusions with typical diameters of 3–7 km are common (Bergman, Kübler & Martinsson, Reference Bergman, Kübler and Martinsson2001; Martinsson, Reference Martinsson2004).
There are a few mafic to intermediate rocks, c. 1.8 Ga old, that often occur as solitary and isolated bodies with a more alkaline, and possibly TIB-related, character in northern Norrbotten (Martinsson, Reference Martinsson2004).
Continued east-dipping subduction and the associated compressional stage generated middle crust S-type magmas (Lina granites) during the late stage of the Svecofennian orogeny (1.81–1.78 Ga: Bergman, Kübler & Martinsson, Reference Bergman, Kübler and Martinsson2001; Weihed et al. Reference Weihed, Billström, Persson and Weihed2002). The term Lina granite suite includes mainly granite-pegmatite associations found in northern Norrbotten (Bergman, Kübler & Martinsson, Reference Bergman, Kübler and Martinsson2001). The type locality was originally described by Holmqvist (Reference Holmqvist1905) from an area 26 km NW of Gällivare town. Rocks belonging to the Lina granite suite are typically reddish in colour and porphyritic with 4–15 mm large microcline phenocrysts (Martinsson, Reference Martinsson2004). However, fine-grained and evenly grained varieties are common (Bergman, Kübler & Martinsson, Reference Bergman, Kübler and Martinsson2001).
At least two metamorphic and compressional deformation events are known: an early stage at 1.88 Ga, and a later stage at 1.81–1.79 Ga (Bergman, Kübler & Martinsson, Reference Bergman, Kübler and Martinsson2001; Bergman et al. Reference Bergman, Billström, Persson, Skiöld and Evins2006; Lahtinen et al. Reference Lahtinen, Huhma, Lahaye, Kousa and Luukas2015; Martinsson et al. Reference Martinsson, Billström, Broman, Weihed and Wanhainen2016). The early deformation event had an NNE shortening direction, locally generating a well-defined penetrative foliation (S1) that is distinct in meta-volcanic and meta-sedimentary rocks in the Gällivare area (Lynch et al. Reference Lynch, Jönberger, Bauer, Sarlus and Martinsson2015). The second-stage deformation event had an E–W shortening direction and did not generate a distinct penetrative foliation; rather, it resulted in the folding of a pre-existing S1 foliation in the Gällivare area with localized axial planar, parallel and very weakly developed spaced cleavage (Lynch et al. Reference Lynch, Jönberger, Bauer, Sarlus and Martinsson2015). The metamorphic grade varies across northern Norrbotten, ranging from granulite facies in the east to greenschist facies in the west (Bergman, Kübler & Martinsson, Reference Bergman, Kübler and Martinsson2001). A study from the Nautanen deformation zone (NDZ) within the Gällivare area indicated regional peak metamorphism at 550–660°C and 1.5–5.8 kbar (i.e. lower to middle amphibolite facies). Contact metamorphism adjacent to granitic intrusions were estimated to 620–665°C and 2–3 kbar and retrograde metamorphism estimated to 430–570°C and 3.0–3.5 kbar (Tollefsen, Reference Tollefsen2014).
3. Methods
Samples were collected during two field campaigns in 2013 and 2014, in order to constrain the minimum crystallization age of each rock unit. Sample volumes differed for the mafic and felsic rocks since the primary interest was to extract zircons for U–Pb dating. In general, larger volumes of samples were collected for the mafic rocks than for felsic rocks. In total 8 samples were collected. The zircon extraction procedure was carried out at Luleå University of Technology, and included crushing, grain size reduction using a chromium swing mill, and sieving the material to obtain a size fraction of 40–500 µm. Magnetic separation was carried out using a hand magnet and a Frantz Isodynamic magnetic separator. Density separation involved a Wilfley table and a heavy liquid (Methylene Iodide (CH2I2 3.2 g cm–3). The zircon crystals were hand-picked using an optical microscope/stereoscope. Depending on the availability of zircon grains within samples, metamict, fractured and broken grains were avoided during collection. Selected zircon crystals were mounted together with the reference zircon 91500 (with a well-constrained age of 1065.4±0.3 Ma (1σ); Wiedenbeck et al. Reference Wiedenbeck, Alle, Corfu, Griffin, Meier, Oberli, von Quadt, Roddick and Spiegel1995) by NORDSIM staff at the Swedish Museum of Natural History, Stockholm, Sweden. Two mounts were prepared which were polished to reveal the internal structure of the crystals, later examined using a conventional petrographic microscope (Nikon ECLIPSE E600 POL) and scanning electron microscopy with backscattered electron (BSE) imaging (Zeiss Merlin FEG-SEM), both at Luleå University of Technology. The internal structures of the zircons were studied by cathodoluminescence (CL) imaging (Hitachi S-4300 FE-SEM, NORDSIM Laboratory). The mounts were covered with a 30 nm thick gold layer at the NORDSIM laboratory. A spot size of 25 µm was chosen based on the heterogeneity and size of the grains. If applicable, both the cores and rims of the crystals were analysed.
The U–Pb isotopic analysis were carried out using the Cameca IMS 1280 high spatial and mass resolution secondary ion mass spectrometer (SIMS) using an O2− ion beam at the NORDSIM Laboratory, Stockholm. The procedure of analysing a standard after each round of five samples was conducted throughout the entire analysis. The analytical approach for zircon U–Th–Pb isotopic analysis at the NordSIM laboratory follows the method described by Whitehouse et al. (Reference Whitehouse, Kamber and Moorbath1999) and Whitehouse & Kamber (Reference Whitehouse and Kamber2005).
The results were corrected for initial common Pb according to the global Pb evolution model of Stacey and Kramers (Reference Stacey and Kramers1975). The crystals were re-imaged with the CL method at the NORDSIM laboratory and BSE method at Luleå University of Technology. Inverse concordia (Tera–Wasserburg) diagrams were constructed and 207Pb–206Pb weighted average ages were calculated using the Isoplot program of Ludwig (Reference Ludwig2003). Calculated ages are reported with a 2σ level of confidence. The mean square weighted deviations (MSWD) presented for concordia ages are both for concordance and equivalence.
4. Results
In the following section, sample locations, sample descriptions, zircon characteristics and morphologies, calculated concordant and 207Pb–206Pb weighted average ages are presented. All calculated ages including the 207Pb–206Pb weighted average ages are presented with 2σ uncertainties. For the majority of samples, the calculated concordant ages and 207Pb–206Pb weighted average ages overlap well. Discordant isotopic analyses (ellipses represented in grey colour) were normally omitted in the age calculation.
4.a. Dundret layered complex
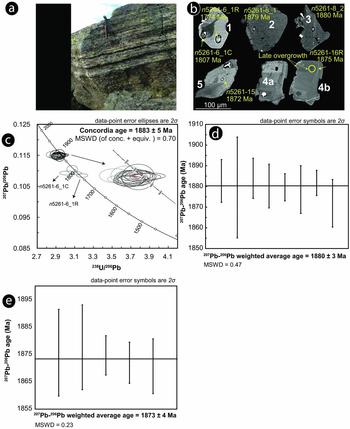
The Dundret layered complex is a rounded to sub-rounded body rising c. 820 m above sea level with three distinct peaks located south of Gällivare town (Fig. 1). The sample for radiometric dating was collected from the eastern part of the complex (sample 1 in Fig. 1; SWEREF99: N7455022, E744206). The mineralogy comprises mainly olivine, pyroxene, plagioclase and amphiboles with minor biotite, titanite, rutile and zircon. In total, 30 zircon crystals were extracted from a 20 kg sample. The obtained zircons exhibit irregular, broken, fractured, sub-rounded, stubby and equant shapes, with a typical aspect ratio of 1:2. The zircon crystals have a pale pinkish colour with few grains showing single pyramidal phase development. Most of the crystals show a homogenous character with few exceptions showing weak oscillatory zoning (Fig. 2b). Crystals with a suspected core–rim relationship were analysed.
(a) A cumulate portion of the Dundret layered complex. (b) Cathodoluminescence (CL) and backscattered electron (BSE) images of zircon crystals. 1, BSE image of zircon crystal with spot placed in bright zone giving younger 207Pb–206Pb age compare to the spot placed in a mixture zone giving slightly older 207Pb–206Pb age. 2, 3, Rather homogenous zircon crystals with overgrowths along the margins, distinguished by weak contrasts in the BSE images. The interior of the crystals is well preserved giving 207Pb–206Pb ages close to that of the crystallization age of the unit. 4a, b, BSE and CL image of the same crystals exhibiting magmatic rims that are wide with late overgrowth along the margins intruding inwards, best seen in 4b. A late overgrowth 207Pb–206Pb age is indicated by spot n5261-16R. 5, BSE image of zircon crystals with spot placed in a late overgrowth zone, yielding similar age within error as zircon crystals in 4. Yellow circles mark spot locations. (c) Reverse concordia (Tera–Wasserburg) diagram and concordia age calculation for sample 11-ZS-13 (n = 8; grey ellipses are not included in age calculation). (d) Calculated 207Pb–206Pb weighted average age with the 2σ level of confidence for same eight analyses as in (c). (e) Calculated 207Pb–206Pb weighted average age from spots placed in observed bright zones in BSE images.

In total 15 crystals were analysed with single spot analysis and 4 crystals suspected for a core–rim relationship with two spot analyses, in total 23 analysed spots (Table 1). No clear core–rim relationship was observed. However, BSE images revealed dark and light regions inter-growing into each other with a distinct late overgrowth visible at the margin of a few crystals (Figs 2b1, 5). These regions are clearly visible in the CL images (Fig. 2b4b). Analysis of the dark regions in BSE images gives 207Pb–206Pb dates ranging over 1883–1879 Ma (excluding single crystal at 1872 Ma, where the spot is placed near a fracture zone), compared to bright regions ranging over 1878–1871 Ma (Table 1, Fig. 2b (2, 5)).
Ion-microprobe U–Th–Pb data for zircons from, Dundret, Gällivare area, northern Norrbotten, Sweden. Data in grey shading omitted from age calculations. dz – dark zone in BSE imaging; bz – bright zone in BSE imaging; fz – fracture zone, cfz – close to fracture zone; mxz – mix zone between bright and dark domains in BSE images; mtmz – metamict zone; osc – oscillatory zoned; ov – overgrowth; hmz – homogenous zone.

1 Measured Th and U signals; 2f206 is the percentage of common Pb estimated from 204Pb counts (in parentheses where these are insignificant); 3Ratios after subtraction of common Pb (if detected); 4Concordance (%). The second number reports the closest approach to concordia at 2σ limit (blank is concordant within error).
A majority of the spots placed in dark regions intersects the concordia and their ellipses overlap well, apart from a few spots placed in the vicinity of fractured or mixed zones.
Within a few crystals some bright zones give concordant to near-concordant 207Pb–206Pb ages ranging over 1787–1774 Ma, that is, c. 100 Ma younger than the bulk of analyses (Table 1, Fig. 2c). One analysed spot on the crystal n5261-6C is placed between the dark and bright zone, giving a concordant mixed date (1807 Ma) as seen in Figure 2b (1) and c.
For the calculation of crystallization ages, concordant analyses from dark domains placed in homogeneous regions are used. A concordia age yielded 1883±5 Ma (MSWD of concordance+equivalence = 0.7, n = 8), and a 207Pb–206Pb weighted average age of the same analysis yielded 1880±3 Ma (MSWD = 0.47: Fig. 2c, d). A 207Pb–206Pb weighted average age from the bright zones yielded 1873±4 Ma (MSWD = 0.79, n = 5; Fig. 2e).
A 207Pb–206Pb age of 1774 Ma is indicated by the crystal n5261-6_1R (Table 1, Fig. 2b (1)) plotting concordantly on the concordia graph (Fig. 2c).
4.b. Vassaravaara layered complex
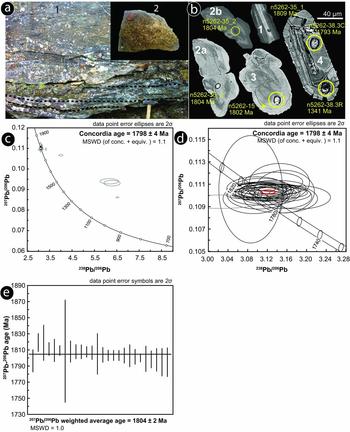
The Vassaravaara complex is situated east of the Dundret layered complex and south of Gällivare town. Parts of the complex are strongly magnetic due to an elevated magnetite content and show primary magmatic layering (Fig. 3a). One sample for radiometric dating was collected from the central part of the complex (sample 2 in Fig. 1; SWEREF99: N7455448, E747529). The mineralogy comprises olivine, pyroxene, plagioclase and hornblende, with minor biotite, chlorite, sericite and magnetite. Zircons occur as an accessory phase and show a transparent euhedral shape with abundant fractures. The majority of zircons show subhedral to anhedral shapes. The crystal size varies over the range 50–250 µm. At least two different groups are present. The first group is characterized by irregular, equant shapes, very little of pyramidal perfection, broken to some degree, weakly oscillatory zoned, with aspect ratios of 1:2, and slightly darker in colour than the second type (Fig. 3b (2a, 2b, 3)). The zircons of the second group are clear and transparent when seen in transmitted light, and have a better developed oscillatory and magmatic zoning (Fig. 3b (1, 4)). Late overgrowths and heterogeneity within some crystals are observed (Fig. 3b (2a, 2b)).
(a) 1, Outcrop image of the layered gabbroic rock from the central part of the Vassaravaara intrusive complex. The white dashed lines indicate the primary magmatic layering. 2, Hand specimen from the Vassaravaara complex. (b) CL and BSE images of zircon crystals. 1, CL image of the zircon crystals, n5262-35_1 showing spot location placed within the centre of an oscillatory zoned crystal yielding a 207Pb–206Pb age of 1809 Ma. 2a, b, BSE and CL image of crystal n5262-35_2 showing irregular domains giving a heterogeneous character to the crystal and with an apparent overgrowth rim. A spot in a bright area (CL) yielded a 207Pb–206Pb age of 1804 Ma. 3, BSE image of more equant shape crystal with heterogeneous dark and bright zones and an overgrowth rim distinguished by weak contrast in the image. 4, Crystal with oscillatory zoned core apparently overgrown by homogenous outer rims, yielding a 207Pb–206Pb age of 1793 Ma. The second analyses in that crystal hit a metamict area which lost Pb. (c) Reverse concordia (Tera–Wasserburg) diagram with ellipses of all analysed crystals. (d) Concordia age calculation for sample 10-ZS-13 (n = 26; grey ellipses are not included in age calculation). (e) Calculated 207Pb–206Pb weighted average age with the 2σ level of confidence for the same set of analyses as in (d).

In total, more than 100 crystals were mounted. Thirty-two spots were analysed in 27 crystals, with two spots in 5 grains suspected for core–rim relationships (Table 2). CL and BSE images reveal zones with varying dark and bright zones.
Ion-microprobe U–Th–Pb data for zircons from Vassaravaara layered complex. Data in grey shading omitted from age calculations. Acronyms in column 2 and footnotes as for Table 1.

Results from both groups returned similar ages with no distinct differences; both groups are therefore considered to reflect the same crystallization event. No further distinctions between groups were made during age calculation. The dark and bright zones from BSE images from both groups also returned similar results.
Both the concordia age (Tera–Wasserburg) and the 207Pb–206Pb weighted average age using concordant analyses (n = 26) were calculated yielding 1798±4 Ma (MSWD of concordance+equivalence = 1.1) and 1804±2 Ma (MSWD = 1.0), respectively (Fig. 3c–e). The 207Pb–206Pb weighted average age overlaps well with the concordia age. All calculated ages therefore overlap within uncertainty, and the concordia age may be taken to represent the crystallization age of the rock. The 207Pb–206Pb ages range over 1819–1790 Ma, apart from four spots from four crystals giving highly discordant 207Pb–206Pb ages that are much younger (Table 2). These young 207Pb–206Pb ages are obtained due to the placement of spots either on fractures or metamict zones (e.g. Fig. 3b (4)).
4.c. Aitik granite
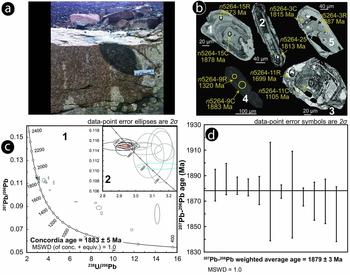
The Aitik granite is a pale pinkish, medium- to coarse-grained granite body cropping out SW of the Aitik mine. The granite shows a foliation and contains rounded to sub-rounded mafic enclaves (Fig. 4a). One sample for radiometric dating was collected close to the Aitik concentration plant (sample 3 in Fig. 1; SWEREF99: N7448672, E757120). The mineralogy comprises 50% K-feldspar, 20% albitic plagioclase, 25% quartz and 5% biotite, with minor chlorite, titanite, zircon and magnetite. Zircon crystals vary in size, appearance and shape, ranging from thin and small crystals with well-developed prismatic pyramidal phases, looking mainly bright and clear under the optical microscope, to thicker and larger in size with sub-rounded shapes, appearing as dull and unclear.
(a) Outcrop image of the moderately but clearly foliated Aitik granite with oval-shaped mafic xenoliths. (b) CL and BSE images of zircon crystals. 1, BSE image of an oscillatory-zoned crystal yielding ages close to the calculated crystallization age of the intrusive. 2, Oscillatory zoned crystal with length:width ratio that differs from the crystal in 1. 3, Equant-shaped zircon crystal with oscillatory zoning. The crystal is strongly fractured and metamict and has lost the lead, as shown by the discordant analyses. 4, CL image of zircon crystal with oscillatory zoning as shown by distinct bright and dark domains. Some of these zones are metamict and have lost Pb, giving low 207Pb–206Pb ages. (c) 1, 2, Reverse concordia (Tera–Wasserburg) diagram and concordia age calculation for sample 368-ZS-14 (grey ellipses are not included in age calculation). The turquoise near-concordant ellipse indicates a metamorphic overprint at c. 1815 Ma (b, 5). (d) Calculated 207Pb–206Pb weighted average age with the 2σ level of confidence for the same set of analyses as in (c).

The colour of the zircon crystals is light with a purple tint and the crystals are clear with not many signs of metamict patterns. However, BSE and CL images reveal strong fracture networks within the crystals and zones with complex overgrowth pattern, as well as a clear oscillatory zoning within few crystals (Fig. 4b (1–4)). In total more than 100 crystals were mounted, whereas 23 crystals were analysed with a total of 34 spots (Table 3).
Ion-microprobe U–Th–Pb data for zircons from Aitik granite. Data in grey shading omitted from age calculations. Acronyms in column 2 and footnotes as for Table 1.

A concordant (Tera–Wasserburg) age yielded 1883±5 Ma (MSWD of concordance+equivalence = 1.0, n = 8; Fig. 4c (1, 2)), mainly based on spots from BSE bright and undisturbed zones from crystals with clear oscillatory zoning (Fig. 4b). A 207Pb–206Pb average age of 1879±3 Ma (MSWD = 1.0, n = 12) overlaps that of the concordia age (Fig. 4d). Most of the remaining spots have lost lead and are strongly discordant; they have typically hit metamict zones (Fig. 4b (3)). However, one spot is near-concordant at a 207Pb–206Pb age of 1815 Ma (Fig. 4b (5), c).
4.d. Naalojärvi granite
The Naalojärvi granite chosen for radiometric dating in this study outcrops c. 3 km north of the Malmberget deposit (sample 4 in Fig. 1; SWEREF99: N7466520, E742149). The granite has a distinct pink colour, is medium- to coarse-grained and comprises 40% quartz, 15% plagioclase, 40% K-feldspar and <4% biotite, with accessory zircon, titanite and minor opaque phases (Fig. 5a). On outcrop scale no visible deformation was observed; however, a weak alignment of minerals can be observed at the microscopic scale.
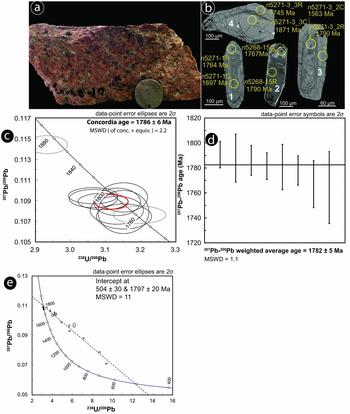
(a) Hand specimen of the Naalojärvi granite with distinct pink colour. (b) CL and BSE images of zircon crystals. 1, Oscillatory zoned well-developed crystal with overgrowth domains clearly overprinting the primary zoning. Both spots on this crystal give younger ages mainly due to spots hitting fractures and/or metamict zones. 2, CL image of crystal with homogeneous bright and dark domains giving slightly varying ages. A late overgrowth rim along the margin appearing bright within the image can be distinguished. 3, Large zircon crystal with abundant fractures, oscillatory zoned core and later homogenous overgrowth rim that give similar age as crystal 2. The younger 207Pb–206Pb age from the interior of the crystal is likely due to spot hitting a fractured/metamict zone. Spot location indicated by yellow circles. 4, BSE image of zircon crystals with an inherited core of much older 207Pb–206Pb age surrounded by much younger overgrowth rim. (c) Reverse concordia (Tera–Wasserburg) diagram and concordia age calculation based on the most concordant analysis (n = 8). (d) Calculated 207Pb–206Pb weighted average age for the same set of analyses as in (c), apart from ellipsoid plotting near 1880 Ma. (e) Graph with all analysed spots and regression line indicating an upper intercept age close to 1780 Ma. Note the small near-concordant ellipse in red that represents the inherited core.

The zircon content within this rock type is high and most of the crystals are euhedral with well-developed pyramidal edges. Typical aspect ratios are 1:3, but shorter and more elongated crystals are also observed. Most of the crystals are clear transparent with a pinkish tint. Crystals that were brownish turbid and metamict, as well as those having abundant fracturing, were avoided as much as possible during the hand-picking procedure. Most of the crystals show oscillatory zonation in BSE and CL images. Crystals with metamict zones that suffered Pb loss could not be fully avoided during analyses. A few apparent inherited cores were encountered (Fig. 5b).
In total 15 crystals were analysed with 24 spots, and 9 crystals were analysed with 2 spots in order to check for core–rim (dark/light area) relationships (Table 4). Apparent cores showed mostly similar ages as rims (n5268-15c, Fig. 5b (2)); no further distinction was therefore made during age calculation. Results based on eight near-concordant crystals yielded a concordia age (Tera–Wasserburg) of 1786±6 Ma (MSWD of concordance+equivalence = 2.2, Fig. 5c). A similar result is obtained from a 207Pb–206Pb weighted average (1782±5 Ma; MSWD = 1.1) based on eight near-concordant analyses (Fig. 5d). One near-concordant core analysis shows a 207Pb–206Pb age of 1871±6 Ma (Fig. 5b (4), c, e). Regression through the dataset yields an upper intercept age of 1797±20 Ma (MWSD = 11) that is similar to the calculated concordia age and 207Pb–206Pb weighted average within error (Fig. 5e). All calculated ages overlap within uncertainty and, even though the MSWD values indicate excess scatter, this suggests a crystallization age of the granite close to 1780 Ma.
Ion-microprobe U-Th-Pb data for zircons from Naalojärvi granite. Data in grey shading omitted from age calculations. Acronyms in column 2 and footnotes as for Table 1.

4.e. Quartz-alkali feldspar syenites
This unit crops out at several localities within the Gällivare area including Sikträsk, Bergmästergruvan, and between the Vassaravaara and Dundret intrusive complexes (Figs 1, 6a). Characteristic for this unit is a medium grain size and a moderate foliation with a light pink colour caused by K-feldspar (microcline). The composition is dominated by 65% microcline, <8% quartz, 20% plagioclase with distinct albite twinning, 5% mica and <2% amphiboles, and accessory titanite, zircon, apatite and rutile. Two samples were collected for radiometric dating, one from the Sikträsk deposit and one from the Bergmästergruvan.
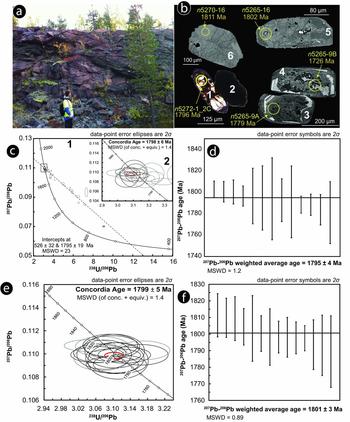
(a) Outcrop image of the Bergmästergruvan walls, no. 6 in Figure 1. (b) CL, BSE and optical (transmitted plane-polarized light) images of zircon crystals. 1, Optical image of bright and clear crystal with significant internal metamictization, from Bergmästergruvan. 2, More turbid crystals from Bergmästergruvan. 3, 4, CL images showing a patchy interior pattern of probable resorption-reprecipitation processes, surrounded by homogeneous late overgrowth rims, Bergmästergruvan. 5, BSE image showing patchy resorption-reprecipitation features as well as high fracture frequency, Bergmästergruvan. 6, BSE image of zircon crystal from Sikträsk with homogenous dark and bright zones and strong fracturing network. A thin overgrowth rim on the eastern margin of the crystal can be observed. (c) Reverse concordia (Tera–Wasserburg) diagram and concordia age calculation based on the seven oldest concordant analyses for sample 422-ZS-14, Bergmästergruvan, as well as regression through the whole dataset; grey ellipses are not included in the age calculation. (d) Calculated 207Pb–206Pb weighted average age with 2σ level of confidence for the thirteen oldest near-concordant analyses Bergmästergruvan. (e) Reverse concordia graph (Tera–Wasserburg) and concordia age calculation for thirteen near concordant analyses of sample 30-ZS-14, Sikträsk. (f) Calculated 207Pb–206Pb weighted average age with the 2σ level of confidence for all near-concordant analyses of the Sikträsk sample.

4.e.1. Bergmästergruvan
A sample for radiometric dating was collected from wall rocks of the Bergmästergruvan (sample 6 in Fig. 1; SWEREF99: N7461807, E741505). Zircons from the Bergmästergruvan are well developed with euhedral shapes and pyramidal faces and prisms. Most of the crystals were evenly grown with average crystal sizes of 250 µm and aspect ratios of 1:2 to 1:2.5. Clear, transparent, as well as cloudy turbid, crystals can be observed under the optical microscope (Fig. 6b (1, 2)). Most of the crystals exhibit significant resorption features and a few with distinct brownish colour show metamictization (Fig. 6b (1)). SEM and CL images revealed an even stronger fracturing within most crystals with a patchy mosaic texture of apparent dissolution–reprecipitation, mostly within the cloudy crystals (Fig. 6b (3–5)). The complex interior of the crystals often show embayments of apparent resorption followed by homogeneous overgrowths (Fig. 6b (3–5)).
In total 34 analyses were obtained from 31 crystals. A 207Pb–206Pb weighted average age based on the 13 oldest, near-concordant spots yielded 1795±4 Ma (MSWD = 1.2); a concordia age based on the 7 oldest concordant analyses from 4 clear crystals yields 1798±6 Ma (MSWD of concordance+equivalence = 1.4; Table 5; Fig. 6c (1, 2), d).
Ion-microprobe U–Th–Pb data for zircons from Bergmästergruvan. Data in grey shading omitted from age calculations. Acronyms in column 2 and footnotes as for Table 1.

4.e.2. Sikträsk
Zircon grains were concentrated from a 5 kg sample from a drill core (sample 5 in Fig. 1; SWEREF99: N7461328, E737589, DH ID: 81073 182–189 m). The collected grains generally exhibit well-developed pyramidal crystal faces with aspect ratios of c. 1:2.5; however, some rounded grains were present. Zircons occur as clear, transparent crystals with minor brownish regions, as well as turbid. Most of the crystals are however clear, with almost euhedral shapes and a light pinkish tint. The size ranges from 60 µm up to 250 µm. In the SEM and CL images, crystals show strong fracture networks with dark and light domains lacking distinct cores and rims. A thin overgrowth rim along the crystal margin can sometimes be observed (Fig. 6b (6)).
207Pb–206Pb ages range over 1780–1811 Ma apart from two crystals showing very young ages (Table 4). Based on 14 near-concordant analyses, a 207Pb–206Pb weighted average age yields 1801±3 Ma (MSWD = 0.89, Fig. 6f); a concordia age (Tera–Wasserburg) based on 13 near-concordant spots yields 1799±5 Ma (MSWD of concordance+equivalence = 1.4; Fig. 6e; Table 6).
Ion-microprobe U–Th–Pb data for zircons from Aitik dolerite. Acronyms in column 2 and footnotes as for Table 1.

4.f. Aitik dolerite
This unit occurs as a foliation-parallel intrusion within the volcano-sedimentary units in the hanging wall of the Aitik deposit and at other localities in the Gällivare area, including Dundret, east of the NDZ and north of the Vassaravaara complex. Characteristic for this rock unit is the distinct intergranular texture with a fine- to medium-grained matrix composed of mainly amphibole and plagioclase, with large plagioclase laths varying in size over the range 2–5 mm (Fig. 7a). The sampled unit is from the hanging wall of the Salmijärvi open pit, a satellite deposit immediately south of the Aitik open pit (sample 7 in Fig. 1; SWEREF99: N7449156, E759915).
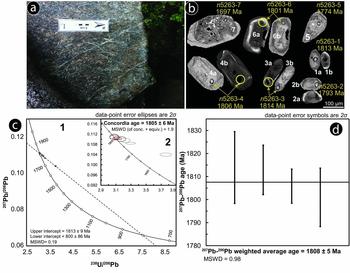
(a) Outcrop image of the Aitik type dolerite with characteristic ophitic texture. (b) BSE and CL images of all collected zircon crystals. 1–3, relatively small crystals with distinct oscillatory-zoned cores and overgrowth rims. These crystals exhibit less fracturing compared to the larger crystals and give older 207Pb–206Pb ages that are close to calculated crystallization age of the unit. 4–6, These zircon crystals show three apparent growth zones: CL images reveal an inner core that is rimmed by the much brighter domain, that in turn is rimmed by slightly darker zone. 7, Grain with strongly fractured and probably partly metamict core, with rather homogenous outer rims. Spot locations in few crystals marked by yellow dashed circles. (c) 1, 2, Reverse concordia (Tera–Wasserburg) diagram and concordia age calculation, based on the four concordant analyses of sample 282-ZS-13, as well as a regressed discordia line through the whole dataset with upper and lower intercepts. Grey ellipses are not included in the concordia age calculation. (d) Calculated 207Pb–206Pb weighted average age of the four most near-concordant analyses with the 2σ level of confidence for the same sample as in (c).

Approximately 20 kg was sampled for radiometric dating. Due to a very low concentration of zircons, only seven grains were recovered and analysed. Crystals varied in size from 75 to 250 µm. The zircons are predominantly euhedral in shape with well-developed prisms and distinct pyramidal faces reaching an aspect ratio of 1:2. Four crystals with a small grain size are clear and transparent with minor fractures, while the remaining three crystals are large, cloudy, turbid and dark with a brownish tint when observed under optical microscope. BSE and CL images reveal strongly fractured and partly metamict cores, with apparent resorption and homogenous overgrowth (Fig. 7b (4–7)). A clear overgrowth rim and weak oscillatory zoning can be observed within all crystals (Fig. 7b).
A concordia age (Tera–Wasserburg) based on the four concordant spots yielded 1805±6 Ma (MSWD of concordance+equivalence = 1.9; Fig. 7c (2)) and a 207Pb–206Pb weighted average age based on four analytical spots yields 1808±5 Ma (MSWD = 0.98; Fig. 7d). Regression through the whole dataset yielded an upper and lower intercept age of 1813±9 Ma and 800±86 Ma, respectively (Fig. 7c (1)). 207Pb–206Pb ages of the near-concordant analyses range over 1793–1814 Ma (Table 7). One strongly discordant analysis was placed in a strongly fractured and probably partly metamict area (n5263-7). Spot location on crystal n5263-6 is placed on a fracture zone and the ellipse is just touching the concordia line showing lower 207Pb–206Pb ratios (Fig. 7c (2)). However, the ellipsoid is within the uncertainty margin for calculating concordia age; the concordia age might therefore be somewhat biased towards a too-low age. Two concordant, clear and transparent euhedral crystals (n5263-1 and n5263-3) give 207Pb–206Pb ages that overlap well with the upper intercept age from the regression (Table 7, Fig. 7c (1)). The regression age can therefore be taken to represent the true crystallization age of the rock unit. The remaining analyses give lower 207Pb–206Pb ages and show discordance, suggesting lead loss.
Ion-microprobe U–Th–Pb data for zircons from Sikträsk deposit. Data in grey shading omitted from age calculations. Acronyms in column 2 and footnotes as for Table 1.

4.g. Nautanen diorite
The Nautanen diorite is located immediately west of the NDZ (sample 8 in Fig. 1; SWEREF99: N7464933, E751876 E). The rock has a dark greenish-grey colour, is fine- to medium-grained, and shows macroscopically a weak tectonic foliation (Fig. 8a). The mineralogy comprises quartz, plagioclase, hornblende and biotite, with accessory titanite, zircon and minor opaque phases. A 20 kg sample was collected for radiometric dating and 37 zircon crystals in total were extracted and mounted for SIMS analysis.
(a) Hand specimen image of the Nautanen diorite. (b) Zircon images. 1, CL image showing at least two secondary features, with a homogenous dark core that has been affected by later fluids forming channels within the crystals. A late overgrowth rims parts of the grain, as well as stretching towards the centre (white). Leaching and resorption phenomena are common within the sample. 2, BSE image showing an oscillatory zoned core that is strongly metamict, probably leached, which has lost lead, covered by a homogenous rim. Spot locations indicated by yellow circles. (c) Regressed black dashed line through part of the dataset gives an upper intercept age that is interpreted to represent the crystallization age of the rock. The red regressed dashed line gives an upper intercept that represents a metamorphic age. Grey ellipses deviating from the discordia are omitted from age calculations.

Most of the crystals exhibit subhedral to anhedral shapes with poorly developed crystal faces, strong fracturing and metamictization. Due to the scarcity of zircons, the possibility of selecting suitable grains for SIMS analysis was limited and located grains were all mounted after hand picking. CL and BSE images revealed strongly heterogeneous crystals with well-developed resorption/leaching (metamict) and overgrowth features (Fig. 8b). At least three different shades from the CL image (Fig. 8b (1)) can be distinguished: dark homogenous zones; bright zones along the fractures; and late white/bright overgrowth zones along fractures but mainly as an outer rim. The crystal in Figure 8b (2) shows a strongly altered/metamict core with an unaltered, relatively homogeneous outer rim.
Based on the nature of obtained data, a discordia regressed through part of the dataset yields an upper intercept age of 1870±12 Ma (MSWD = 0.26, n = 6; Table 8, Fig. 8c).
Ion-microprobe U–Th–Pb data for zircons from Nautanen diorite. Data in grey shading omitted from age calculations. Acronyms in column 2 and footnotes as for Table 1.

Several crystals defining a younger group, where the analysed spot from the crystal n5266-7 plots just on concordia with a 207Pb–206Pb age of 1792±5 Ma and the remaining crystals discordantly on the discordia, giving an upper intercept age of 1781±10 Ma (MSWD = 0.90, n = 7; Fig. 8c).
5. Discussion
5.a. Interpretations and implications of the data for each sample
The morphology and shape of the zircon population from the Dundret layered complex is typical for deep-seated, slowly cooled rocks, with common stubby and equant shapes and small aspect ratios (e.g. Corfu et al. Reference Corfu, Hanchar, Hoskin and Kinny2003). The U–Pb data are quite uniform, near-concordant and yield ages close to 1880 Ma. If the 207Pb–206Pb weighted average of the most concordant analyses is preferred, the Dundret gabbro was emplaced at 1880±3 Ma. On the other hand, concordant ages from the dark zones of the crystals yield emplacement at 1883±5 Ma (Fig. 2c, d). Ages obtained from both methods overlap within the given error margin. However, we suggest the concordia age to truly represent the crystallization age of the intrusive unit.
Three analyses (n5261-2_2, n5261-5 and n5261-6_1R; Table 1, Fig. 2b (1)) from the bright zones yielded well-constrained 207Pb–206Pb ages in the interval 1770–1787 Ma, suggesting overprint(s) during this time frame.
Even though individual 207Pb–206Pb ages of the Vassaravaara intrusive complex range over 1.79–1.82 Ga, no correlation with texture was observed and the igneous crystallization age can be approximated by the concordia age at 1798±4 Ma, that is, 80 Ma younger than the Dundret gabbro. The inhomogeneity among the measured ages may result from the reworking of the rock shortly after crystallization.
The Aitik granite crystallized near 1880 Ma ago, although the data is scattered. The scatter may be attributed to later overprints that have strongly affected the zircons (cf. Fig. 4b). However, eight concordant analyses from undisturbed zones yield a concordant age of 1883±5 Ma that can be taken to represent the true crystallization age of the granite. The disturbed pattern as seen in Figure 4b clearly indicates hydrothermal effects on these crystals. At least one fairly well-constrained analysis suggests an overprint near 1815 Ma (Fig. 4b (5), c (2)).
The crystallization of the Naalojärvi granite occurred close to 1780 Ma. There is a range in ages for near-concordant analyses of 1757–1790 Ma, not fully overlapping within error. Textural evidence suggests that early-formed parts of crystals have become corroded and overgrown by only insignificantly younger zones (cf. Fig. 5b). The eight near-concordant crystals yield a 207Pb–206Pb weighted average age of 1782±5 Ma that is suggested to most closely represent the original crystallization age of the granite. One irregular to sub-rounded shaped, weakly discordant crystal (n5271-3_3C, Table 4, Fig. 5b (4)) with a 207Pb–206Pb age of 1871 Ma, is suggested to represent an inherited crystal apparently from an early Svecofennian source. The remaining zircons show strong discordance and Pb loss. The trend of the discordance shows scatter that may represent several episodes of lead loss in the range 800–400 Ma ago (Fig. 5e). Although the rock unit does not show visible alteration or obvious deformation on outcrop scale, the lead loss pattern indicates the action of low-temperature fluids a long time after crystallization.
The concordant and near-concordant analyses from the Bergmästergruvan and Sikträsk syenites range over 1.77–1.80 and 1.78–1.81 Ga, respectively, not all overlapping within error (Fig. 6c, e). Zircon crystals from both rocks show extensive signs of alteration, resorption and overgrowths (cf. Fig. 6b). No significantly younger crystal parts have been detected, and analysis of various textural parts suggests that reworking occurred shortly after crystallization, that is, approximately at or after 1.77 Ga. The original igneous crystallization of the rocks can be estimated by the weighted 207Pb–206Pb ages of the oldest concordant analyses at 1795±4 Ma and 1801±3 Ma, respectively. The scattered discordance pattern also signals the action of a low-temperature fluid long after crystallization.
The zircons of the Aitik dolerite are fairly uniform and the discordia age of 1813±9 Ma gives the best estimate of its intrusion age, close to that of the Vassaravaara complex. Late overgrowths yet remain to be analysed (Fig. 7b). This suggests that the magmatic activity around 1.80 Ga not only generated major gabbroic intrusive units such as the Vassaravaara complex, but is also responsible for the emplacement of abundant dykes and sills with the basic composition in the entire Gällivare area.
The zircons of the Nautanen diorite show complex resorption-overgrowth features (cf. Fig. 8b). The discordia through the oldest group of analyses yields an intercept of 1870±12 Ma, interpreted to give the best estimate of igneous crystallization. A group analysis defining a discordia line with an intercept at 1781±10 Ma approximates the age of zircon overgrowth.
5.b. Regional and general implications
Geochronological results from the Gällivare area fall within the two major magmatic episodes generally defined for the Svecofennian, including the Norrbotten region (1.90–1.86 Ga and 1.83–1.77 Ga) (e.g. Skiöld, Reference Skiöld1988; Bergman, Kübler & Martinsson, Reference Bergman, Kübler and Martinsson2001). However, not all of the ages within these groups overlap within error, so the data allows the interpretation that there may be two pulses of magmatism at 1.88 and 1.87 Ga, as well as at 1.80 and 1.78 Ga, in the Gällivare area. In contrast, age determinations for a range of volcanic and intrusive rocks, and ores, in the Kiruna area overlap within the age range 1.87–1.89 Ga (Romer, Martinsson & Perdahl, Reference Romer, Martinsson and Perdahl1994; Westhues et al. Reference Westhues, Hanchar, Whitehouse and Martinsson2016). The significance of this separation will be tested in the light of additional data to determine whether we are dealing with a prolonged continuous episode of magmatism or distinct pulses. Additionally, it is important to note that both the early Svecofennian and the late Svecofennian magmatism comprise major mafic–ultramafic components, something which was previously unknown. Results obtained from this study are among the first modern age determinations of major mafic intrusions such as the Dundret and Vassaravaara in northern Norrbotten. Until now, only a few rocks with mafic composition have been subjected to radiometric dating using U–Pb on zircons in northern Norrbotten, including albite-diabases, a mafic-enclave from the Rombak window, few meta-diorites and a monzonite (Skiöld, Reference Skiöld1981, Reference Skiöld1986; Romer & Wright, Reference Romer and Wright1992; Martinsson, Vaasjoki & Persson, Reference Martinsson, Vaasjoki, Persson and Bergman1999; Bergman, Kübler & Martinsson, Reference Bergman, Kübler and Martinsson2001).
The crystallization age of the of the Dundret layered complex at 1883±5 Ma, as well as the Aitik granite at 1883±5 Ma and Aitik quartz monzodiorite at 1887±8 Ma (Wanhainen, Billström & Martinsson, Reference Wanhainen, Billström and Martinsson2006), all overlap within error.
The Dundret complex exhibits well-defined primary magmatic layering (Fig. 2a), a peridotitic portion, and is undeformed within the central part with weak strain alignment at the margins. Large undeformed gabbroic complexes with a well-developed primary magmatic layered character (a peridotitic portion) with similar mineralogy have been reported from several localities in northern Norrbotten, including the Runkanjunnje complex (N7551318, E689416, coordinates in Swedish national grid Swereff 99 Tm; Martinsson, Vaasjoki & Persson, Reference Martinsson, Vaasjoki, Persson and Bergman1999). Geochronological data from these gabbroic complexes in the northern Norrbotten is scarce. Very few studies have been carried out, and any results have returned ages with low precision. The U–Pb age at 1868±55 Ma for the Runkanjunnje complex is considered imprecise due to large scatter and discordance within the returned analytical data (Martinsson, Vaasjoki & Persson, Reference Martinsson, Vaasjoki, Persson and Bergman1999); however, petrological similarities to the Dundret gabbro are evident. Rocks of similar characteristics and age are emplaced within the PMS suite (Billström et al. Reference Billström, Broman, Eilu, Martinsson, Niranen, Ojala, Wanhainen, Weihed and Porter2010). An intraplate setting for the PMS suite is suggested by Martinsson (Reference Martinsson2004), Billström et al. (Reference Billström, Broman, Eilu, Martinsson, Niranen, Ojala, Wanhainen, Weihed and Porter2010) and Martinsson et al. (Reference Martinsson, Billström, Broman, Weihed and Wanhainen2016). Recent data (Sarlus, Reference Sarlus2016) suggest that the Dundret layered complex has a mixed character of tholeiitic and calc-alkaline affinity and an extensional subduction-related setting, that is, a back-arc environment. This scenario coincides well with an extension of a mature continental arc (Martinsson, Reference Martinsson2004; Martinsson et al. Reference Martinsson, Billström, Broman, Weihed and Wanhainen2016).
Most of the granitoids in the Gällivare area have been considered to belong to the Lina suite of granite-pegmatite associations (1.78–1.81 Ga; Bergman, Kübler & Martinsson, Reference Bergman, Kübler and Martinsson2001). The crystallization age of 1883±5 Ma (Fig. 4c) for the granite SW of the Aitik mine is clearly older than granites of Line-type suite. Instead, the observed emplacement ages fall close to that of the Haparanda (1.86–1.89 Ga) and PMS suites (1.86–1.88 Ga, Bergman, Kübler & Martinsson, Reference Bergman, Kübler and Martinsson2001). Chemical data (Sarlus, Reference Sarlus2016) do not allow the Aitik granite to be placed strictly within one of these groups. This variation in geochemistry but overlap in age ranges suggests the involvement of a range of sources, and possibly shifting tectonic regimes, for the granitoid magmatism at 1.89–1.86 Ga.
The c. 1.8 Ga magmatic event in the Gällivare area also led to the generation of both mafic and felsic rocks. The emplacement age of the Vassaravaara intrusive complex (1798±4 Ma) is almost coeval with that of the ophitic dolerite in Aitik (1813±9 Ma), and extends the number of known mafic intrusions in (northernmost) Sweden at c. 1.8 Ga. The geochemical calc-alkaline character with a subduction-related affinity of the Vassaravaara intrusive complex and Aitik dolerite overlaps with that of other 1.8 Ga mafic to intermediate rocks in northern Norrbotten (Martinsson, Reference Martinsson2004; Sarlus, Reference Sarlus2016). It also fits well geochemically with mafic rocks belonging to the Transscandinavian Igneous Belt (TIB) that occupies large areas stretching from the southeastern Sweden all the way to northern Norway (Weihed et al. Reference Weihed, Billström, Persson and Weihed2002; Andersson et al. Reference Andersson, Eklund, Claeson, Högdahl, Andersson and Eklund2004a, Reference Andersson, Rutanen, Johansson, Mansfeld and Rimša2007; Rutanen & Andersson, Reference Rutanen and Andersson2009; Sarlus, Reference Sarlus2016).
The constrained age of the Vassaravaara complex and dolerite at Aitik fall in close range to the regional hydrothermal iron oxide-copper-gold (IOCG) overprint at 1.80–1.75 Ga proposed by Wanhainen et al. (Reference Wanhainen, Billström, Martinsson, Stein and Nordin2005, Reference Wanhainen, Broman, Martinsson and Magnor2012). Voluminous mafic intrusions provide an excellent heat source for driving and circulating hydrothermal systems, as well as adding magmatic fluids to the system (e.g. Hitzman, Oreskes & Einaudi, Reference Hitzman, Oreskes and Einaudi1992; Barton & Johnson, Reference Barton, Johnson and Porter2000). According to Wanhainen et al. (Reference Wanhainen, Broman, Martinsson and Magnor2012), aqueous fluids responsible for the IOCG-mineralization and extensive Na–Ca alteration in the region at <1.8 Ga also affected the Aitik rocks, possibly leading to the redistribution and addition of copper ± gold.
The crystallization age for the Naalojärvi granite of 1782±5 Ma (Fig. 5c) lies in the range of the Lina granite suite (1780–1810 Ma: Bergman, Kübler & Martinsson, Reference Bergman, Kübler and Martinsson2001). Chemical expression of the Naalojärvi granite with 73% silica and high Rb and Th content (Sarlus, Reference Sarlus2016, table 2, fig. 7b) fits well with the results reported for the Lina-type granites in Bergman, Kübler & Martinsson (Reference Bergman, Kübler and Martinsson2001).
The crystallization ages for syenites from Bergmästergruvan and Sikträsk at 1795 Ma and 1801 Ma, respectively (Fig. 6d, f), are interpreted to result from the same tectonomagmatic event as the Naalojärvi/Lina granites, but are suggested to be similar to granite-syenitoid-gabbroid association of Norrbotten (1780–1800 Ma; Öhlander & Skiöld, Reference Öhlander and Skiöld1994; Bergman, Kübler & Martinsson, Reference Bergman, Kübler and Martinsson2001). Syenitoids were therefore generated from other sources and presumably processes distinct from those generating the Lina granites, but penecontemporaneously and together with mafic magmatism at c. 1.8 Ga in the Norrbotten region. Syenite from the same group within the same age interval (1792–1799 Ma) has been reported from SW of Kiruna (Romer, Martinsson & Perdahl, Reference Romer, Martinsson and Perdahl1994).
There is not enough evidence at the current stage to suggest a co-magmatic origin for ultramafic, mafic and felsic rocks in the Gällivare area. However, mafic enclaves within the Aitik granite (Fig. 4a) suggest an interaction between mafic and felsic magmas at 1.88 Ga (e.g. Andersson, Reference Andersson1991). This interaction of mafic and felsic magmas within rock suites generated during the first magmatic episode close to 1.90 Ga in northern Norrbotten is frequently manifested by typical rounded mafic–intermediate enclaves (Kathol & Martinsson Reference Kathol and Martinsson1999; Bergman, Kübler & Martinsson, Reference Bergman, Kübler and Martinsson2001).
The two generations of coeval mafic–felsic intrusions, and mingling features in at least the first of these, imply major input of mafic, mantle-derived magmas into the crust in at least two stages, similarly to what has been documented in southern Sweden (e.g. Andersson et al. Reference Andersson, Rutanen, Johansson, Mansfeld and Rimša2007; Rutanen & Andersson, Reference Rutanen and Andersson2009; Johansson, Andersson & Hålenius, Reference Johansson, Andersson and Hålenius2011; Johansson & Hålenius, Reference Johansson and Hålenius2013). Based on the increasing number of age-documented associated mafic intrusions, it is reasonable to assume that the voluminous crustal remelting, represented by the various granitoids, was driven by mafic underplating. The variation in character of the granitoids was determined by their source material, degree of melting and extent of physical mixing with the mantle-derived magmas, where felsic granites of the Lina suite (e.g. Naalojärvi) represent pure crustal melts, while more intermediate compositions may contain various proportions of mantle material (e.g. the Aitik quartz monzodiorite). Similar models have been entertained for TIB rocks in southern Sweden (Andersson, Reference Andersson1991, Reference Andersson, Ahl, Andersson, Lundqvist and Sundblad1997; Andersen et al. Reference Andersen, Andersson, Graham, Åberg and Simonsen2009).
6. Conclusions
Plutonic rocks from the Gällivare area have been subjected to zircon U–Pb secondary ion probe geochronology. Mafic and felsic plutonic rocks of both early (1890–1870 Ma) and late (1800–1780 Ma) Svecofennian age were identified. Within each of these, two pulses of magmatism may be geochronologically separated: at 1885–1880 Ma, 1875–1870 Ma, and 1800 and 1780 Ma.
The 1883±5 Ma for the Dundret ultramafic–mafic layered complex, the 1883±5 Ma for the Aitik granite overlaps with the known ranges for early Svecofennian rocks in the region. The latter contains mafic enclaves, lending additional support for coeval mafic–felsic magmatism. Further research is required to determine whether the 1875–1870 Ma event, manifested by the emplacement of the Nautanen diorite (1870±12 Ma), supported by late overgrowths from the Dundret zircons (1873±2 Ma) and single inherited zircon crystals from the Naalojärvi (1871±6 Ma), can be separated as a distinct magmatic pulse or a continuation of magmatism from 1880 Ma.
A younger generation of plutonic rocks (late Svecofennian) were identified as the 1798±4 Ma Vassaravaara mafic intrusive complex, the 1813±9 Ma Aitik dolerite, the 1795±4 Ma Bergmäster and 1801±3 Ma Sikträsk syenites and the 1782±5 Ma Naalojärvi granite, extending the known number of mafic magmatic rocks of this age in the region and supporting coeval mafic–felsic magmatism also at c. 1.80 Ga in the Gällivare area. The Bergmäster and Sikträsk syenites show similarities with the granite-syenitoid-gabbroid association of Bergman, Kübler & Martinsson (Reference Bergman, Kübler and Martinsson2001) and Boden-Edefors (Öhlander et al. Reference Öhlander, Skiöld, Elming, Claesson and Nisca1993), which is also associated with major amounts of mafic–intermediate rocks, while the Naalojärvi granite is a granite akin to the Lina types. This association of mafic and felsic intrusions in two generations suggests that grantoid-syenitoid magma formation is driven by underplating of mafic magmas and magma interaction, as has been reported from many arc areas worldwide, as well as in the Svecofennian and TIB.
Declaration of Interest
None.
Acknowledgements
We warmly thank Martin Whitehouse, Kerstin Lindén and Lev Ilyinsky from the NORDSIM laboratory for co-operation and help with the SIMS dating-related issues. The NORDSIM facility is financed and operated under an agreement between the research councils of Denmark, Norway and Sweden and the Swedish Museum of Natural History. This is NORDSIM publication #502. We thank the staff at LKAB, Malmberget for their support with providing drill-core samples and logistics. We wish to thank several colleagues at LTU including Glenn Bark for his support with SEM imaging and Alejandro Liero for gold coating, Bertil Pålsson and Desiree Nordmark for providing lab equipment, and Tobias Kampmann for his invaluable input in dealing with radiometric data, constructive discussions and reviewing of figures. This work was carried out within the project ‘Multi-scale 4-dimensional geological modeling of the Gällivare area’ financed by VINNOVA, Boliden and LKAB. The project is part of the SIO-program ‘Swedish Mining and Metal Producing Industry Research and Innovation Programme 2013–2016’.