Introduction
Bipolar disorder (BD) is associated with a range of well-described cognitive dysfunctions as detailed in an individual patient data meta-analysis of 2876 subjects, with deficits seen across all cognitive domains tested (Bourne et al., Reference Bourne, Aydemir, Balanza-Martinez, Bora, Brissos, Cavanagh, Clark, Cubukcuoglu, Dias, Dittmann, Ferrier, Fleck, Frangou, Gallagher, Jones, Kieseppa, Martinez-Aran, Melle, Moore, Mur, Pfennig, Raust, Senturk, Simonsen, Smith, Bio, Soeiro-de-Souza, Stoddart, Sundet, Szoke, Thompson, Torrent, Zalla, Craddock, Andreassen, Leboyer, Vieta, Bauer, Worhunsky, Tzagarakis, Rogers, Geddes and Goodwin2013). While cognitive dysfunction is modestly associated with a history of psychotic symptoms and mania, it is seen across all clinical sub-groups (Bora, Reference Bora2018), including in patients when euthymic (Thompson et al., Reference Thompson, Gallagher, Hughes, Watson, Gray, Ferrier and Young2005; Robinson et al., Reference Robinson, Thompson, Gallagher, Goswami, Young, Ferrier and Moore2006). There is little evidence of progression of dysfunction over time (Samame et al., Reference Samame, Martino and Strejilevich2014). The dysfunction may relate to underlying attentional and processing speed abnormalities (Gallagher et al., Reference Gallagher, Gray, Watson, Young and Ferrier2014). The attentional abnormalities include increased intra-individual variability (IIV) in response times in attentional tasks (Gallagher et al., Reference Gallagher, Nilsson, Finkelmeyer, Goshawk, Macritchie, Lloyd, Thompson, Porter, Young, Ferrier, McAllister-Williams and Watson2015). Sleep disruption, a common feature of all stages of BD, including euthymia (Harvey et al., Reference Harvey, Schmidt, Scarna, Semler and Goodwin2005), can also cause attentional abnormalities (Lim and Dinges, Reference Lim and Dinges2008). Again this is associated with an increased IIV, most commonly reported as an increase of ‘lapses’, or slow responses, in attentional tasks. Primary sleep disorders, such as sleep apnoea, also impact on attention and alertness (Bucks et al., Reference Bucks, Olaithe and Eastwood2013) and are underdiagnosed in BD (Soreca et al., Reference Soreca, Buttenfield, Hall and Kupfer2015). Prior studies assessing cognition in patients with BD have rarely objectively assessed sleep alongside cognition and at best have relied upon self-report (Giglio et al., Reference Giglio, Magalhaes, Kapczinski, Walz and Kapczinski2010; Kanady et al., Reference Kanady, Soehner, Klein and Harvey2017). There is a relative lack of correlation between objectively assessed and subjectively reported sleep abnormalities in BD (Harvey et al., Reference Harvey, Schmidt, Scarna, Semler and Goodwin2005; Bradley et al., Reference Bradley, Webb-Mitchell, Hazu, Slater, Middleton, Gallagher, McAllister-Williams and Anderson2017). Therefore, there is an important lack of data describing the association between objectively measured sleep abnormalities and cognitive function in BD. Previous work from this group objectively assessed sleep and circadian rhythm in detail in a well-characterised cohort of BD patients (Bradley et al., Reference Bradley, Webb-Mitchell, Hazu, Slater, Middleton, Gallagher, McAllister-Williams and Anderson2017). This revealed a range of sleep problems including obstructive sleep apnoea (OSA), circadian rhythm disturbance, hypersomnia and insomnia, with many patients having evidence of more than one of these disturbances. These objectively measured sleep disturbances were associated with impaired psychosocial functioning and quality of life. The aim of this study was to assess the relationship between objectively assessed sleep and cognitive function in BD patients. Specifically this study has compared cognition in BD patients with and without abnormal sleep to age- and sex-matched controls. Our hypothesis was that BD patients would demonstrate evidence of cognitive dysfunction and that this would be worse in, though not exclusive to, those patients with objectively verified sleep abnormalities.
Method
Participants
The study was approved by the National Research Ethics Committee North East – Newcastle & North Tyneside. Outpatients with BD type I or II, in any mood state, were recruited from a research database, patient support groups and NHS services in the North East of England. Healthy controls, matched by age and gender, were recruited from Newcastle University, local volunteer databases and hospital staff and their families. All participants provided written informed consent before taking part in the research. Participants were aged 18–65 years and fluent in English. Exclusion criteria were: any significant medical or neurological disorder that might interfere with sleep or cognition; current alcohol or substance misuse disorder [defined by DSM IV criteria (American Psychiatric Association, 1994)]; current shift work and previous significant head injury. A BD diagnosis meeting DSM-IV criteria was confirmed using the Mini International Neuropsychological Interview (MINI) (Sheehan et al., Reference Sheehan, Lecrubier, Sheehan, Amorim, Janavs, Weiller, Hergueta, Baker and Dunbar1998). Patients with BD were excluded if they had any changes to their psychotropic medication in the previous 4 weeks. Exclusion criteria for controls were: personal or first degree relative history of a DSM IV Axis I disorder as determined by clinical history; prescribed psychotropic medications and any known sleep disorder. Additionally controls had to be psychiatrically well, confirmed by MINI interview; have a 17-item Hamilton Depression Rating Scale score (HAMD-17) (Hamilton, Reference Hamilton1967) score <7; a Young Mania Rating Scale (YMRS) (Young et al., Reference Young, Biggs, Ziegler and Meyer1978) score <5; a Pittsburgh Sleep Quality Index (PSQI) (Buysse et al., Reference Buysse, Reynolds, Monk, Berman and Kupfer1989) score <5 and Epworth Sleepiness Scale (ESS) (Johns, Reference Johns1991) score <10.
Overall study design
The study was cross-sectional, with participants assessed over a 3-week period.
Psychiatric symptoms and sleep assessments
Participants were assessed on days 1 and 21. A comprehensive battery of questionnaires and rating scales were used to assess psychiatric symptoms. These included the 17-item GRID-HAMD (Williams et al., Reference Williams, Kobak, Bech, Engelhardt, Evans, Lipsitz, Olin, Pearson and Kalali2008), Beck Depression Inventory (BDI) (Beck et al., Reference Beck, Ward, Mendelson, Mock and Erbaugh1961) and YMRS (Young et al., Reference Young, Biggs, Ziegler and Meyer1978). All medications used by the patients in the BD group were recorded.
A single night of home partial polysomnography (Embla Systems, Bloomfield, New Jersey, USA) was used to screen for sleep apnoea. Respiratory events were scored according to the standard criteria of the American Association of Sleep Medicine (AASM) (Kushida et al., Reference Kushida, Littner, Morgenthaler, Alessi, Bailey, Coleman, Friedman, Hirshkowitz, Kapen, Kramer, Lee-Chiong, Loube, Owens, Pancer and Wise2005). An AHI of >5/h was considered abnormal and indicative of sleep apnoea. Severity was defined as mild (AHI 5–15), moderate (AHI 15–30) or severe (AHI >30). Participants also completed the Restless Legs Syndrome (RLS) Rating Scale to assess for the presence and severity of RLS (Walters et al., Reference Walters, LeBrocq, Dhar, Hening, Rosen, Allen and Trenkwalder2003). This scale includes 10 questions each scoring 0–4 with a score of 1–10 representing mild, 11–20 moderate, 21–30 severe and 31–40 very severe RLS.
For objective assessment of sleep/wake cycle (circadian rhythm), subjects wore a triaxial wrist accelerometer (GENEActiv; Activinsights, UK) on their non-dominant wrist for all 21 days of the study alongside completing a daily sleep log. The analysis of these data has been previously described (Bradley et al., Reference Bradley, Webb-Mitchell, Hazu, Slater, Middleton, Gallagher, McAllister-Williams and Anderson2017). In brief, the accelerometer data were analysed using an open source R package sleep detection algorithm, GGIR, which has demonstrated a high sensitivity and specificity to detect periods of sleep (van Hees et al., Reference van Hees, Sabia, Anderson, Denton, Oliver, Catt, Abell, Kivimaki, Trenell and Singh-Manoux2015). Sleep onset time, sleep offset time, TST, time in bed (TIB), sleep efficiency (defined as TST/TIB) and mean 24 h sleep duration (defined as nocturnal sleep plus daytime naps) were all derived. Correlation analysis was performed to check agreement between sleep logs and accelerometer-derived sleep variables. The relative amplitude between day and night activity was calculated during the least active 5 h (L5) and most active 10 h (M10) periods according to previously published methods (Van Someren et al., Reference Van Someren, Swaab, Colenda, Cohen, McCall and Rosenquist1999). Participants were then identified as normal sleepers (6–10 h sleep within 24 h with a regular sleep wake cycle), short sleepers (<6 h nocturnal sleep), long sleep [>10 h sleep within 24 h (Kaplan et al., Reference Kaplan, Gruber, Eidelman, Talbot and Harvey2011)] and circadian rhythm disturbance, including a delayed sleep phase (habitual sleep onset after 2:00 am), advanced sleep phase, irregular sleep wake pattern (three to four periods of sleep but no consolidated overnight period) or non-24 h pattern in keeping with the definitions within the International Classification of Sleep Disorder – Third edition (ICSD-3) (American Academy of Sleep Medicine, 2014). Patient-reported sleep logs were used to assist in the interpretation of actigraphy data.
Cognitive assessment battery
Verbal IQ was assessed with the National Adult Reading Test (NART) (Nelson, Reference Nelson1982) and then a range of tasks were administered to assess psychomotor speed, attention and executive components of cognition. This comprised of the Psychomotor Vigilance Test (PVT) (Dinges and Powell, Reference Dinges and Powell1985), the Attention Network Test (ANT) (Fan et al., Reference Fan, McCandliss, Sommer, Raz and Posner2002) and the Digit Symbol Substitution Test (DSST) (Wechsler, Reference Wechsler1981). Participants completed two DSSTs one at the beginning and one at the end of the cognitive testing session to assess for any change in performance across the session. Reaction time (RT) data from the PVT and the ANT were fitted to an ex-Gaussian distribution (a mathematical convolution of the Gaussian normal and exponential distribution). The ex-Gaussian has been shown to approximate well to empirical RT distributions (Schmiedek et al., Reference Schmiedek, Oberauer, Wilhelm, Suss and Wittmann2007); this distribution model produces three parameters: μ and σ, the mean and standard deviation of the Gaussian component; and τ, which defines the exponential component and represents the ‘slow-tail’ of the distribution (Ratcliff, Reference Ratcliff1979). To derive these measures, ex-Gaussian probability density functions were fitted to the distribution of valid response times of each individual using the DISTRIB toolbox (Lacouture and Cousineau, Reference Lacouture and Cousineau2008) in MATLAB® v.R2010b (The MathWorks Inc. Natick, MA, USA).
The Newcastle Spatial Working Memory (NSWM) Test (Pariante et al., Reference Pariante, Alhaj, Arulnathan, Gallager, Hanson, Massey and McAllister-Williams2012), a test of verbal learning, TRAILS A and B and digit span test (Lezak et al., Reference Lezak, Howieson and Loring2004) were also performed. Tests were performed at the same time of day for controls and BD patients at the end of the sleep assessment period.
Statistical analysis
All statistical analyses were performed using IBM SPSS statistical package version 22. Data are reported as means with standard deviations. Normality of distribution of data was tested using the Shapiro–Wilk test. Log10 or square root transformations were used where necessary to normalise the data. Parametric tests (e.g. t test) were used unless the data remained non-normally distributed despite transformation when equivalent non-parametric tests (e.g. Mann–Whitney U test) were used. In the comparisons between controls and BD patients, age and NART IQ score were examined as possible confounders. If there was a significant correlation of the outcome measure under investigation and either of these variables, then analysis of covariance (ANCOVA) was performed. Mood was not examined in this way due to this being significantly different between controls and BD patients. Rather sub-group analysis was performed taking advantage of those BD patients who were euthymic. A score of <8 on the BDI was used to define ‘euthymia’ (Keller, Reference Keller2003). Note that all bipolar patients met euthymia criteria (YMRS < 10) with regards to manic symptoms. Overall, there was a strong correlation between HAMD-17 and BDI scores [r (s)(45) = 0.831, p < 0.001]. The BDI was used in preference to the HAMD-17 due to it containing only one sleep variable, rather than the three within the HAMD-17. A significance threshold of p < 0.05 was used for all analyses.
Results
Participants
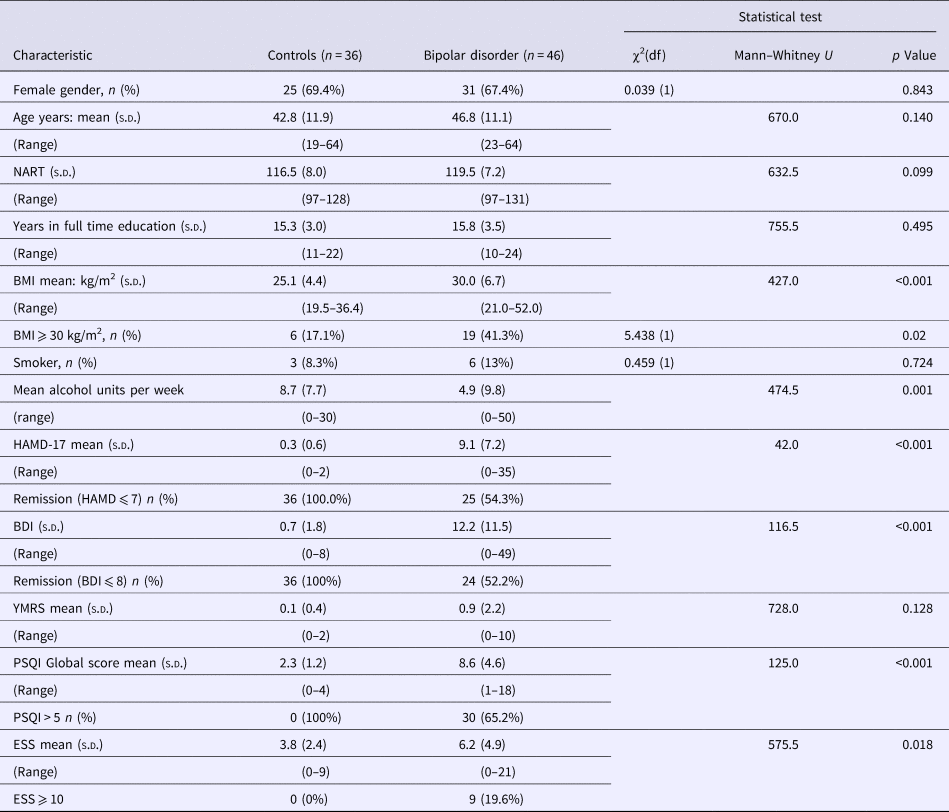
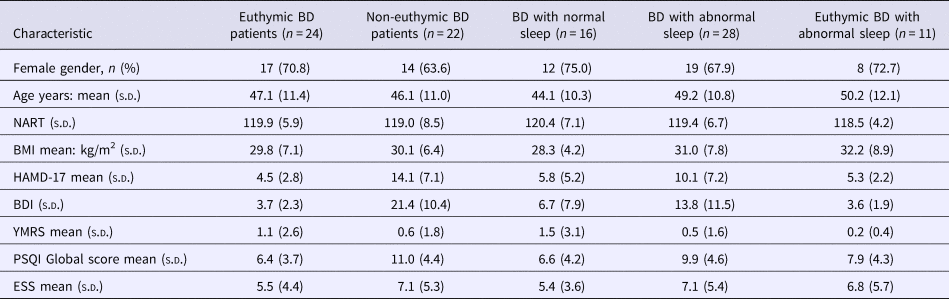
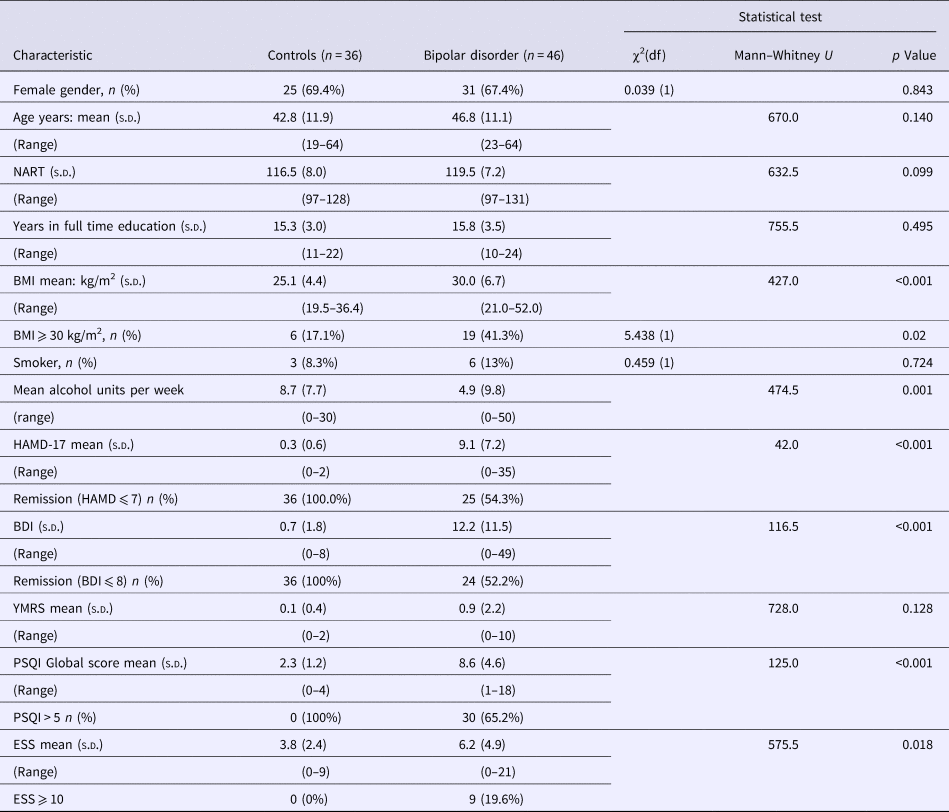
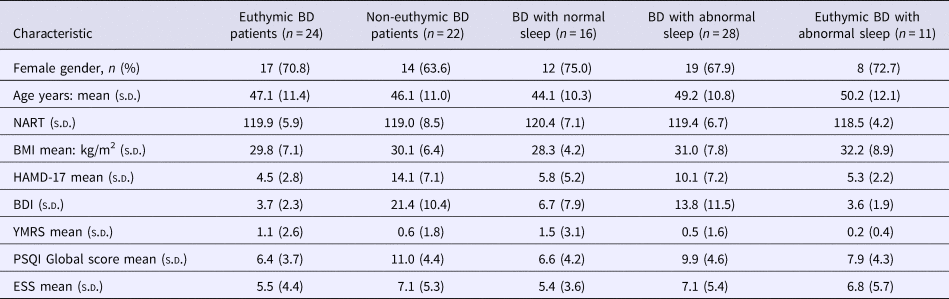
The participants and their sleep phenotypes have previously been described (Bradley et al., Reference Bradley, Webb-Mitchell, Hazu, Slater, Middleton, Gallagher, McAllister-Williams and Anderson2017). In this current analysis, only participants with complete actigraphy and overnight sleep oximetry data sets were included. Eighty-two participants, 46 with BD (16 BD I and 30 BDII) and 36 controls, completed the study protocol. Table 1 shows the participant characteristics. Groups did not differ significantly with regard to age or gender but participants with BD had a greater body mass index (BMI) and scored more highly on mood rating scales. Twenty-one participants with BD scored ⩾8 on the HAMD-17 (range 8−35), but none of the patients were considered clinically to be in a manic or hypomanic episode for the duration of the study (YMRS range 0–10). Of the 46 BD patients, 28 had objectively defined abnormal sleep including OSA (n = 12), circadian rhythm sleep disorder (n = 12), long sleep (n = 14), short sleep (n = 4) or a combination of these abnormalities. Sixteen had normal objective measures of sleep with the absence of sleep apnoea confirmed with an overnight sleep study. Two BD participants with normal accelerometry defined sleep patterns did not complete the overnight sleep apnoea study so were not included in the normal sleeping group. On this basis, the BD patients were divided into those with objectively normal (n = 16) and objectively abnormal sleep (n = 28). The characteristics of the various bipolar sub-groups are shown in Table 2. Thirty-six controls had objectively verified normal sleep without any level of OSA and were included in the analysis. Two BD participants did not complete the full battery of cognitive tests, one who became anxious and asked to stop and the other for undisclosed reasons. One aged 55 years was a normal sleeper and had a BDI score of 8. The other aged 25 years was a normal sleeper with a BDI of 28. Their data are included for the tests they completed.
General characteristics of study participants at baseline (day 1)
Comparison of characteristics of participants with bipolar disorder (BD) in different sub-groups
Psychomotor Vigilance Test
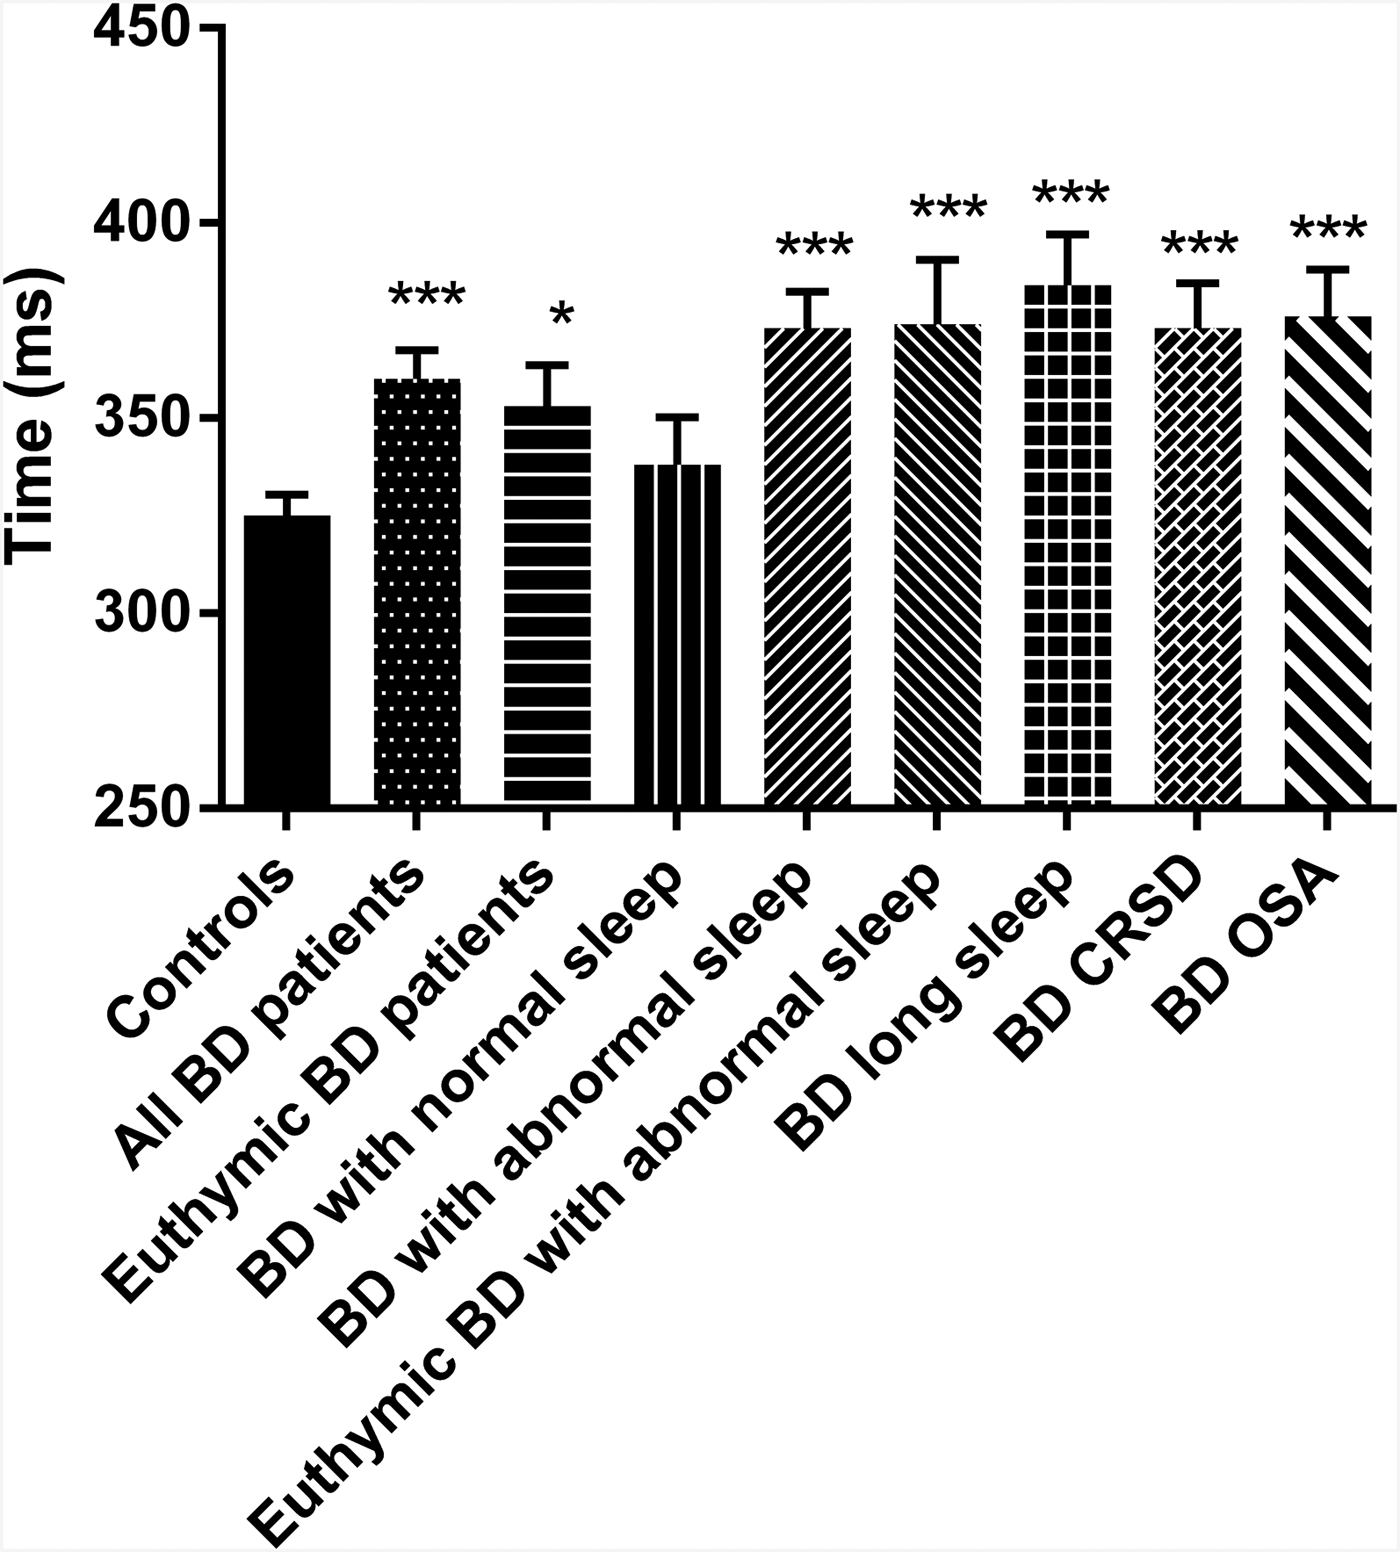
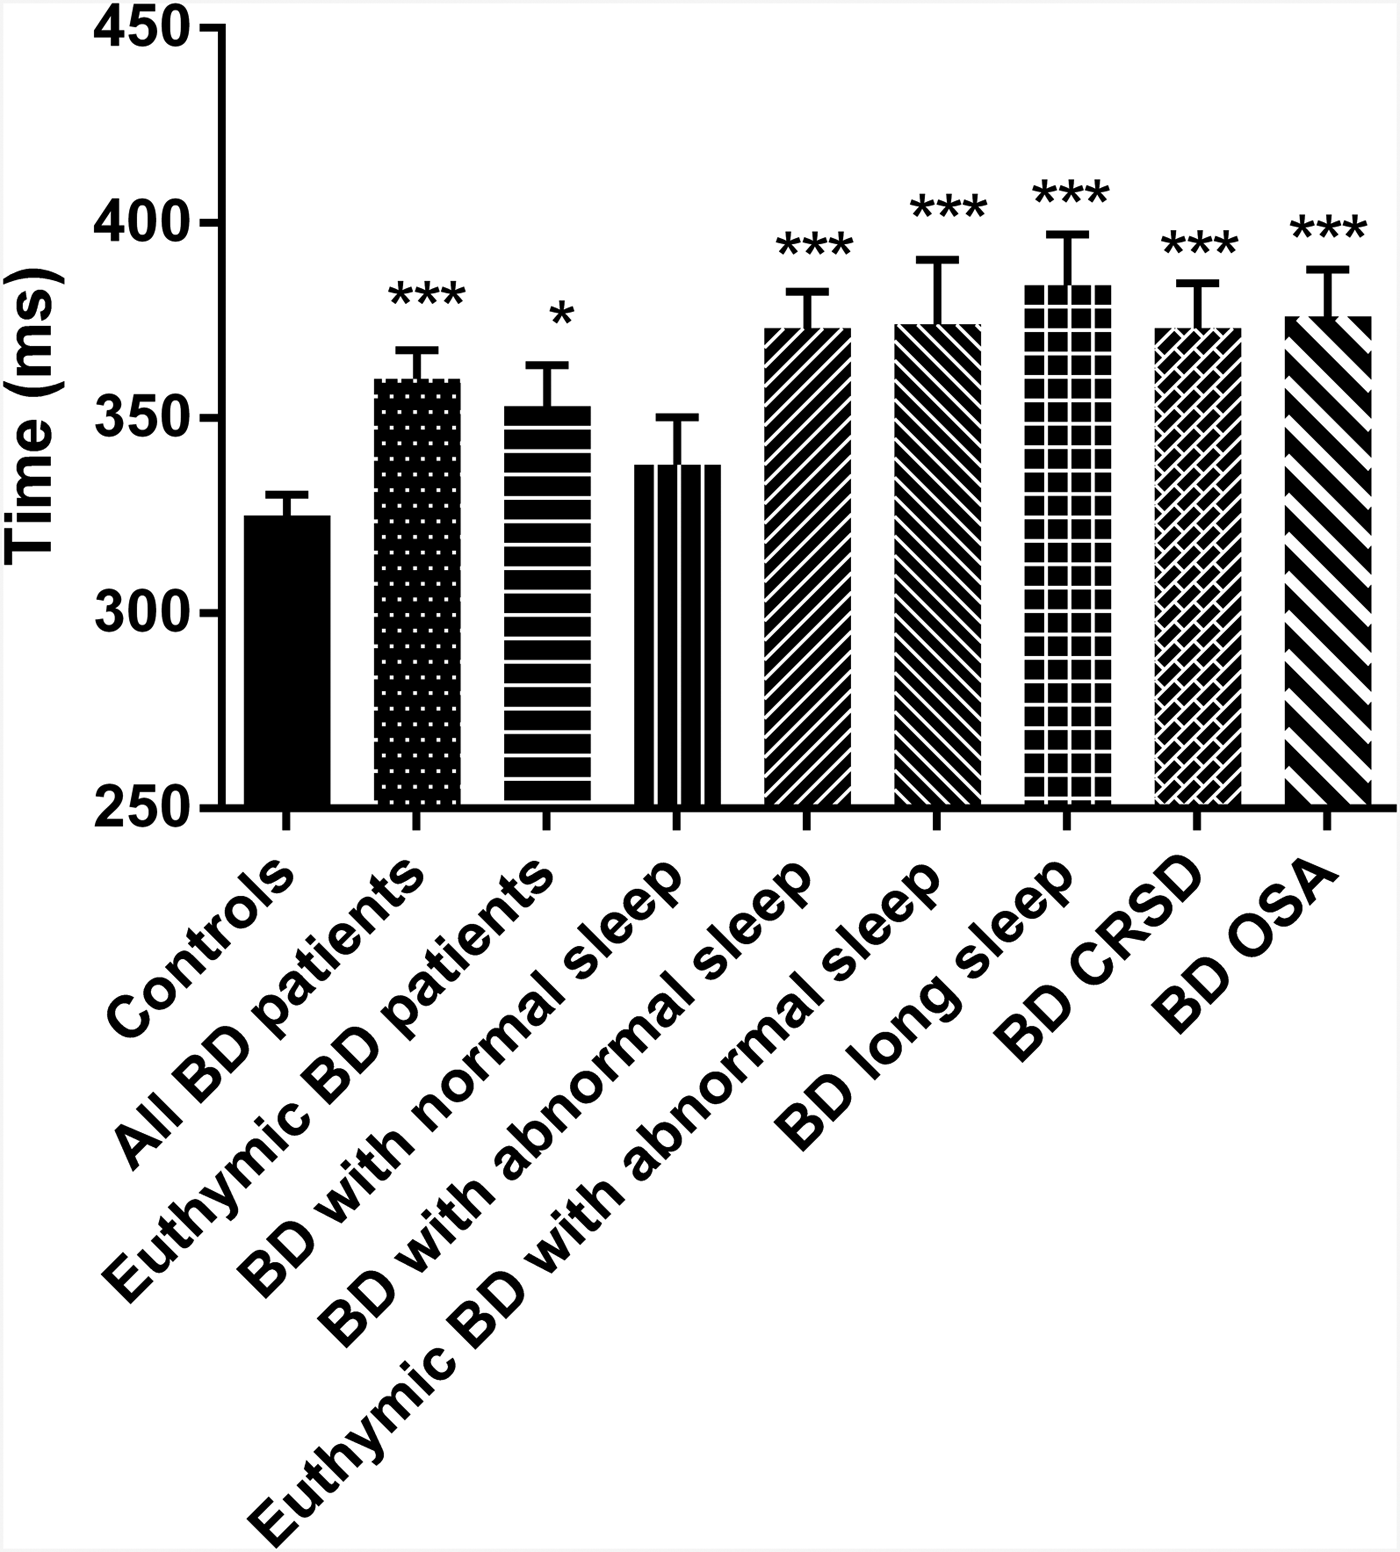
The PVT was completed by 36 controls and 46 BD patients. One BD patient was omitted from the analysis as the number of lapses committed was more than three times the interquartile range and they were deemed an extreme outlier. As anticipated, BD patients differed from control participants having longer mean response times (RTs: 360 ± 50 v. 325 ± 32 ms; p < 0.001; g = 0.81, 95% CI 0.35–1.26) and making more ‘lapses’ (RT > 500 ms; 5.1 ± 6.4 v. 1.8 ± 2.8; p < 0.001; g = 0.64, 95% CI 0.19–1.09). There were no missed responses made by any participant in either group. The rate of ‘anticipations’ (defined as responding <100 ms after presentation of the target stimulus) was very low and did not differ between controls and BD patients (1.08 ± 1.4 v. 1.0 ± 1.3 respectively; t = 0.275 p = 0.784). As a result, anticipations were not analysed further. Mean RT and number of lapses was significantly greater (p = 0.047 and 0.050, respectively) in the 26 euthymic BD patients compared with the controls, though the effect sizes were a little smaller [g = 0.65 (95% CI 0.13–1.17) and g = 0.53 (95% CI 0.02–1.05), respectively] than for the comparison including all patients. However, the BD patients with normal sleep did not differ from controls on either metric, while the BD patients with abnormal sleep did (mean RT: p < 0.001; g = 1.18, 95% CI 0.64–1.72; lapses: p < 0.001; g = 0.91, 95% CI 0.39–1.43). This was also the case for the BD patients with abnormal sleep but who were euthymic (mean RT: p = 0.001; g = 1.26, 95% CI 0.54–1.98; lapses: p = 0.005; g = 1.04, 95% CI 0.33–1.75). Mean RTs are shown in the various sub-groups in Fig. 1. The differences from controls were consistent across each of the three most common BD sleep phenotypes in this cohort (p < 0.001 for the difference in mean RT v. controls for all three – see Fig. 1). There were no significant correlations with age or NART IQ and so ANCOVA controlling for these variables was not performed.
PVT mean response times. Response times (mean with the error bars representing the SEM) on the PVT task for the healthy controls (n = 36) and BD patients. The total BD group is shown (n = 45) along with sub-sets of the BD patients including those who were euthymic (n = 26); those with normal sleep (n = 16); those with abnormal sleep (27); those with abnormal sleep who were euthymic (n = 11); those BD patients with long sleep (n = 13); those BD patients with CRSD (n = 12) and those BD patients with OSA (n = 12). *p < 0.05; ***p < 0.001 compared with controls. BD, bipolar disorder; CRSD, circadian rhythm sleep disorder; OSA, obstructive sleep apnoea; PVT, Psychomotor Vigilence Task; SEM, standard error of the mean.
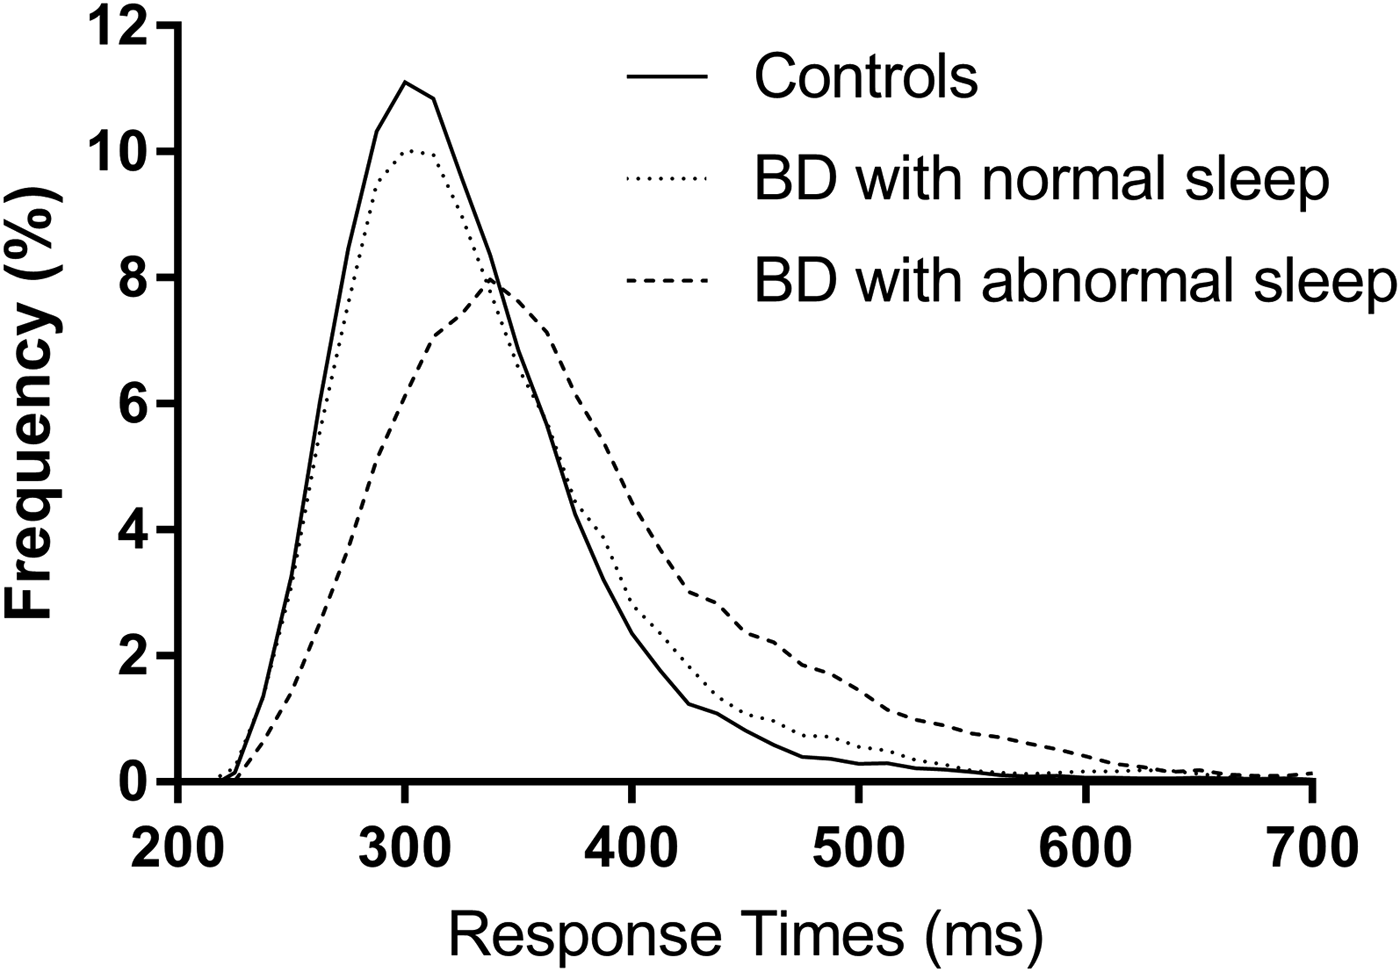
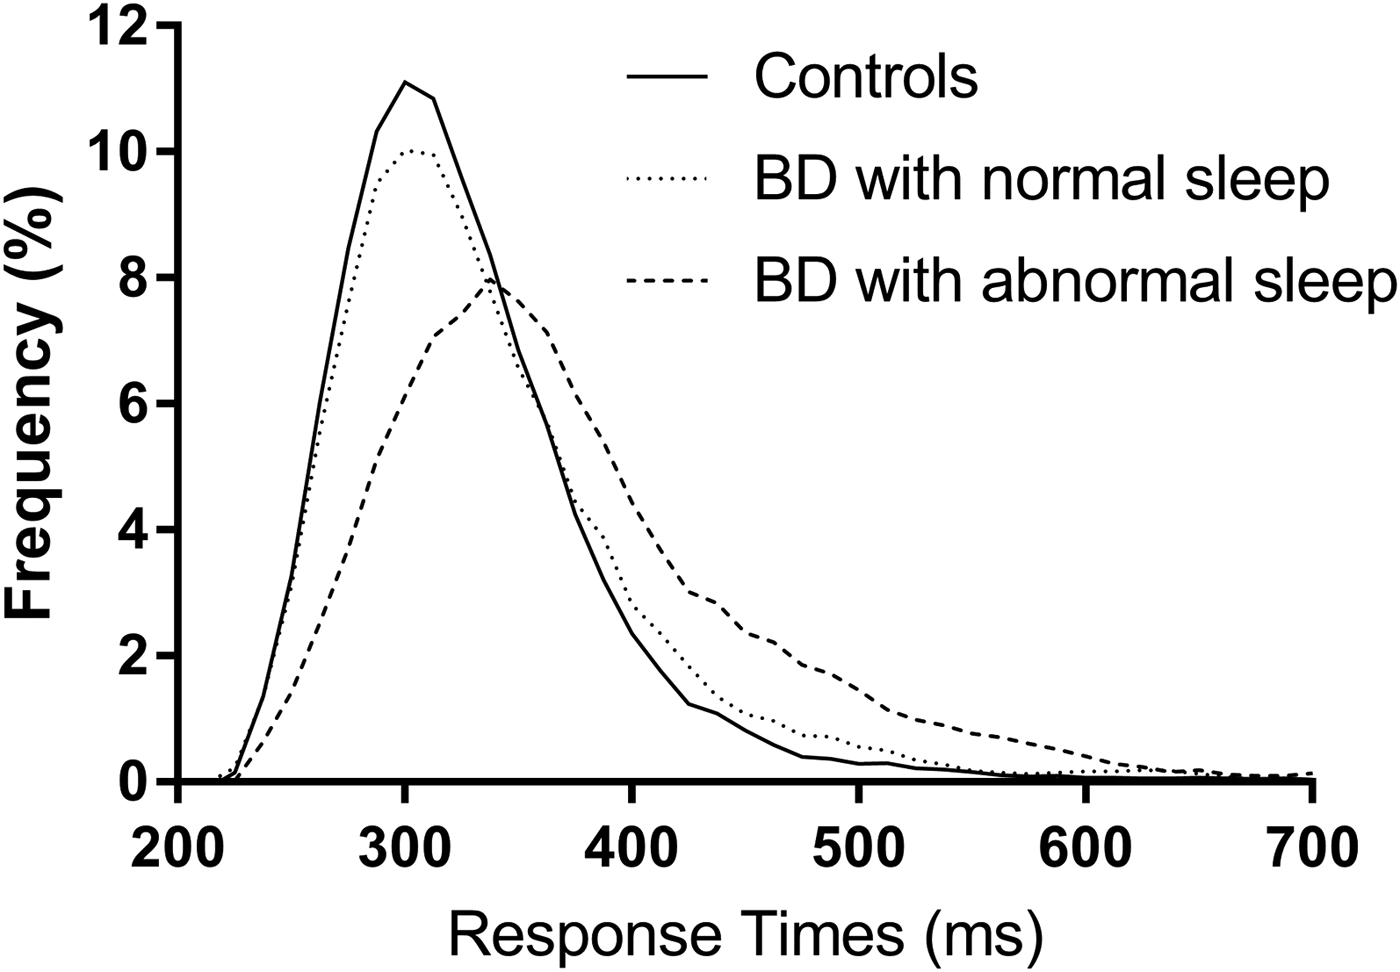
Ex-Gaussian analysis of PVT RTs found a significantly greater μ (p < 0.05; g = 0.52, 95% CI 0.08–0.97) and τ (p < 0.01, g = 0.65, 95% CI 0.20–1.10), though not σ, in BD patients compared with controls. The increase in τ is consistent with increased IIV and the higher rate of lapses seen with the raw RT data. There were no significant differences from controls in either the euthymic BD sub-group nor the BD patients with normal sleep, in either μ, σ or τ. However, the BD patients with abnormal sleep had significantly greater μ (p < 0.01; g = 0.79, 95% CI 0.27–1.30), σ (p < 0.005; g = 0.87, 95% CI 0.34–1.39) and τ (p < 0.001; g = 0.85, 95% CI 0.33–1.37). In the sub-group of BD patients with abnormal sleep who were euthymic, σ and τ remained significantly greater than in the control participants with similar magnitude effect sizes. Ex-Gaussian distributions of the PVT RTs are shown in Fig. 2. There were no significant correlations of age or NART-IQ in the control group and therefore ANCOVA controlling for these variables was not performed.
PVT response time distributions. Response time distributions plotted for controls (n = 36), BD patients with normal sleep (n = 16) and BD patients with abnormal sleep (n = 27). Data plotted in Prism v7.01, 2016 (GraphPad Software Inc., La Jolla, CA, USA) with a smoothed curve based on a rolling average utilising four data points on each side of each data point. BD, bipolar disorder; PVT, Psychomotor Vigilence Task.
Attention Network Task
The ANT was completed by 35 controls and 44 BD patients. One control was omitted from the analysis as their mean RT and conflict RT were more than three times the interquartile range and they were considered an extreme outlier. Mean ANT RTs showed a similar pattern of effects to PVT RTs, with BD patients having significantly greater meant RTs than controls, euthymic and BD normal sleepers not differing from controls, but BD abnormal sleepers having significantly greater mean RTs than controls (p = 0.001; g = 0.92, 95% CI 0.40–1.45), including just those who were euthymic (p = 0.002; g = 1.13, 95% CI 0.41–1.85). Ex-Gaussian analysis also revealed an identical pattern of effects to that seen with the PVT RT.
The main purpose of the ANT is to assess the processing efficiency of the alerting, orientating and executive attentional networks (Fan et al., Reference Fan, McCandliss, Sommer, Raz and Posner2002). BD patients differed from control participants on the orientating (p < 0.05; g = 0.49; 95% CI 0.04–0.95) and conflict (p = 0.005; g = 0.68; 95% CI 0.22–1.14) RTs, the latter representing the executive network. In the comparison between controls and euthymic BD patients and BD patients with normal sleep, the orientating RTs remained significantly different, though the conflict RTs were not significantly different. However, the BD patients with abnormal sleep differed from controls on the conflict RT with a large effect size (p < 0.001; g = 1.14; 95% CI 0.61–1.68) but with no difference in alerting or orientating RTs. The euthymic BD abnormal sleepers also differed from controls on the conflict RT (p < 0.01; g = 1.15; 95% CI 0.43–1.87) but not the other two RTs. This finding suggests that abnormal BD sleepers have an impaired executive attentional network compared with controls and that is not dependent on mood state. This impairment in executive attentional network was also evident in all three BD sleep phenotypes (p < 0.01 for all phenotypes).
There was no correlation between age or NART IQ and mean ANT RT, conflict or orientating RT and so no ANCOVA was performed.
Digit Symbol Substitution Test
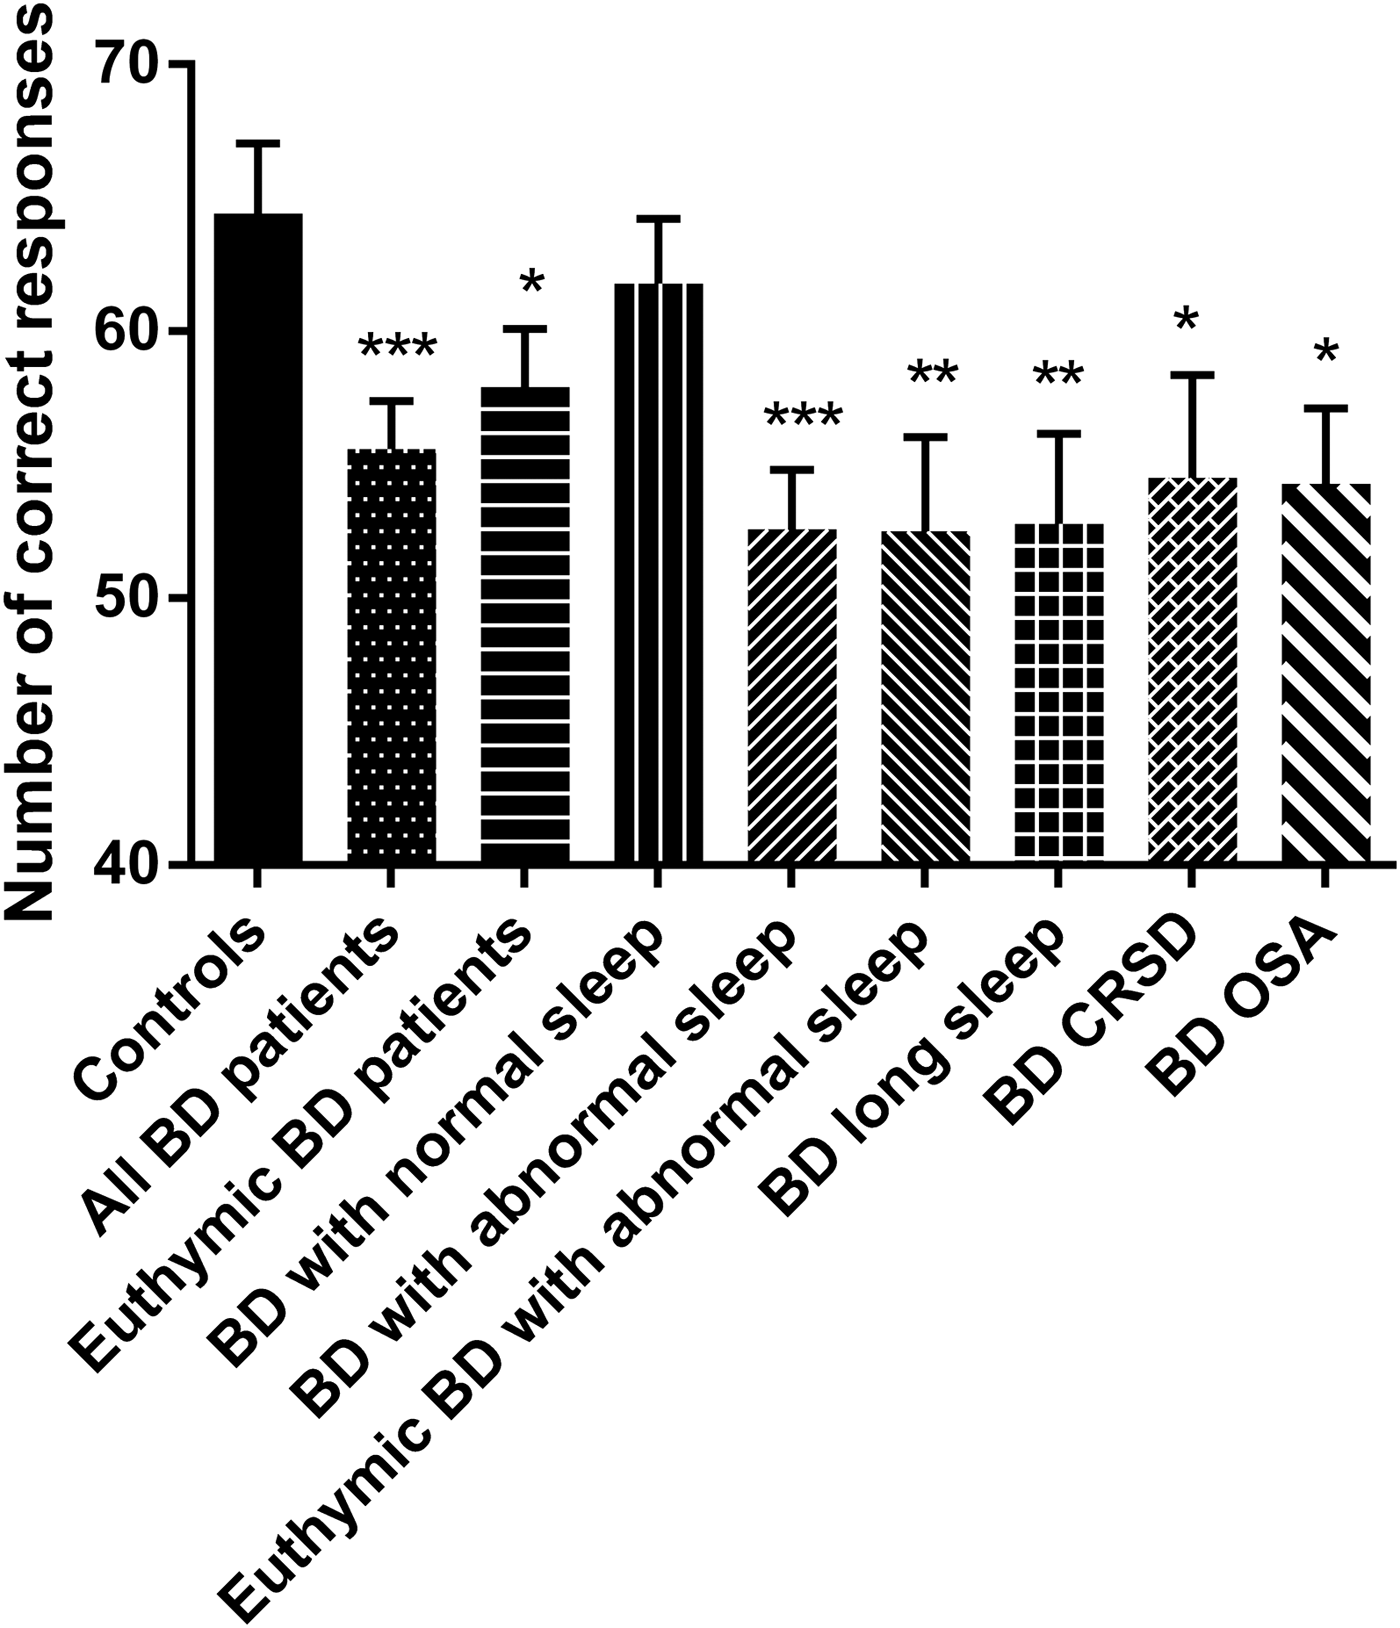
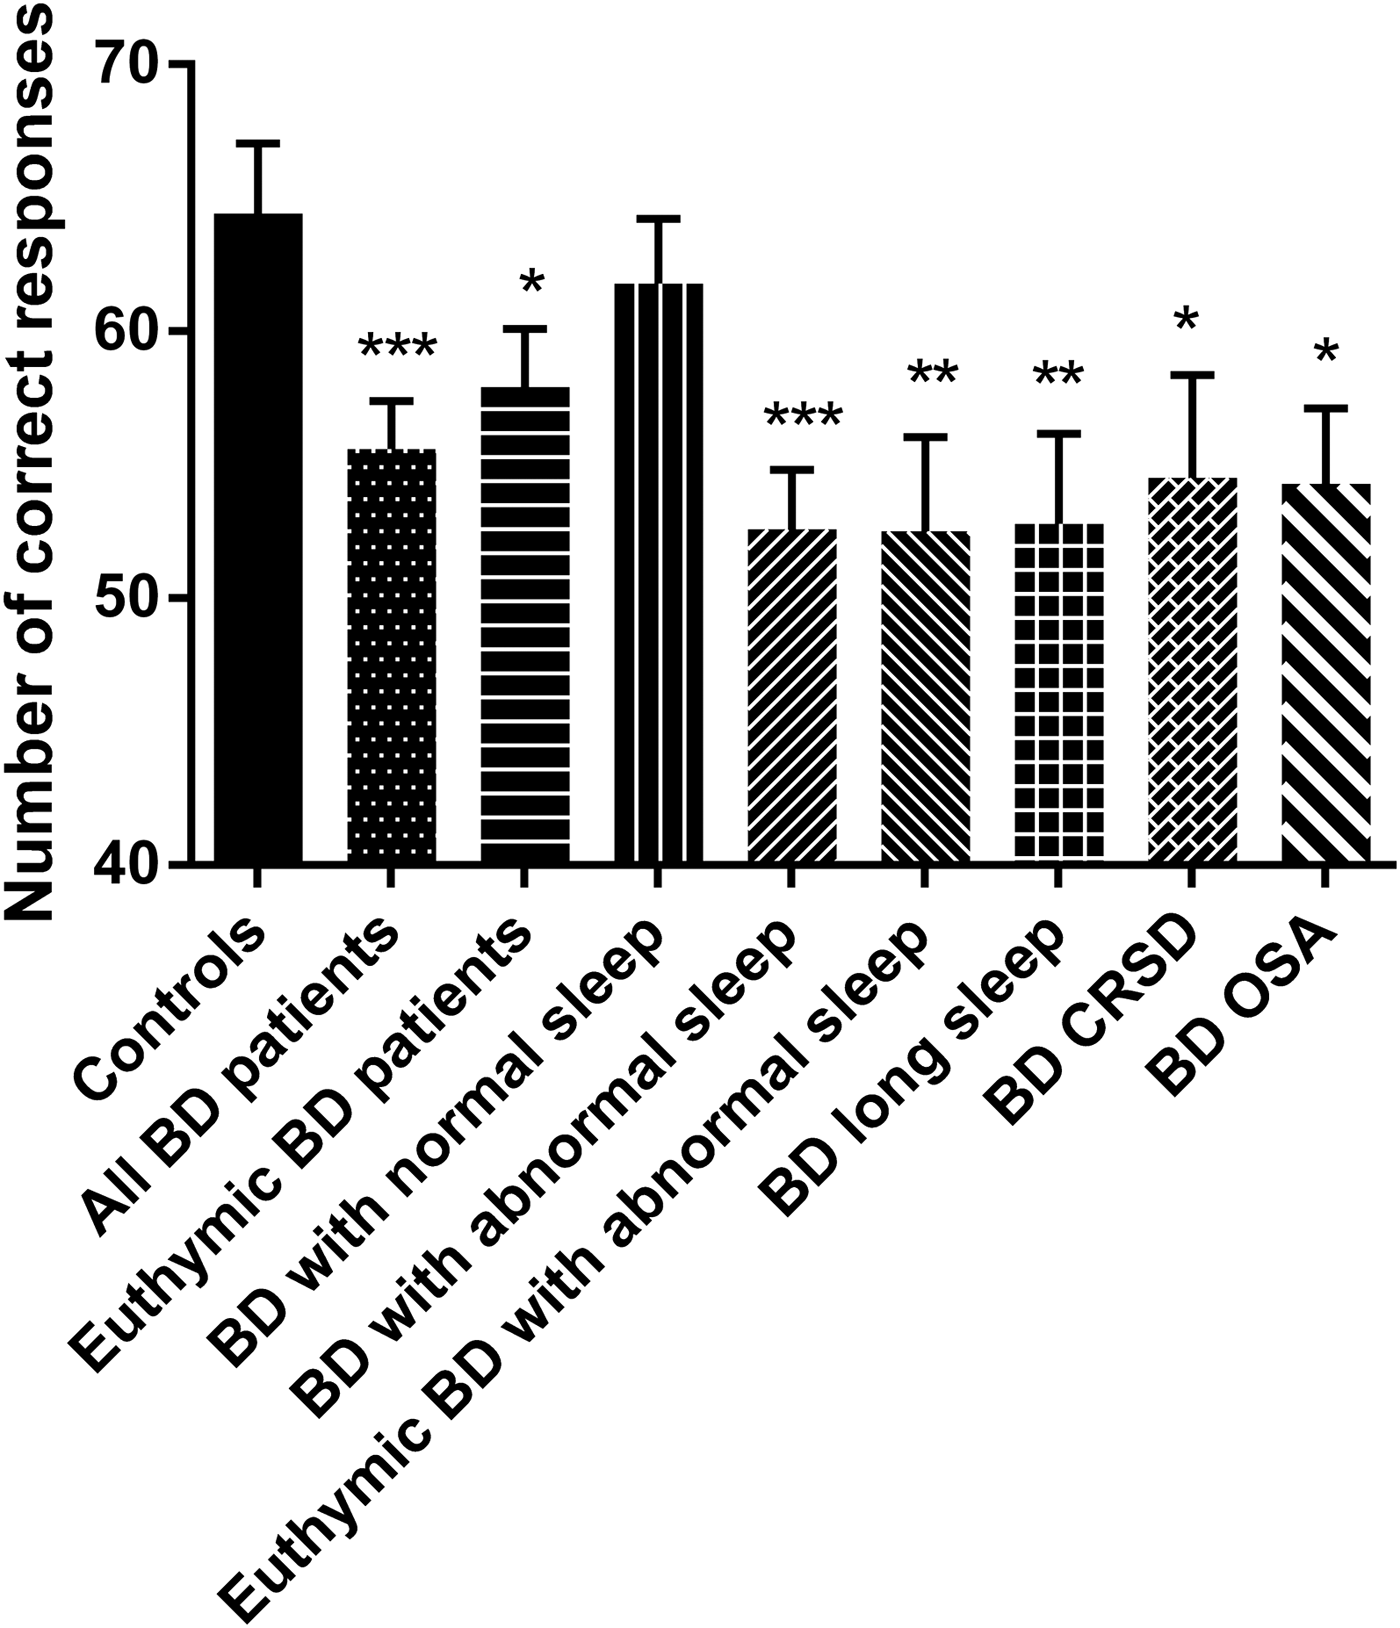
The DSST was completed at the beginning and end of the cognitive test battery to check for evidence of fatigue. Performance on the second occasion was statistically significantly better, though with only a small effect size. Only data from the first DSST to be performed is reported here, though the findings are identical if using the second DSST data. The findings are shown in Fig. 3. As can be seen, the pattern of effects in the various sub-groups is very similar to that seen for the mean PVT RT shown in Fig. 1. As expected, BD patients made fewer correct responses than the controls (p < 0.001; g = −0.77; 95% CI −1.22 to −0.32). This was also the case in the euthymic BD patients (p < 0.05; g = −0.60; 95% CI −1.11 to −0.08). However, the BD patients with normal sleep did not differ from controls, while those with abnormal sleep did (p < 0.001; g = −0.98; 95% CI −1.48 to −0.44), including just those who were euthymic (p < 0.01; g = −0.91; 95% CI −1.61 to −0.21). The sub-groups of BD patients with the three main abnormal sleep phenotypes seen also all different from controls (all p < 0.05). There was a significant Pearson's correlations between age and DSST score in controls [r (36) = 0.689, p < 0.001] and patients [r (46) = 0.472, p = 0.003]. Age was therefore included as a covariate in ANCOVA analysis of all of the comparisons between BD patient sub-groups and controls. All differences remained significant.
DSST performance. Number of correct responses made in 90 s (mean with the error bars representing the SEM) for the healthy controls (n = 36) and BD patients. The total BD group is shown (n = 46) along with sub-sets of the BD patients including those who were euthymic (n = 26); those with normal sleep (n = 16); those with abnormal sleep (28) and those with abnormal sleep who were euthymic (n = 11); those BD patients with long sleep (n = 14); those BD patients with CRSD (n = 12) and those BD patients with OSA (n = 12). *p < 0.05; **p < 0.01; ***p < 0.001 compared with controls. BD, bipolar disorder; CRSD, circadian rhythm sleep disorder; DSST, Digit Symbol Substitution Test; OSA, obstructive sleep apnoea; SEM, standard error of the mean.
TRAILS A and B
One control participant was not included in this analysis as their TRAILS B − A score was greater than three times the interquartile range and was therefore deemed extreme outlier. There were no significant differences between controls and BD patients in performance on the TRAILS A or B, or the B minus A score. As a result, no sub-group analysis was performed.
Digit span test
There were no significant differences between controls and BD patients in performance on the digit span total scores. Correlation analysis however found a significant Pearson's correlation between NART-IQ and digit span score in controls [r (36) = 0.484, p = 0.003] and BD patients [r (46) = 0.302, p = 0.042]. ANCOVA was therefore performed to control for the effects of IQ. This revealed a significant difference between controls and patients [F (1,78) = 5.833, p = 0.018], including just those who were euthymic [F (1,58) = 4.159, p = 0.046] but not those with normal sleep [F (1,50) = 3.355, p = 0.073]. However, patients with abnormal sleep did differ from controls [F (1,60) = 5.165, p = 0.027] although in this instance this was not seen in the abnormal sleepers who were euthymic [F (1,43) = 2.717, p = 0.107].
Newcastle Spatial Working MemoryTest
BD patients committed significantly more between search errors on the NSWM test than controls (p < 0.05; g = 0.023, 95% CI 0.07–0.99). There was however a moderate correlation between age and between search errors in controls [r (33) = 0.562, p = 0.001] and a weak correlation in BD patients [r (43) = 0.300, p = 0.051]. After controlling for age with ANCOVA, the differences between controls and BD patients were no longer significant. As a result, no further analysis was performed.
Verbal learning test
BD patients recalled significantly fewer words on the immediate recall of the verbal learning test (p = 0.002; g = −0.60, 95% CI −1.05 to −0.16). There was a significant Pearson's correlation between NART-IQ and immediate recall score in BD patients [r (46) = 0.413, p = 0.004] and a trend towards a significant correlation in controls after winsorising a significant outlier [r (36) = 0.314, p = 0.066]. ANCOVA covarying for NART-IQ found a significant difference between BD patients and controls [F (1,78) = 13.999, p < 0.001], which was also seen for the euthymic [F (1,58) = 4.551, p = 0.037] but not normal sleeping [F (1,48) = 3.681, p = 0.061] sub-groups. BD abnormal sleeps, however, did differ from controls [F (1,60) = 12.806, p = 0.001] though not just those who were in euthymia [F (1,43) = 1.982, p = 0.166].
Discussion
This is the most comprehensive study to date to assess objectively defined abnormal sleep/circadian rhythm and cognition in BD patients compared with controls. In summary, across a wide range of cognitive assessments, there were the expected significant differences between BD patients as a group compared with age- and sex-matched controls. However, these differences were almost entirely associated with those BD patients with objectively defined abnormal sleep. BD patients with normal sleep did not differ from controls on any cognitive measure with the exception of the ANT orientating network RTs. Given that no corrections were made for multiple comparisons, this could be a type I error. Conversely, BD patients with abnormal sleep differed from controls having longer PVT and mean ANT RTs, greater RT IIV, impaired executive attentional network function, fewer correct responses on the DSST, poorer digit span performance and worse verbal memory recall. While BD patients in our sample with abnormal sleep had lower mood than those with normal sleep (Bradley et al., Reference Bradley, Webb-Mitchell, Hazu, Slater, Middleton, Gallagher, McAllister-Williams and Anderson2017), BD patients with abnormal sleep but who were euthymic, also differed from the controls on all of these cognitive measures except digit span and verbal memory. Given the relatively small sample size of BD patients with abnormal sleep but who were in euthymia, the lack of statistical significance in the difference in digit span and verbal memory may well be due to a lack of statistical power. While we therefore confirmed cognitive dysfunction in BD, especially in measures of attention, rather than sleep abnormalities exacerbating such dysfunction, the cognitive abnormalities were entirely confined to BD patients with sleep abnormalities. As such, these findings are therefore consistent with sleep disturbance being the main driver of the cognitive abnormalities seen in BD.
Limitations
Weaknesses of the study include a lack of the gold standard measure of sleep using video polysomnography. However, this was a field study and it was felt that studying patients with partial polysomnography in their own homes would increase compliance. The sample was opportunistic with a potential bias for over-representation of patients with BD and sleep disorders, while controls were screened out if they suffered significant sleep problems. A larger, more representative, sample size would have allowed greater sub-group analysis of the differential effect of the different patterns of sleep and circadian rhythm. Future studies might include those with other psychiatric disorders or control subjects with primary sleep disorders to study the impact upon cognition.
Actigraphy assesses physical activity and hence is a surrogate marker of sleep. However, it has been the most widely used and published technique to assess sleep/wake patterns and circadian rhythm for many years (Melo et al., Reference Melo, Garcia, Linhares Neto, Sa, de Mesquita, de Araujo and de Bruin2016). The American Academy of Sleep Medicine also recognise actigraphy as sufficient, alongside clinical evaluation, to make the diagnosis of circadian rhythm disorders (American Academy of Sleep Medicine, 2014). In BD, sleep variables derived from actigraphy have been shown to highly correlate with gold standard polysomnography (Kaplan et al., Reference Kaplan, Talbot, Gruber and Harvey2012). As a result, while the use of actigraphy is a limitation, we believe that it is a legitimate and pragmatic method for assessing sleep.
The patients included in this study were not medication free and it is not possible to exclude the possibility that this influenced our findings. However, there was no difference in the rates of usage of different medications between the different bipolar subgroups with the exception of a significantly higher rate of hypnotic use in long sleepers (42.9%) compared with normal sleepers (6.3%) (Fisher's exact test p = 0.031). This finding and details of the medication used is provided in our previous publication (Bradley et al., Reference Bradley, Webb-Mitchell, Hazu, Slater, Middleton, Gallagher, McAllister-Williams and Anderson2017).
No correction was made for multiple statistical testing. However, it seems unlikely that our findings are type I errors for two main reasons. Firstly, there was consistency in the findings both between measures of the same cognitive domain (attention – PVT and ANT) and across domains. Secondly, if a conservative Bonferroni correction had been used, the main bulk of our findings would have remained significant, including the difference between bipolar patients with abnormal sleep and controls (PVT RTs and lapses, ANT RT, DSST, verbal learning) and between euthymic bipolar patients with abnormal sleep and controls (PVT RTs and lapses, ANT RT). The findings that would not have remained significant are the DSST difference between controls and euthymic bipolar abnormal sleepers and controls and the findings with the digit span test. We did not apply a Bonferonni correction since we were not interested in whether patients and controls differed cognitively in different domains, but if they differed with a particular a priori focus on attention and psychomotor processing speed. Applying corrections for multiple comparisons would simply have increased the risk of type II errors. Rather we rely upon describing the statistical tests performed and the pattern of effects seen (Perneger, Reference Perneger1998). For all contrasts, we include estimates of effect size with accompanying 95% CI which are more informative to future research that the point estimates of significance which we agree are linked to sample size and therefore limited in their utility.
The study also had a number of strengths. These include a well-characterised group and comprehensive measures of cognition, sleep and circadian rhythm across 21 days. The control group were carefully matched and a wide range of sleep disturbances was included to reflect real-life clinical practice where many BD patients have a variety of reasons for disturbed sleep. We were fortunate enough to have a reasonable number of both normal and abnormal sleepers, and of euthymic patients in the latter group. This allowed for an examination of our hypotheses without the need for spuriously covarying for mood in comparisons between two groups (patients and controls) that differed on their mood ratings.
In conclusion, we have found that many patients with BD have disrupted sleep and that this has a significant impact upon tests of cognition including in those patients in remission. This suggests that objective measures of sleep disturbance need to be taken into account in future studies of cognition in BD and that sleep may be a potential target for treatment of cognitive disturbance in BD.
Acknowledgements and Financial support
We would like to thank all of the participants for taking part in the study. The study was sponsored by Northumberland, Tyne and Wear NHS Foundation Trust. Some funding to cover running costs was received from Eli Lilly as an unrestricted investigator initiated and led award. The design, conduct and analysis of the study were entirely under the control of the authors.
Conflict of interest
None.
Ethical standards
The authors assert that all procedures contributing to this work comply with the ethical standards of the relevant national and institutional committees on human experimentation and with the Helsinki Declaration of 1975, as revised in 2008.