INTRODUCTION
Wheat (Triticum aestivum L. em. Thell.) is the main arable crop in the UK, occupying 1·9 million ha out of 4·6 million of the total arable land in production (DEFRA 2015). However, farmers are facing increasing pressure to produce wheat that meets economic yield targets, specific nutrition and market requirements while making use of fertilizers in ways that can ensure economic and environmental goals are met more efficiently (Hawkesford et al. Reference Hawkesford, Araus, Park, Calderini, Miralles, Shen, Zhang and Parry2013; DEFRA 2014). It is necessary, therefore, to devise more integrated crop management methods to better combine cultural practices and the more rational use of chemical inputs so as to increase crop yield, while reducing costs and environment impact.
Soil tillage is considered one of the most important cultural practices in agriculture due to its effect on soil physical, chemical and biological properties (Wild Reference Wild1988). Tillage involves mechanical operations that modify soil conditions so that they are suitable for seed emergence and plant growth (Ahn & Hintze Reference Ahn, Hintze, Pushpananjah, Latham and Eliot1990). The intensity of soil disturbance by tillage operations can vary the incorporation and mixing of plant residues into the soil, influencing crop establishment, subsequent growth and final yield (Gajri et al. Reference Gajri, Arora and Prihar2002). In the UK, tillage systems can be categorized into two main classes: plough-based conventional tillage (CT) and non-inversion tillage, also broadly known as conservation tillage (Davies & Finney Reference Davies and Finney2002). Conventional tillage involves soil inversion by the use of mouldboard ploughs to around 0·20–0·25 m depth (Gajri et al. Reference Gajri, Arora and Prihar2002), often followed by a power harrow generally in conjunction with a seed drill to create a smooth seedbed (Bell Reference Bell1996; Soffe Reference Soffe2003). Non-inversion tillage systems are now widely adopted on different soil types (Kassam et al. Reference Kassam, Friedrich, Shaxson and Pretty2009; IPCC 2014) including heavy clays (Holland Reference Holland2004), but its use in temperate climates is still limited (Morris et al. Reference Morris, Miller, Orson and Froud-Williams2010). Conventional plough-based tillage is still chosen over non-inversion tillage by many farmers to loosen crusted and compacted soils, and to help towards optimizing yields, but in many cases its use may just be for ease of drilling (Jones et al. Reference Jones, Basch, Baylis, Bazzoni, Bigs, Bradbury, Chaney, Deeks, Field, Gomez, Jones, Jordan, Lane, Leake, Livermore, Owens, Ritz, Sturny and Thomas2006; Morris et al. Reference Morris, Miller, Orson and Froud-Williams2010). In the UK, some non-inversion tillage systems involve the use of tines and disc harrows, without inverting the soil, at a shallow depth of around 0·12–0·15 m, depending upon soil type and cultivation speed (Carter et al. Reference Carter, Jordan and Stride2003). These tillage operations incorporate crop residues in the top-soil layers and leave a proportion on the surface (Peigné et al. Reference Peigné, Ball, Roger-Estrade and David2007; Soane et al. Reference Soane, Ball, Arvidsson, Basch, Moreno and Roger-Estrade2012). Tillage operations reportedly modify the soil environment, such as water content and temperature, and soil fauna activity as well as promoting organic matter oxidation (Silgram & Shepherd Reference Silgram and Shepherd1999), thereby causing a temporary increase in soil mineral nitrogen (SMN) availability (Silgram & Shepherd Reference Silgram and Shepherd1999; López-Bellido et al. Reference López-Bellido, López-Bellido and Redondo2005). Non-inversion tillage systems can result in lower SMN than CT (McConkey et al. Reference McConkey, Curtin, Campbell, Brandt and Selles2002; Al-Khasi et al. Reference Al-khasi, Yin and Licht2005), as a consequence of lower organic matter oxidation in the spring, autumn and winter, but increased mineralization in the summer (Blevins & Frye Reference Blevins and Frye1993; Riley et al. Reference Riley, Børresen, Ekeberg, Rydberg and Carter1994). Additionally, lower SMN has often been ascribed to higher N-immobilization of crop residues (Soane et al. Reference Soane, Ball, Arvidsson, Basch, Moreno and Roger-Estrade2012; López-Bellido et al. Reference López-Bellido, Muñoz-Romero and López-Bellido2013). Non-inversion tillage reportedly requires larger nitrogen (N) fertilization in order to produce similar yields to CT (McConkey et al. Reference McConkey, Curtin, Campbell, Brandt and Selles2002). However, increases in SMN availability by increasing tillage intensity do not necessarily support greater crop productivity (Greenwood Reference Greenwood1982) due to the increasing risk of nitrate leaching before crop N uptake (Silgram & Shepherd Reference Silgram and Shepherd1999).
Several studies report crop yields under CT are either higher or comparable with those from non-inversion tillage (Gruber et al. Reference Gruber, Pekrun, Möhring and Claupein2012; Soane et al. Reference Soane, Ball, Arvidsson, Basch, Moreno and Roger-Estrade2012; Vijaya Bhaskar et al. Reference Vijaya Bhaskar, Davies, Cannon and Conway2013). Mixing and/or incorporating plant residues in the soil can allow better seed–soil contact, increased germination and crop establishment and better final yields under CT (Hemmat & Taki Reference Hemmat and Taki2001; Vijaya Bhaskar et al. Reference Vijaya Bhaskar, Davies, Cannon and Conway2013), while higher N availability can reportedly increase grain yield and protein content (López-Bellido et al. Reference López-Bellido, Fuentes, Castillo and López-Garrido1998; De Vita et al. Reference De vita, Di Paolo, Fecondo, Di Fonzo and Pisante2007). Non-inversion tillage effects on crop yield are also highly variable depending on weather conditions (López-Bellido et al. Reference López-Bellido, Fuentes, Castillo and López-Garrido1998; Ordoñez-Fernández et al. Reference Ordoñez-Fernández, González-fernández, Giráldez-cervera and Perea-Torres2007) often partially associated with modifications in soil moisture content, e.g. greater water storage during dry periods (De Vita et al. Reference De vita, Di Paolo, Fecondo, Di Fonzo and Pisante2007; Sharma et al. Reference Sharma, Abrol and Sharma2011). The aim of the present field experiments was to determine the effects of contrasting tillage systems – conventional plough-based tillage (CT), high intensity non-inversion tillage (HINiT) and low intensity non-inversion tillage (LINiT) – combined with different N fertilization rates of 0 (N0), 70 (N70), 140 (N140) and 210 kg N/ha (N210) – on spring wheat growth, yield components, grain yield and N-use efficiency (NUE) in a clay soil in the temperate climate of the UK.
MATERIAL AND METHODS
Site description
Experiments were conducted from March to August in 2013 and 2014 on land previously managed organically at the Royal Agricultural University's Harnhill Manor Farm, Cirencester, UK (51°42′N, 01°59′W; 135 m a.s.l.). The soil series was Evesham with (SSEW 1983) a clay texture and 4·7 g of organic matter/100 g of soil. Initial physiochemical properties were measured before the experiments were established (March 2013) and are listed in Table 1.
Key soil characteristics (0–25 cm)

Cumulative precipitation during the growing season (March–August) in 2013, 292 mm, was below the long-term seasonal average of 377·2 mm, while in 2014 the cumulative precipitation of 400·5 mm was above average (Fig. 1). Average air temperatures of 11·7 °C in 2013 and 12·8 °C in 2014 were both lower than the long-term average of 13·9 °C.
Mean air temperature and precipitation during 2013 and 2014 cropping seasons in comparison with the 10-year average. Royal Agricultural University meteorological station.

Experimental design and treatment structure
The experiments followed a randomized complete block design in a split-plot arrangement, replicated three times. Each block (90 × 100 m2) was divided into three main tillage treatments of 30 × 100 m2 (main plots) – CT, HINiT, and LINiT. Details of the tillage treatments used are specified in Table 2.
Specifications of the tillage treatments adopted in 2013 and 2014

CT, conventional tillage; HINiT, high intensity non-inversion tillage; LINiT, low intensity non-inversion tillage.
Before primary cultivation techniques were applied (20 March 2013 and 24 March 2014), weeds were controlled by application of systemic herbicide glyphosate (2 l/ha) across all the plots. Spring wheat cvar Paragon (480 seeds/m2) was drilled on 10 April 2013 and harvested 27 August 2013. After the 2013 harvest, the field was left with surface residues. Spring wheat was again drilled on 18 April 2014 and harvested on 31 August 2014. Main plots were divided into four fully randomized split plots (7·5 × 100 m2) with N fertilizer application rates of 0 (N0), 70 (N70), 140 (N140) and 210 kg N/ha (N210). Nitrogen fertilizer was applied as ammonium nitrate solution (34·5% N) with half applied at Zadoks decimal growth stage (GS) 13 and the remainder at GS 21 (Zadoks et al. Reference Zadoks, Chang and Konzak1974). The 2014 experiment was established on the same area as the 2013 trial and all treatments were applied continuously on the same plots.
Crop sampling
Plant establishment was determined by counting the number of plants inside a 0·25 m2 random quadrant for each split-plot with ten replications. At crop maturity, the trial was hand-harvested using 0·25 m2 random quadrats, with three replications for each treatment, recovering all above-ground plant material for analysis. Location of the quadrants at harvest was near to the soil sampling points (see below). Ears were counted to obtain number of ears per m2. The above-ground plant material was dried at 105 °C overnight and dry matter (DM) recorded. Ears were threshed by hand and the amount of grain weighed to obtain total grain number per ear and grain yield, which was subsequently corrected to 15% grain moisture content. In order to determine the N content, all plant samples were milled (0·5 mm sieve) (CT 193 Cyclotec Sample Mill, Foss, Denmark) followed by total N analysis with an Elemental Cube CNS auto analyser (Elementar Analysen Systemse GmbH, Hanau, Germany). Grain protein content was obtained by multiplying grain N% by 5·7 (Osborne Reference Osborne1907). Total grain N uptake and total wheat N uptake (total grain N uptake plus total straw N uptake) were then derived. Nitrogen-use efficiency was calculated as the ratio of grain yield per unit of N supply to the crop, expressed as kg/kg. Nitrogen supply is the sum of SMN at sowing, mineralized N and N fertilized applied. Mineralized N was estimated as the total plant N uptake at harvest plus SMN left in the soil profile after wheat harvest in the control plots (N0) minus initial SMN before wheat seeding (Huggins & Pan Reference Huggins and Pan1993; Miao et al. Reference Miao, Wang and Li2015).
Soil sampling
Soils were sampled to a depth of 0·25 m, in line with cultivation depth, at 15 random points following a W pattern within each treatment. Assessments were performed at sowing and directly before harvest. Soil available mineral N (ammonium (NH4) and nitrate(NO3)) was extracted by potassium sulphate (K2SO4) extraction method (Faithfull Reference Faithfull2002). Analysis of NH4 and NO3 was done on a FiAstar™ 5000 Analyser (Foss, Denmark) based on colorimetric methods. Soil mineral N on an area basis (kg/ha) was calculated using SMN in mg/l and bulk density (Unkovick et al. Reference Unkovick, Herridge, Peoples, Cadisch, Boddey, Giller, Alves and Chalk2008). Soil bulk density was determined following the ISO 11272: 1998 method (ISO 1998) for non-gravelly soils. Soil moisture content was measured gravimetrically by oven-drying sub-samples of 50 g at 105 °C overnight (Brady & Weil Reference Brady and Weil1999).
Statistical analysis
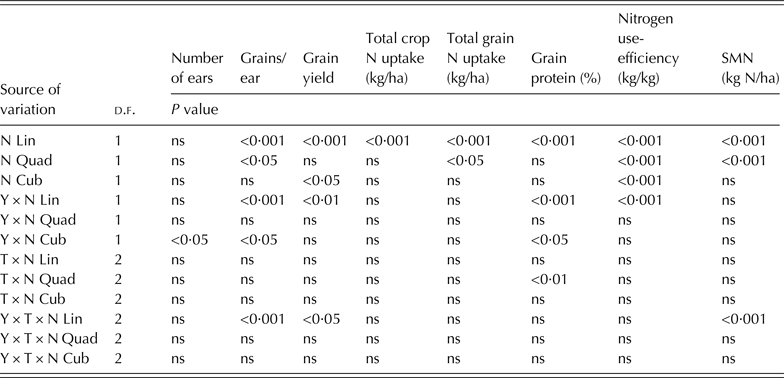
Statistical analyses were performed using the split-plot analysis of variance model in Genstat (15th Edition VSN International Ltd, Hemel Hempstead, UK) using Fisher's protected least significant difference (LSD) at P < 0·05. Polynomial contrasts were performed to evaluate the existence of linear, quadratic and cubic relations for each variable as a function of N application rate. Only significant effects were included in the final model. In this case, only ears number/m2 followed a cubic response to N, because the cubic model approximates both the sigmoidal behaviour observed at lower N rates (0–70 kg N/ha) and the observed asymptotic behaviour at higher yields (140–210 kg N/ha). The intermediate rate of N was less effectively utilized for producing ears than the lowest and highest rates. The resulting regression equation was:
 $$Y = a + bx + cx^2 + dx^3 $$
where Y is the predicted variable, x is the N fertilizer rate (kg N/ha) and the parameters a (intercept), b (linear coefficient), c (quadratic coefficient) and d (cubic coefficient), when applicable. Uniformity of variance and residuals of all data sets were verified before reporting results. Relationship of NUE to the protein content was analysed with linear regression analysis in Genstat.
RESULTS
Plant establishment, yield components and grain yield response to tillage and nitrogen management
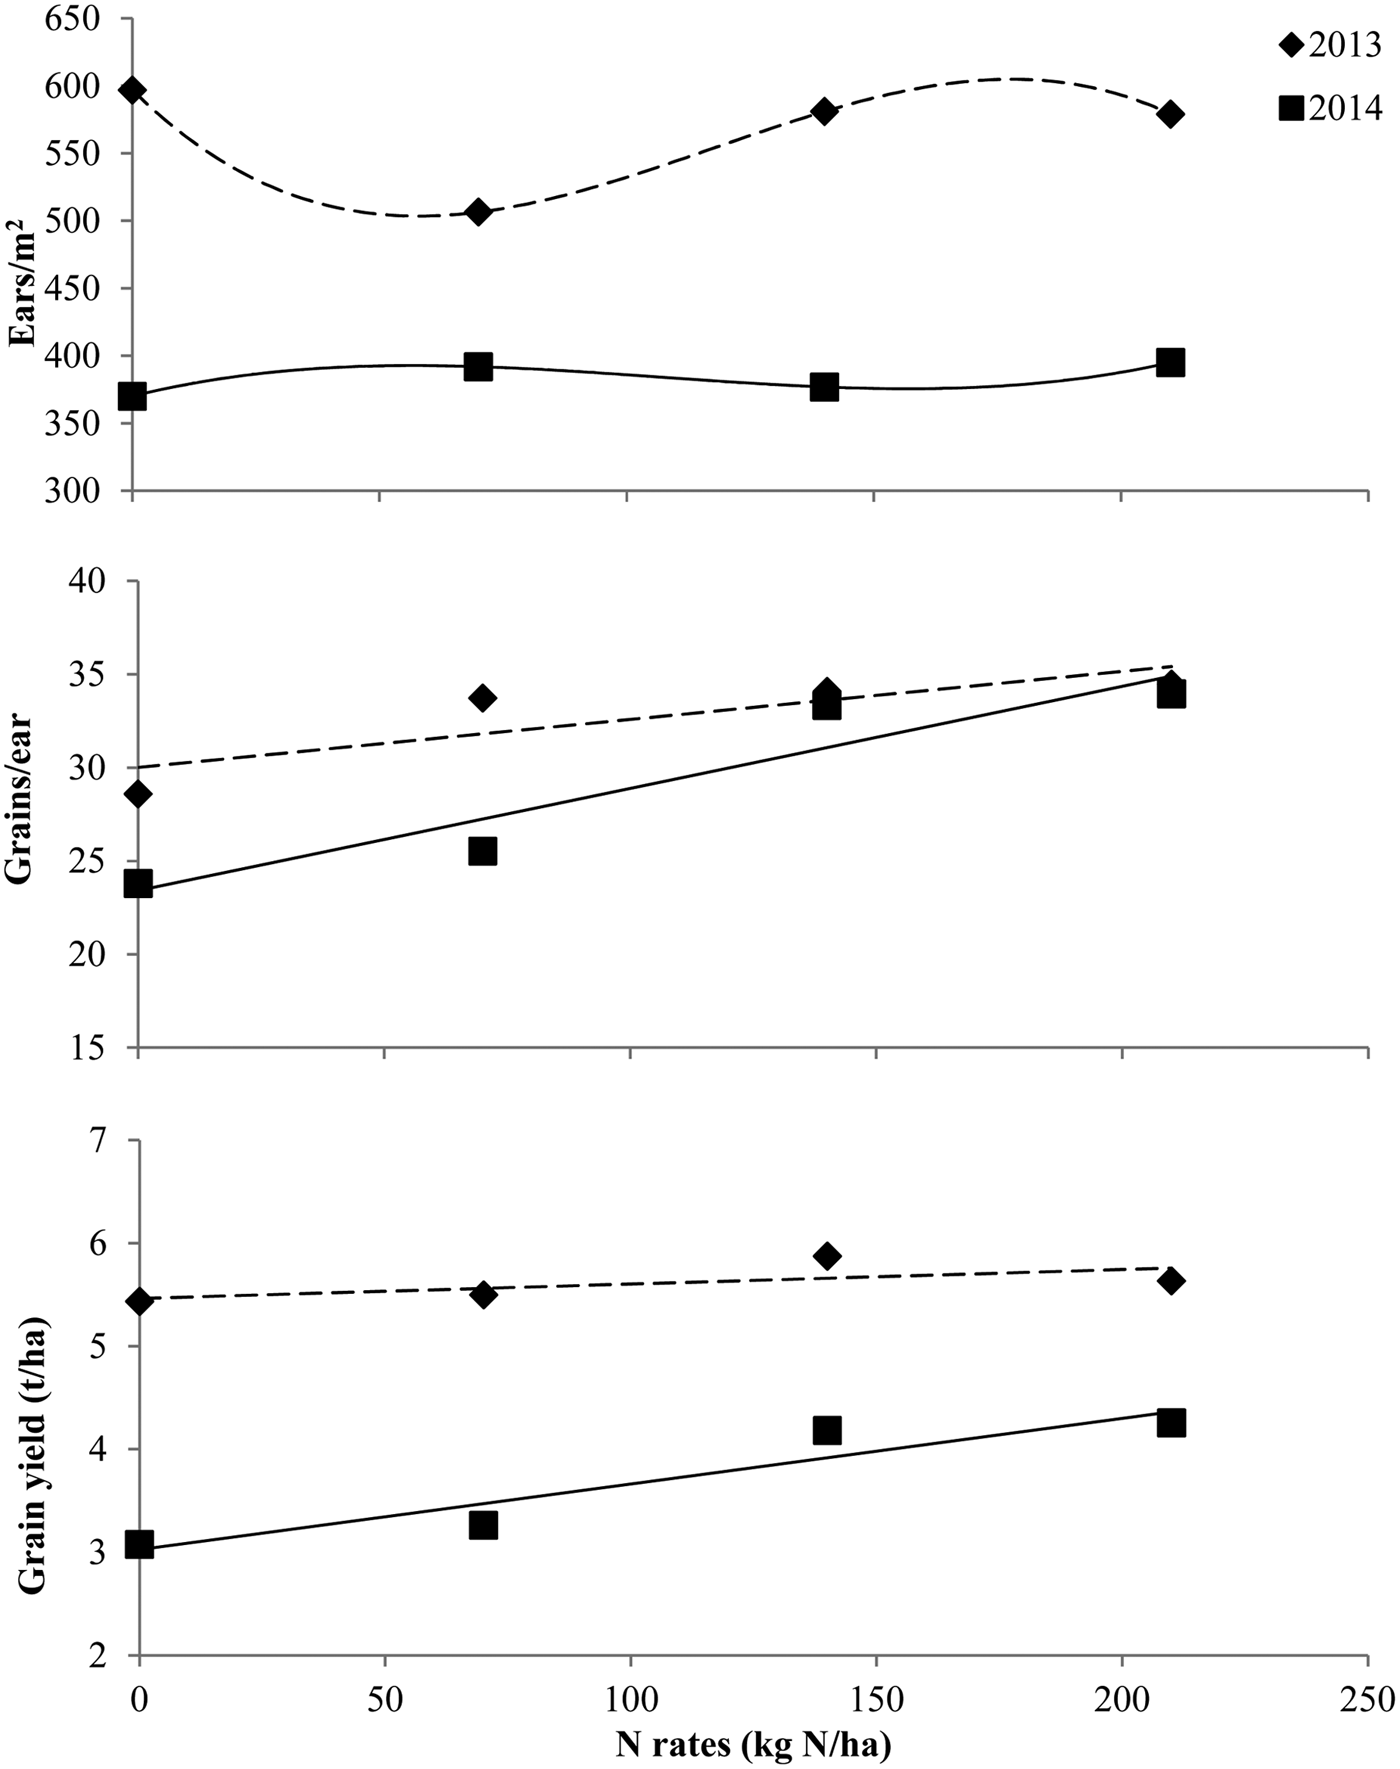
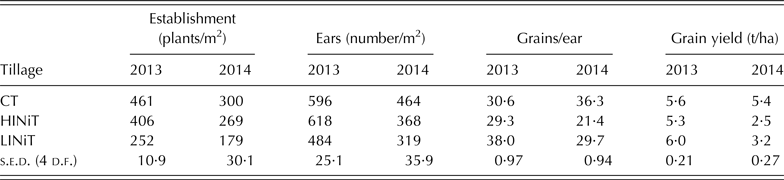
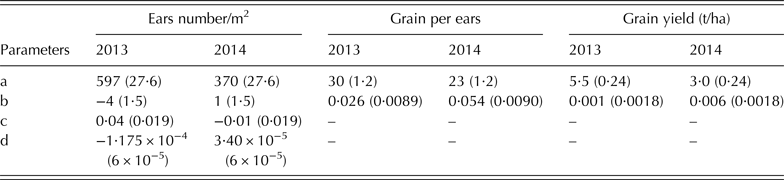
Plant establishment was significantly affected by year (P < 0·001), tillage (P < 0·001) and year × tillage interaction (P < 0·001). In 2013, CT produced a significantly (P < 0·001) higher plant establishment compared with HINiT and LINiT, while in 2014 CT and HINiT resulted in a significantly (P < 0·05) greater number of plants established/m2 than LINiT (Table 3). The number of ears was significantly influenced by year (P < 0·001), tillage (P < 0·001) and year × tillage interaction (P < 0·001). While CT and HINiT resulted in significantly (P < 0·01) more ears/m2 than LINiT in 2013, CT produced significantly (P < 0·01) more ears than LINiT and was similar to wheat under HINiT in 2014. There was a significant (P < 0·05) cubic response of year × N rate interaction on ear number/m2 (Table 4). Examination of the estimates of the cubic response curves shows more ears/m2 were produced in 2013 than in 2014 (Fig. 2, Table 5). No significant N management effect on ear number/m2 was observed over the 2 years.
Linear and cubic response of ear number/m2, grains/ear and grain yield (t/ha) to year × N rate interaction effect. Lines represent regression analysis for 2013 (- - -) and 2014 (—). Equations are shown in Table 5.

Effect of tillage on plant establishment, number of ears/m2, grains/ear and grain yield

CT, conventional tillage; HINiT, high intensity non-inversion tillage; LINiT, low intensity non-inversion tillage.
Polynomial model significance levels for number of ears, grains/ear, grain yield, total crop and grain nitrogen (N) uptake, grain protein, nitrogen use efficiency and soil mineral nitrogen (SMN) in response to N rates and its interactions with year and tillage treatments

Lin, linear; Quad, Quadratic; Cub, cubic; ns, not significant; N; N rates; Y, Year; T, Tillage.
Parameter estimates for linear and cubic polynomial regression models relating to the ears/m2, grains/ear and grain yield (t/ha) response to year × N interaction

Values in parenthesis are s.e.
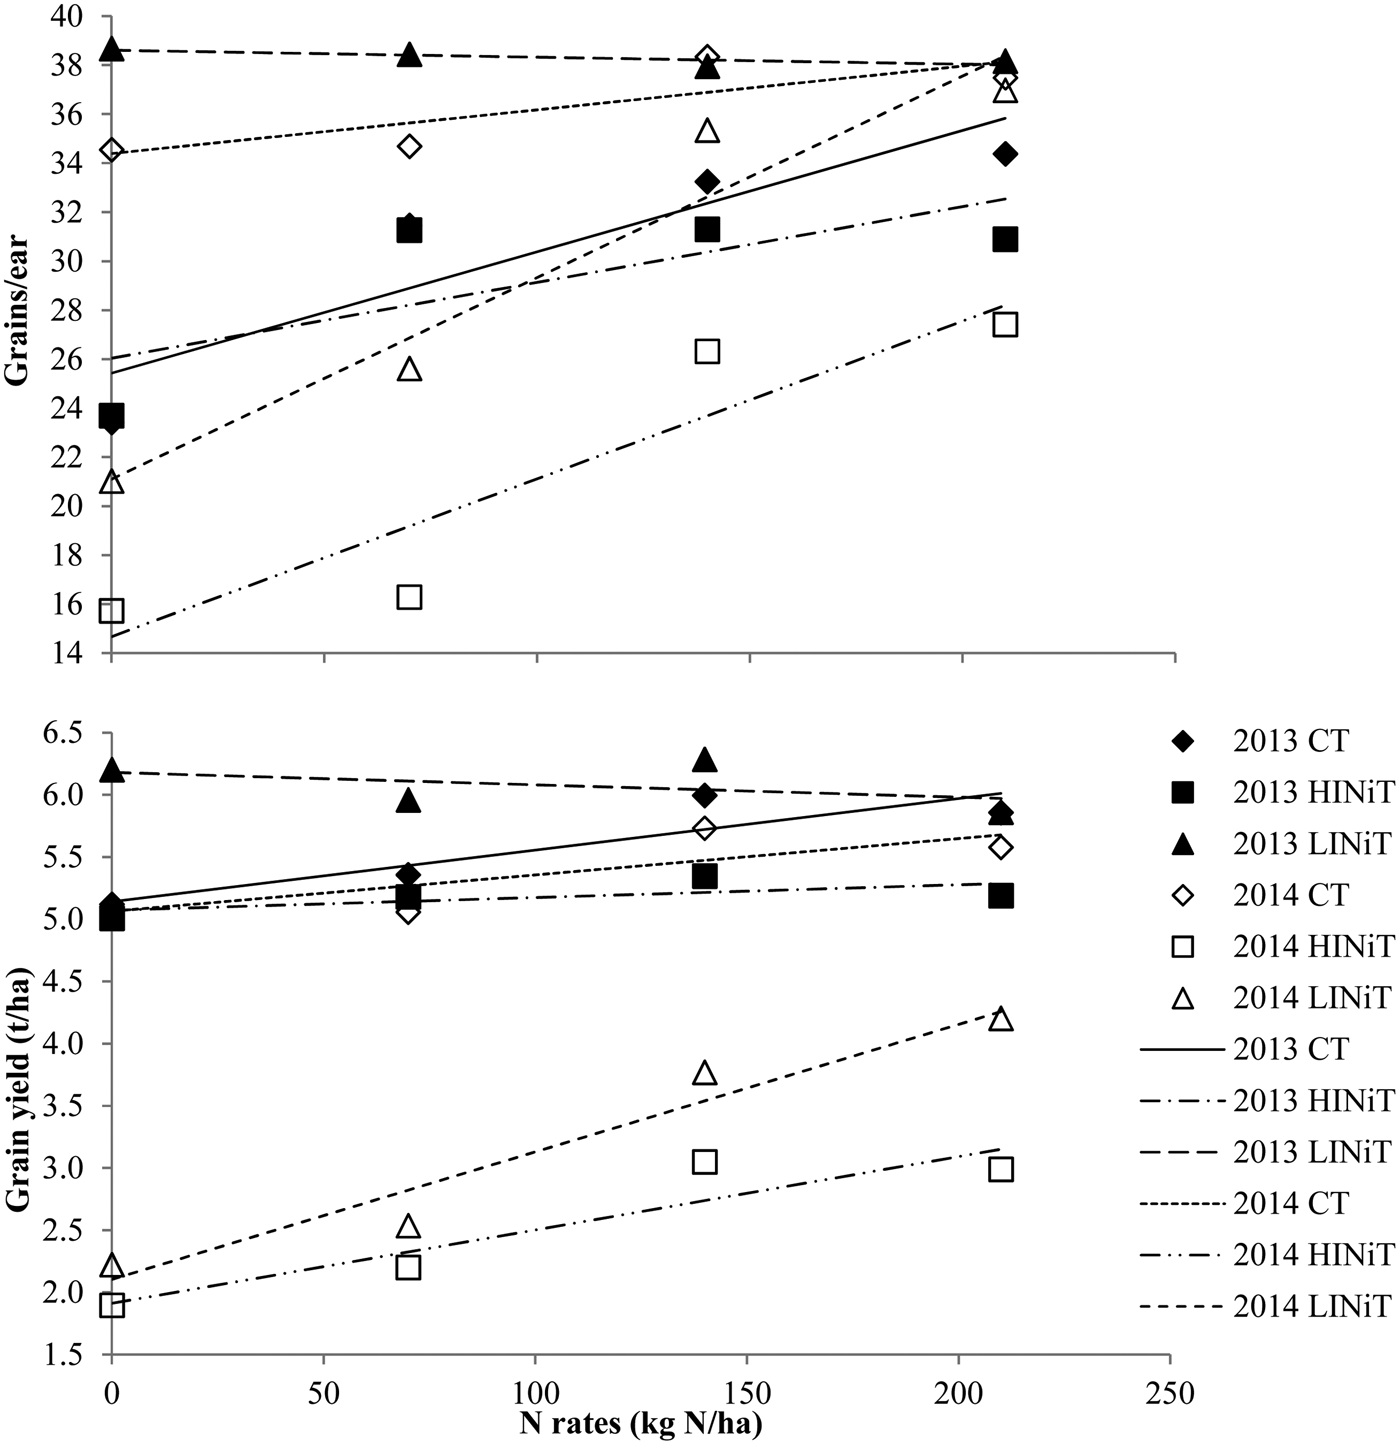
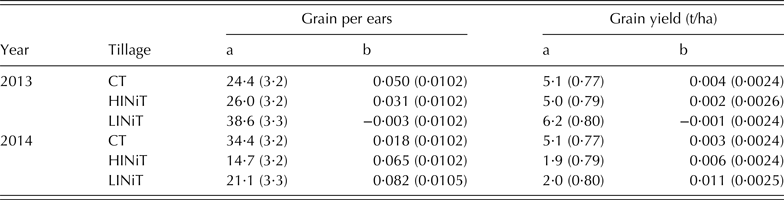
Tillage system had a significant (P < 0·001) effect on number of grains/ear, but varied significantly (P < 0·001) between years. The LINiT treatment produced significantly (P < 0·01) more grains/ear than CT and HINiT in 2013, while in 2014 CT produced significantly (P < 0·001) more grains/ear than LINiT, followed by HINiT (Table 3). There was both significant linear (P < 0·001) and quadratic (P < 0·05) responses of N rate and both linear and cubic (P < 0·05) year × N rate interaction on grains/ear (Table 4). In 2013, grain number per ear increased by up to 70 kg N/ha, while in 2014 there were both quadratic and cubic responses to N rate increase up to 140 kg N/ha (Fig. 2). There was a significant (P < 0·001) linear response of grains/ear to year × tillage × N rate interaction (Table 4). When observing the parameter estimates of the linear response curves, in 2013 LINiT produced more grains/ear compared with CT at all N rates except at 210 kg N/ha, while in 2014 LINiT had similar grains/ear than CT with up to 70 kg N/ha. The HINiT treatment produced the lowest grain number/ear in both years and at all N rates (Fig. 3; Table 6). Grain yield ranged from 2·53 to 6·08 t/ha and was significantly (P < 0·001) influenced by year, tillage and year × tillage interaction (P < 0·001) (Table 3). A significantly (P < 0·05) higher grain yield was seen for LINiT than HINiT and was similar to that produced by CT in 2013, while in 2014 the CT treatment produced a significantly (P < 0·01) higher grain yield than HINiT and LINiT (Table 3). There were both significant linear (P < 0·001) and cubic (P < 0·05) responses of grain yield to N rate (Table 4). Examination of the parameter estimates of the linear response curves shows higher grain yield in 2013 than in 2014 (Fig. 2; Table 5). In 2013, there was no significant effect of N on grain yield while, in 2014 grain yield increased by up to 140 kg N/ha. There was a significant (P < 0·05) linear response of grain yield to year × tillage × N rate interaction (Table 4). When observing the estimates of the linear response curves, the lowest grain yield was under HINiT and LINiT in 2014 at all N rates, while in 2013 differences in grain yield between LINiT and CT were reduced with up to 140 kg N/ha (Fig. 3; Table 6).
Linear response of grains/ear and grain yield (t/ha) to year × tillage × N rate interaction effect. Equations are shown in Table 6.

Parameter estimates for linear polynomial regression models relating to grains/ear and grain yield (t/ha) response to year × tillage × N interaction

CT, conventional tillage; HINiT, high intensity non-inversion tillage; LINiT, low intensity non-inversion tillage. Values in parenthesis are s.e.
Plant nitrogen uptake, grain protein content and nitrogen-use efficiency
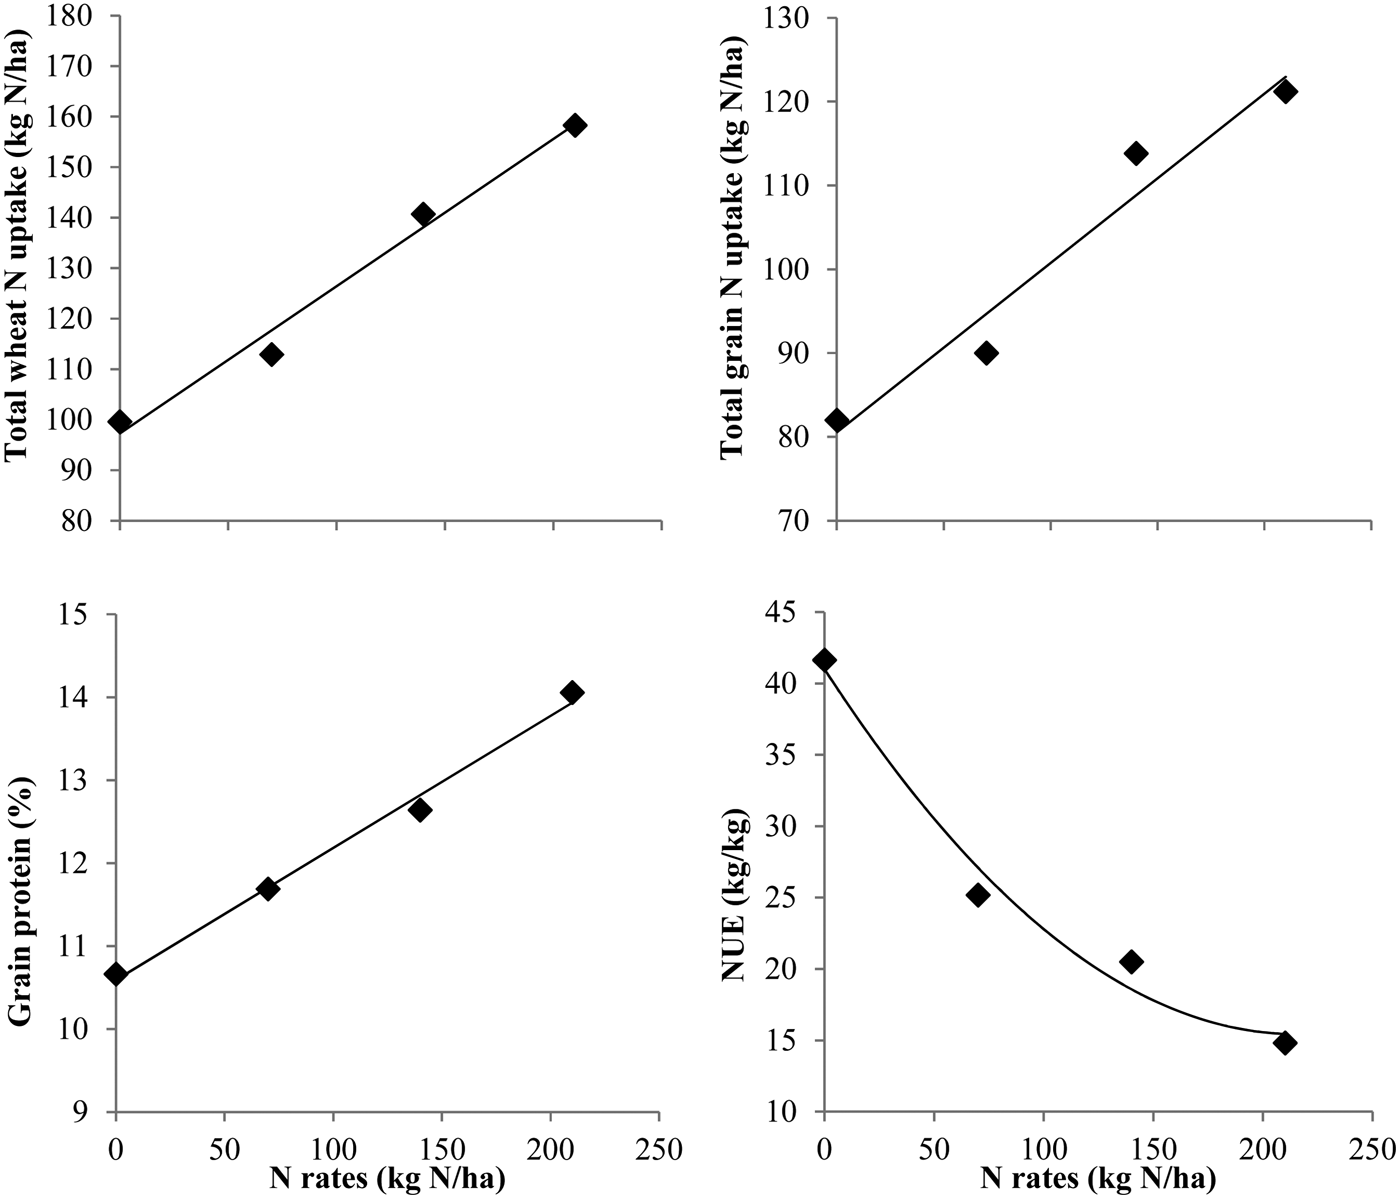
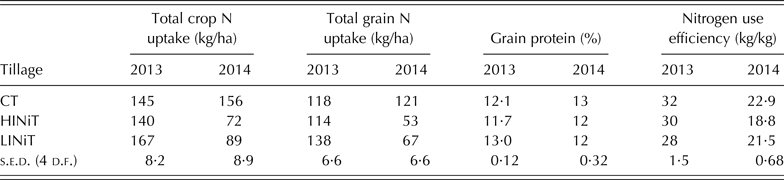
Total wheat N uptake and total grain N uptake were significantly affected by year (P < 0·001), tillage (P < 0·001) and year × tillage interaction (P < 0·001). There was no effect of tillage on total wheat N uptake in 2013, while the plough-based CT resulted in a significantly (P < 0·001) higher total wheat N uptake compared with HINiT and LINiT in 2014 (Table 7). There was a significant (P < 0·001) linear response of total wheat N uptake to N rate with increases in wheat N up to 140 kg N/ha (Fig. 4; Table 8). Total grain N uptake was significantly (P < 0·05) higher under LINiT than HINiT and CT in 2013, while in 2014 CT resulted in a significantly (P < 0·001) higher total grain N uptake compared with HINiT and LINiT (Table 7). There were significant linear (P < 0·001) and quadratic (P < 0·05) responses of grain N uptake to N rate with increases in grain N up to 140 kg N/ha (Fig. 4; Table 8).
Linear and quadratic response of total wheat and grain N uptake (kg N/ha), grain protein (%), and nitrogen use efficiency (NUE, kg/kg) to N rate effect. Equations are shown in Table 8.

Effect of tillage on total wheat and grain N uptake, grain protein content and N-use efficiency

CT, conventional tillage; HINiT, high intensity non-inversion tillage; LINiT, low intensity non-inversion tillage.
Parameter estimates for linear and quadratic polynomial regression models relating to total wheat and grain nitrogen (N) uptake (kg N/ha), grain protein content (%), nitrogen use efficiency (NUE) (kg/kg) and soil mineral nitrogen (SMN) (kg N/ha) responses to N rates

Values in parenthesis are s.e.
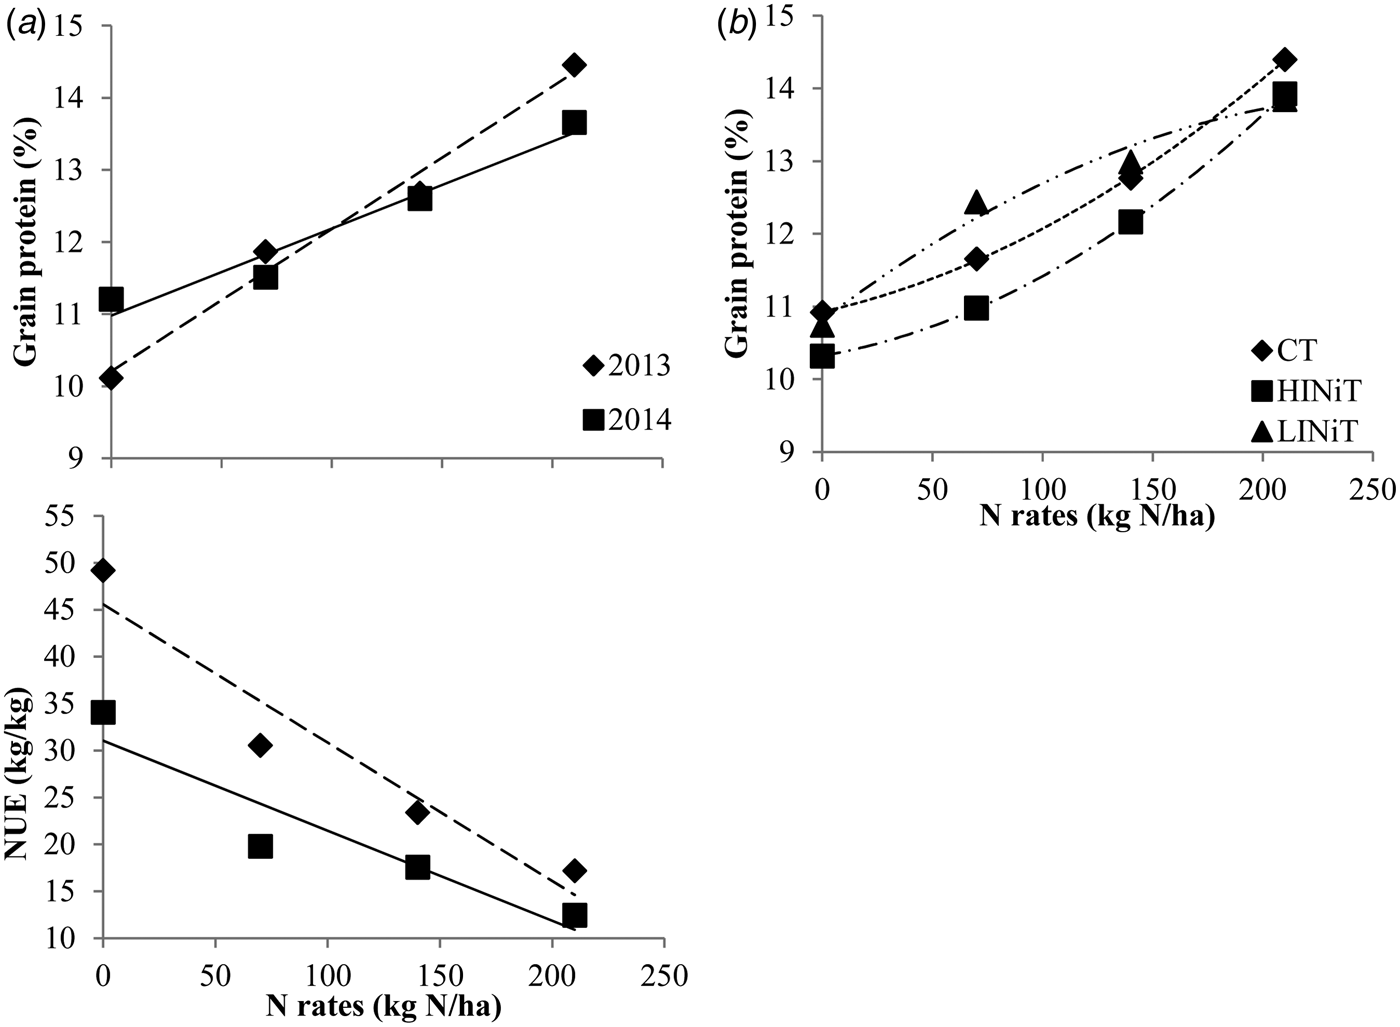
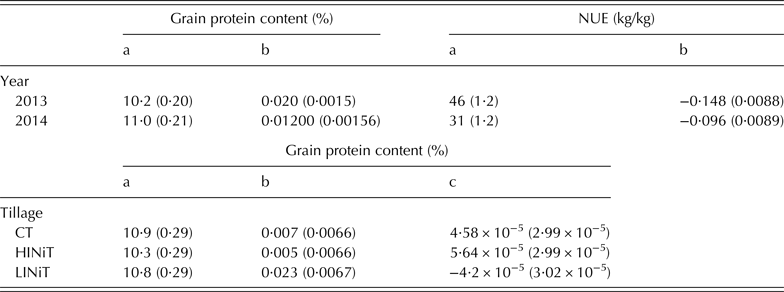
Grain protein content ranged from 10·12 to 14·46%. Tillage significantly (P < 0·001) affected protein content but this varied between years, with LINiT producing significantly (P < 0·001) higher grain protein content than CT and then HINiT in 2013, while in 2014 there was no effect of tillage system on grain protein. Grain protein content had a significant (P < 0·001) linear response to N fertilization (Table 4). There were significant linear (P < 0·001) and cubic (P < 0·05) responses of grain protein to N rate × year interaction. The examination of the parameter estimates of the linear response curves shows significant increases in protein content in 2014 compared with 2013 in unfertilized conditions, while higher protein content was seen in 2013 than 2014 when 210 kg N/ha was applied (Fig. 5; Table 9). There was a significant (P < 0·01) quadratic response of grain protein to tillage × N rate interaction, with only significant differences between tillage treatments at 70 kg N/ha (Fig. 5; Table 9).
Linear and quadratic response of grain protein (%) and nitrogen use efficiency (NUE) (kg/kg) to year × N rate (a) and tillage × N rate (b) interaction effect. Lines represent regression analysis of year: 2013 (- - -) and 2014 (—); and tillage systems: conventional tillage (CT) (···); high intensity non-inversion tillage (HINiT) (-·-); low intensity non-inversion tillage (LINiT) (-··-). Equations are shown in Table 9.

Parameter estimates for linear and quadratic polynomial regression models relating to grain protein content (%) and NUE (kg/kg) responses to year × N rates and tillage × N rate interaction

NUE, nitrogen use efficiency; CT, conventional tillage; HIniT, high intensity non-inversion tillage; LINiT, low intensity non-inversion tillage. Values in parenthesis are s.e.
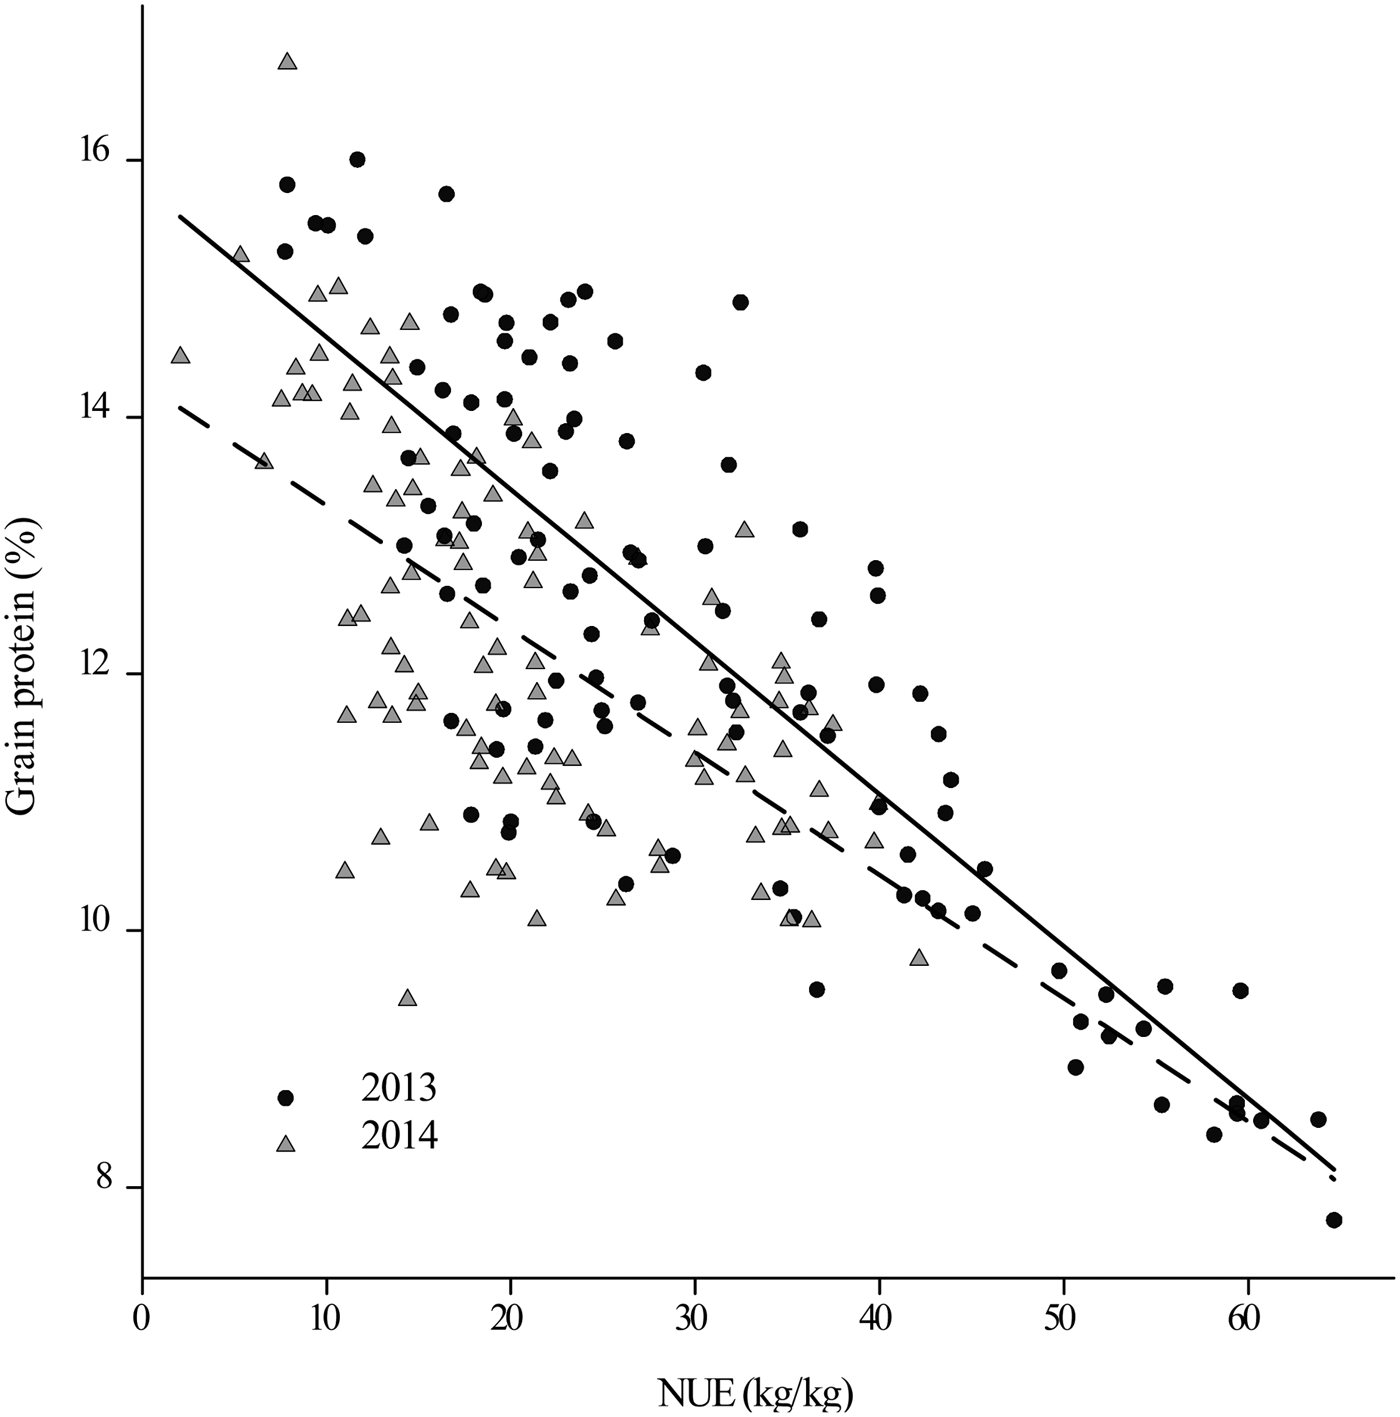
Nitrogen-use efficiency ranged from 12·60 to 49·08 kg/kg. It was significantly affected by year (P < 0·001), tillage (P < 0·01) and year × tillage interaction (P < 0·05) (Table 7). In 2013, there was no significant tillage effect on NUE, while in 2014 both the CT and LINiT treatments resulted in significantly (P < 0·05) higher NUE than HINiT. There were significant (P < 0·001) linear, quadratic and cubic negative responses of NUE to N rate increases (Fig. 4; Table 8). Nitrogen-use efficiency showed a significant (P < 0·001) linear response to year × N rate interaction. In 2013, NUE was higher at all N rates compared with 2014 (Fig. 5; Table 9). When the relationship between NUE and grain protein content was evaluated, a significant, negative correlation were observed in both experiments (2013: y = 15·809–0·119x, R 2 = 0·671, P < 0·001; 2014: y = 14·269–0·096x, R 2 = 0·376, P < 0·001) (Fig. 6).
Grain protein relationships to nitrogen use-efficiency (NUE). Solid line (–) and broken line (- -) represent regression analysis in 2013 and 2014, respectively.

Soil mineral nitrogen
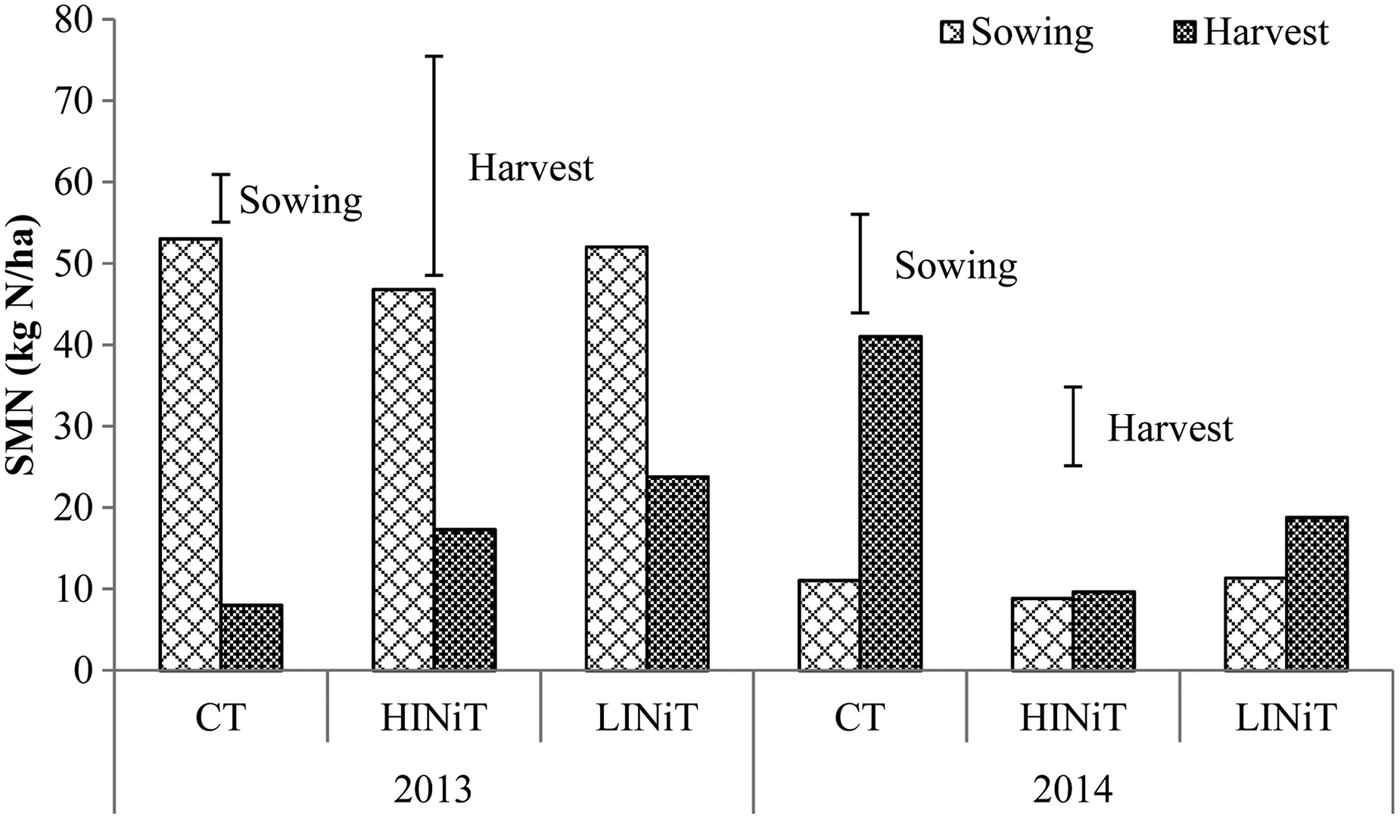
At sowing, SMN content ranged from 8·85 to 53·01 kg N/ha and was significantly affected by year (P < 0·001) and tillage systems (P < 0·01). Conventional tillage and LINiT resulted in a significant overall higher SMN at sowing compared with HINiT. No significant tillage × year interaction effect was observed at sowing (Fig. 7). Regardless of treatments, SMN content at harvest ranged from 1·8 to 77·1 kg N/ha across both years. There was a significant year (P < 0·05), tillage (P < 0·05) and year × tillage interaction (P < 0·001) effect on SMN at harvest. No significant tillage effect was observed on SMN in 2013, while in the second year the plough-based CT resulted in significantly (P < 0·01) higher SMN content compared with HINiT and LINiT (Fig. 7).
Effect of tillage systems on soil mineral nitrogen (SMN) at sowing and harvest. CT, conventional plough tillage; HINiT, high intensity non-inversion tillage; LINiT, low intensity non-inversion tillage. Bars represent LSD, Fisher's Least Significant Difference, at P < 0·05 for treatment means.

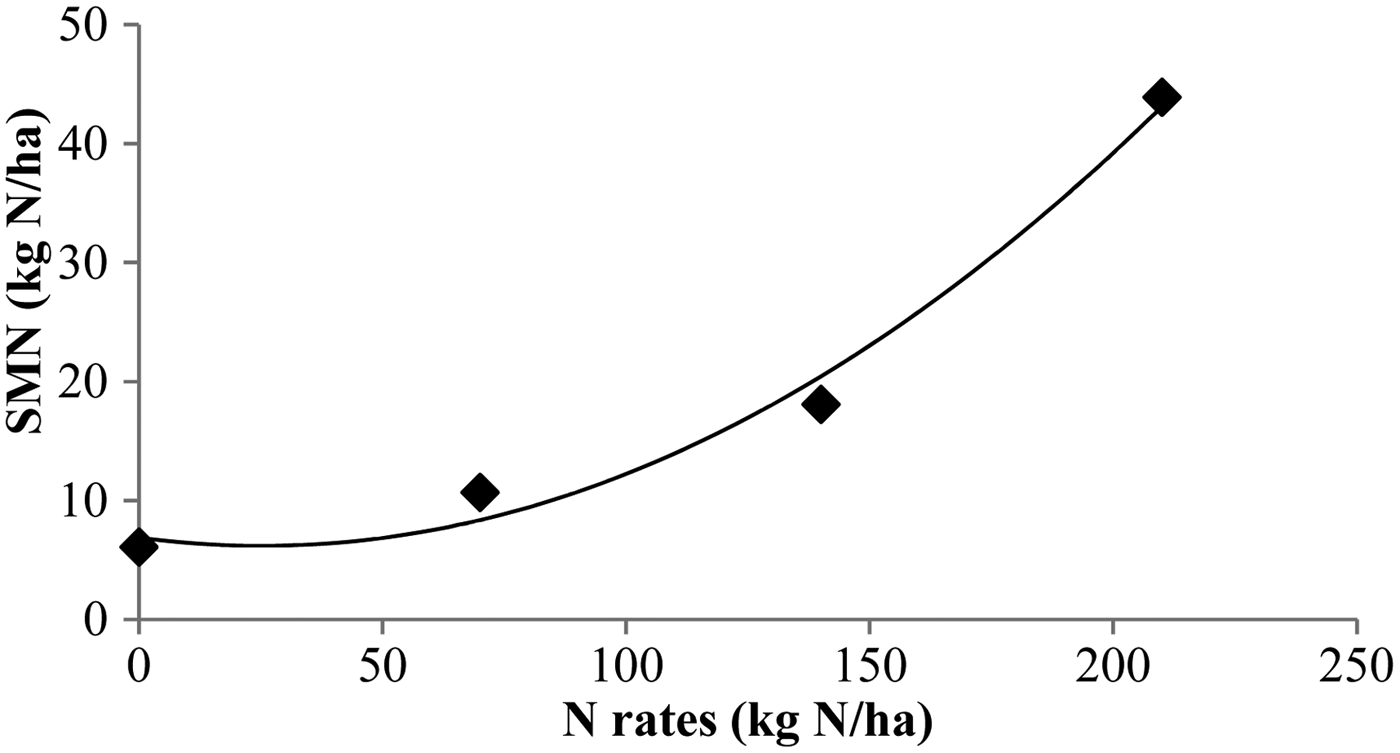
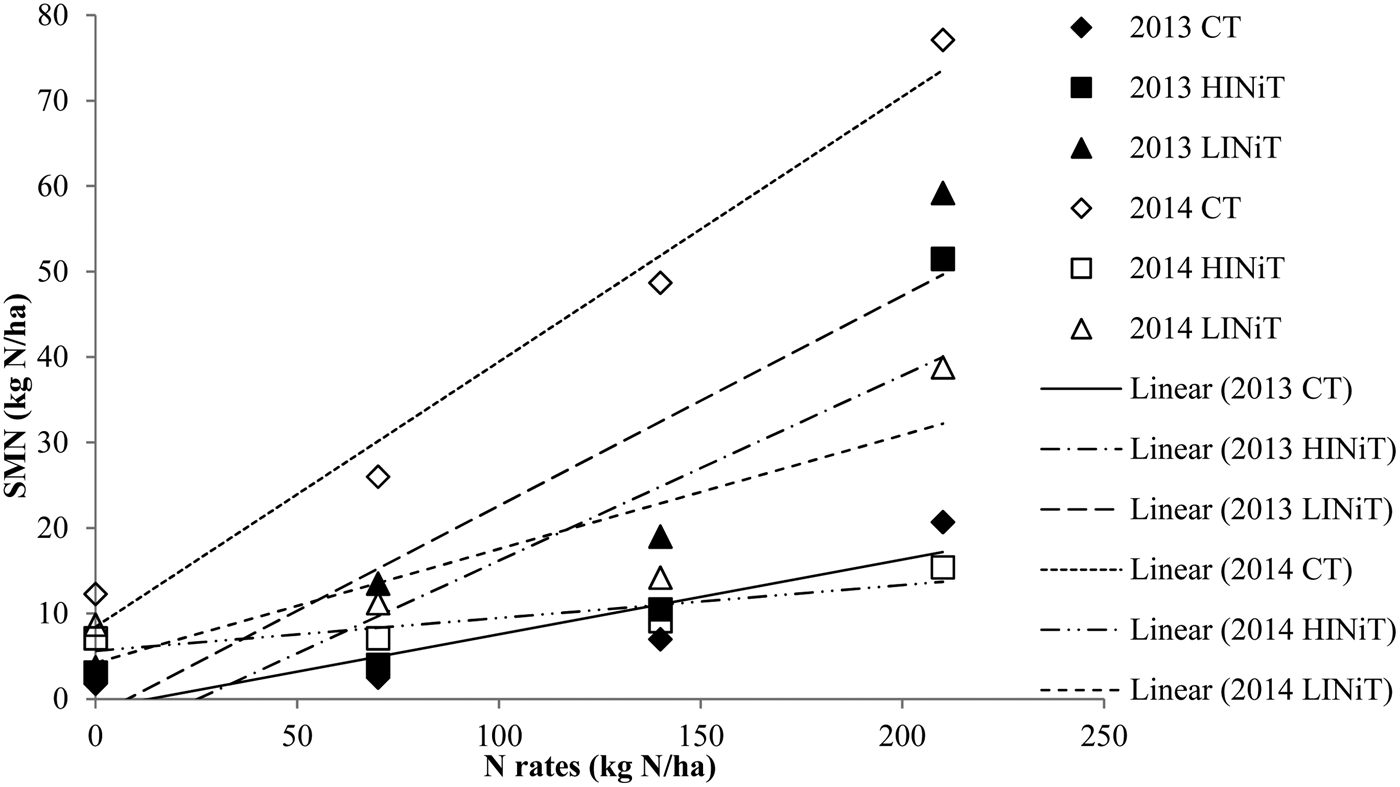
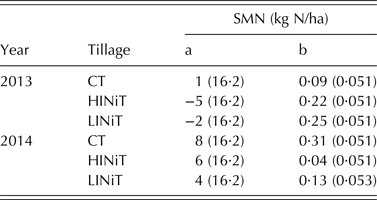
Soil mineral N content at harvest was significantly (P < 0·001) affected by N management, with both positive linear (P < 0·001) and quadratic responses (P < 0·001) (Table 4). The application of 210 kg N/ha resulted in higher SMN content compared with all N rates for both years (Fig. 8; Table 8). There was also a significant linear (P < 0·001) year × tillage × N rate interaction. Examination of the linear curves shows that HINiT and LINiT in 2013 resulted in a positive increase of SMN when 210 kg N/ha was applied. In 2014, CT increased SMN with up to 140 kg N/ha, while LINiT increased SMN when 210 kg N/ha was applied (Fig. 9; Table 10).
Quadratic response of soil mineral nitrogen (SMN) (kg N/ha) to N rate effect. Equations are shown in Table 8.

Linear response of soil mineral nitrogen (SMN) (kg N/ha) to year × tillage × N rate interaction effect. Equations are shown in Table 10. CT, conventional tillage; HIniT, high intensity non-inversion tillage; LINiT, low intensity non-inversion tillage.

Parameter estimates for linear polynomial regression models relating to SMN (kg N/ha) response to year × tillage × N rate interaction

SMN, soil mineral nitrogen; CT, conventional tillage; HIniT, high intensity non-inversion tillage; LINiT, low intensity non-inversion tillage. Values in parenthesis are s.e.
Soil moisture content
Soil moisture was significantly (P < 0·001) affected by year. Tillage effect on soil gravimetric moisture content was also significant (P < 0·001) and varied between assessment times and years (P < 0·001) (Fig. 10). In 2013, there was no significant effect of tillage on soil moisture content at sowing, while at harvest LINiT resulted in significantly (P < 0·05) higher soil moisture content than CT and was similar to that of HINiT. In 2014, CT resulted in significantly (P < 0·01) lower soil moisture content than HINiT and LINiT at sowing, while no significant tillage effect was observed on soil moisture content at harvest.
Effect of tillage on soil gravimetric moisture content at sowing and harvest. CT, conventional plough tillage; HINiT, high intensity non-inversion tillage; LINiT, low intensity non-inversion tillage. Bars represent LSD, Fisher's Least Significant Difference, at P < 0·05 for treatment means.

DISCUSSION
Plant establishment and early crop growth were affected by modifications of the different seedbed conditions created by the tillage systems adopted. The greater soil disturbance generated by CT treatment in this clay soil created a level and even seedbed and incorporated more plant residues into the soil, providing both better seed–soil contact and subsequently a significantly higher germination and consequently plant density compared with HINiT and LINiT in 2013. Contrasting seasonal weather conditions over the experimental period strongly influenced the impacts of management. High rainfall at the usual time for UK spring wheat sowing in 2014 delayed the actual spring wheat drilling operations, resulting in fewer plants established than in 2013. Less soil movement and greater soil cover under LINiT produced a coarser seedbed, negatively affecting seed–soil contact and reducing crop establishment compared with CT and HINiT in 2014. Several other authors have also reported that a coarser seedbed can affect plant density negatively (Pietola & Tanni Reference Pietola and Tanni2003; Rieger et al. Reference Rieger, Richner, Streit, Frossard and Liedgens2008; Känkänen et al. Reference Känkänen, Alakukku, Salo and Pitkänen2011). Variations of seedbed conditions that affected plant establishment also later affected ears/m2, as also reported by McMaster et al. (Reference McMaster, Wilhelm and Bartling1994). Reduction of tillage intensity and the greater soil coverage under LINiT created higher seedbed variability, affecting tiller production and giving fewer ears compared with CT and HINiT. Higher plant density under the plough-based CT preparation contributed to greater numbers of ears/m2, as also reported by others (López-Bellido et al. Reference López-Bellido, López-Bellido., Castillo and López-bellido2000; Boomsma et al. Reference Boomsma, Santini, West, Brewer, McIntyre and Vyn2010; Brennan et al. Reference Brennan, Hackett, McCabe, Grant, Fortune and Forristal2014).
The drier conditions experienced in 2013 (292 mm v. 377·2 mm for the long-term mean) negatively affected wheat crop growth. Greater ear numbers produced under CT and HINiT appear to have created greater competition for resources, resulting in fewer grains/ear compared with LINiT. More soil water availability in a dry season under LINiT could have partly offset poorer establishment and fewer numbers of ears, resulting in a greater number of grains/ear and consequently similar grain yield to CT in 2013. Similarly, Bonfil et al. (Reference Bonfil, Mufradi, Klitman and Asido1999) reported no difference in grain yield among CT and non-inversion tillage with seasonal rainfall <300 mm. In contrast, in a higher rainfall season such as in 2014, poorer establishment and plant growth followed by fewer numbers of ears and grains/ear which caused the lower grain yield under HINiT and LINiT compared with CT. Brennan et al. (Reference Brennan, Hackett, McCabe, Grant, Fortune and Forristal2014) reported that a greater plant density under CT can potentially contribute to higher grain yield, mostly when weather conditions are less suitable for better crop establishment under reduced tillage.
Incorporation of mineral N fertilization increased ears number/m2 in 2013. The greater plant establishment observed in 2013 contributed to the higher ear number obtained in this experiment, as also reported by Brennan et al. (Reference Brennan, Hackett, McCabe, Grant, Fortune and Forristal2014). Promoting nutrient availability by increasing N supply also increased grain number/ear in the present study and was also reported by Alijani et al. (Reference Alijani, Bahrani and Kazemeini2012) and Ferrise et al. (Reference Ferrise, Triossi, Stratonovitch, Bindi and Martre2010). At higher N rates, differences between tillage systems across years were reduced, although HINiT required higher N supply to produced similar grains/ear than that produced under CT and LINiT in both years. Such an increase of grain number by N fertilization resulted in higher grain yield when up to 140 kg N/ha was applied in 2014. However, in 2013, dry conditions could have generated a more significant accumulation of N in the soil profile. This may have contributed to a higher grain yield under unfertilized conditions and the lack of a marked wheat yield response to N applied fertilization, as reported by others (López-Bellido et al. Reference López-Bellido, Fuentes, Castillo and López-Garrido1998; Abad et al. Reference Abad, Michelena and Lloveras2005; Miao et al. Reference Miao, Wang and Li2015). While the tillage treatments did not affect the grain yield overall response to N, there were differences across the years. In 2013, higher yield under LINiT at low N rates is a result of more residual N being available, while differences between tillage systems were reduced with increasing N rates. Brennan et al. (Reference Brennan, Hackett, McCabe, Grant, Fortune and Forristal2014) also reported greater yields under low N rates in reduced tillage due to high soil residual N. In 2014, higher yields under CT compared with HINiT and LINiT at all N rates suggested, however, that additional N was required in order to produce similar grain yields to those of CT, as Rieger et al. (Reference Rieger, Richner, Streit, Frossard and Liedgens2008) and Halvorson et al. (Reference Halvorson, Wienhold and Black2001) also reported.
Generally, there is a negative relationship between grain protein and final grain yield due to energy constraints and N dilution effects (Terman et al. Reference Terman, Raming, Dreier and Olson1969; Gooding & Davies Reference Gooding and Davies1997). This was the case in 2014, when high rainfall conditions increased crop biomass and yield resulting in reduced protein content, particularly under CT. However, grain protein and grain yield correlation is not always negative (Kramer Reference Kramer1979; Johnson & Mattern Reference Johnson, Mattern, Olson and Frey1987), as in 2013, when higher grain yield and protein content was produced under LINiT. The ability of the soil under LINiT to conserve more moisture could have increased N availability, boosting grain N uptake and resulting in higher grain protein content, as reported by Gao et al. (Reference Gao, Lukow and Grant2012). This explains the greater protein content under LINiT compared with CT and HINiT at low N rate of 70 kg N/ha, while increasing N supply reduced differences between tillage systems.
Regardless of the N fertilization effect on grain yield, total wheat and grain N, as well as protein content increased when N supply was increased. Campbell et al. (Reference Campbell, Davidson and Warder1977) and Halvorson et al. (Reference Halvorson, Wienhold and Black2001) also reported higher N uptake when N availability was increased. While grain yield increased by up to 140 kg N/ha in 2014 or was not affected by N fertilization as in 2013, higher grain protein content was obtained by up to 210 kg N/ha in both years, indicating that higher N supply may only be justified for improving grain protein content. An inverse relationship between grain protein and NUE occurred across both years. This indicates that lower NUE is likely to occur as additional N is supplied to obtain greater grain protein content, as also reported by Huggins et al. (Reference Huggins, Pan, Smith, Kruger, Yorgey, Chen, Collins, Feise, Frear, Granatstein, Higgins, Huggins, MacConnell, Painter and Stöckle2010).
Higher N availability under CT resulted in higher wheat N uptake in 2014 which, combined with higher grain yield, showed a higher NUE compared with HINiT. While higher NUE under LINiT in 2014 suggests that the N available was used efficiently to produce the final grain yield under this tillage system, higher grain yield, however, does not always result in higher NUE (Giacomini et al. Reference Giacomini, Machet, Boizard and Recous2010; Brennan et al. Reference Brennan, Hackett, McCabe, Grant, Fortune and Forristal2014). This was observed in 2013, when tillage systems did not affect NUE, although LINiT resulted in a higher grain yield. Higher SMN at sowing and harvest time in 2013 compared with 2014 revealed the accumulation of N in the soil as a result of the drier weather conditions experienced in 2013. While no leaching measurements were made, in a wet season such as in 2014, low SMN content seems to be a possible result of N leaching. Maximum soil disturbance with CT can greatly increase organic matter mineralization, increasing SMN to meet crop N demand (Gruber et al. Reference Gruber, Möhring and Claupein2011; López-Bellido et al. Reference López-Bellido, Muñoz-Romero and López-Bellido2013; Yagioka et al. Reference Yagioka, Komatsuzaki, Kaneko and Ueno2015). Conventional plough-based tillage showed a higher SMN level at harvest compared with HINiT and LINiT as a result of increasing mineralization, and low N losses with the higher temperatures and lower rainfall recorded before harvest time in 2014. Increased crop N uptake seems to have reduced differences in SMN content between tillage systems at low N rates in both years, as a result of increasing crop N demand towards crop maturity. This resulted in higher SMN with application of 210 kg N/ha, as also reported by others (Fuentes et al. Reference Fuentes, Flury, Huggins and Bezdicek2003; Zhao et al. Reference Zhao, Qiu, Cao, Zheng, Zhou and He2014). Interactions between tillage systems and N fertilization effects on SMN and final grain yield have been reported elsewhere (Alijani et al. Reference Alijani, Bahrani and Kazemeini2012; Brennan et al. Reference Brennan, Hackett, McCabe, Grant, Fortune and Forristal2014). The present study, however, shows that tillage systems and N fertilization were more important in defining SMN content and final grain yield than their interactions, as also reported by Feng et al. (Reference Feng, Ning, Li, Han, Han, Li, Sun and Zhang2014).
Soil gravimetric moisture content varied across 2013 and 2014 and prevailing weather conditions. Maximum soil disturbance created by CT breaks the soil water-related pores and presumably also increases water loss by evaporation (Reicosky et al. Reference Reicosky, Reeves, Prior, Runion, Rogers and Raper1999), resulting in lower soil moisture content under CT compared with HINiT and LINiT at sowing in 2014. Moisture content, before harvest time in 2013, shows that reducing tillage intensity without soil inversion and higher presence of plant residue cover under LINiT resulted in higher soil moisture content. Reducing soil disturbance can leave more water-filled pores (Bescansa et al. Reference Bescansa, Imaz, Virto, Enrique and Hoogmoed2006), while soil cover could reduce evaporation loss and run-off, and potentially reduce soil temperatures and slow soil drying (Beyaert et al. Reference Beyaert, Schott and White2002; De Vita et al. Reference De vita, Di Paolo, Fecondo, Di Fonzo and Pisante2007), thus conserving soil moisture (Bescansa et al. Reference Bescansa, Imaz, Virto, Enrique and Hoogmoed2006; Malhi et al. Reference Malhi, Johnston, Schoenau, Wang and Vera2007). While rapid crop growth possibly increased transpiration during more limited rainfall, the improved ability of the soil under LINiT to potentially conserve moisture may also have encouraged crop growth especially under moisture-limiting conditions. This may be a possible explanation for the similar final grain yield between LINiT and CT. Since springs and summers are expected to be drier in the UK as a result of climate change (Christensen & Christensen Reference Christensen and Christensen2007; Jenkins et al. Reference Jenkins, Murphy, Sexton, Lowe, Jones and Kilsby2009) the greater water availability observed under LINiT could encourage its greater adoption for autumn- and spring-sown wheat when moisture availability is likely to be limited on this soil type.
CONCLUSION
The performance of the evaluated soil and N management practices was strongly influenced by weather conditions, particularly rainfall patterns in the present study. It suggests that in this location in clay soil under drier conditions the capacity of LINiT to conserve soil moisture can potentially offset poor establishment and crop growth, and result in a similar yield to those under plough-based CT, while also ensuring a good level of grain protein content. When rainfall is not a limiting factor, reduced tillage practices are more vulnerable to poorer establishment and lower NUE, and give poorer grain yields compared with CT. N fertilization can significantly promote wheat growth, although under dry conditions with higher residual soil N, the application of N fertilization has little effect on grain yield. In contrast, N fertilization promotes greater grain yield under low residual N levels. Higher N supply is required, however, to increase grain protein content, although this will decrease NUE. Results for these seasons with contrasting weather conditions show the difficult decisions faced by farmers to guarantee more stable and commercially attractive production in a changing climate.
Financial support from the Royal Agricultural University for the studentship is greatly acknowledged.