Topic-based shifting refers to changes in speech that accompany changes in the topic at hand, and for this paper, also includes analogous changes in response to associative priming in the lab. Examples include an African American high-schooler who used more features of AAVE when discussing her friends and family than when discussing school and her career plans (Rickford & McNair-Knox, Reference Rickford, McNair-Knox, Biber and Finegan1994), and New Zealand participants who shifted their wordlist pronunciation to be more Australian-like after having read a series of facts about Australia (Drager, Hay, & Walker, Reference Drager, Hay and Walker2010). In contrast to interlocutor-based effects, where changes in speech can be attributed, at least in part, to the recent, external input from the interlocutor (Goldinger, Reference Goldinger1998), in topic-based shifting the shifts can only be driven by speaker-internal representations of the activated dialects/variants. Therefore, topic-based shifting allows us to explore what exactly is activated when people think of a dialect, and how and when these thoughts impact their own speech production.
The particular focus of this study is on how nonnative dialect (D2) representations are impacted by long-term exposure to the D2. The idea that a speaker's relative D2 exposure should impact how much they shift between the D1 and D2 in response to topic is a prediction of exemplar accounts of language processing. In such models, previously encountered speech is cognitively stored complete with fine phonetic detail and contextual labeling (see Foulkes & Docherty, Reference Foulkes and Docherty2006). Particular situations, and particular topics, can activate associated contextual labeling, which activates the corresponding phonetic detail, which then influences speech production (Drager, Hay & Walker, Reference Drager, Hay and Walker2010:31; Mendoza-Denton, Hay, & Jannedy, Reference Mendoza-Denton, Hay, Jannedy, Bod, Hay and Jannedy2003:134–137; see also Bell, Reference Bell, Eckert and Rickford2001:146). Since participants with more exposure to a D2 will have more D2 exemplars to activate, Love and Walker (Reference Love and Walker2013) predicted that topic-based shifts between the D1 and D2 will be larger in speakers with more D2 experience, a proposal that is echoed elsewhere in the sociolinguistic literature: “… priming could presumably only influence forms already in the grammar, providing a natural limitation on speaker's sociolinguistic performance by virtue of language learning more generally” (Campbell-Kibler, Reference Campbell-Kibler and Babel2016:141; see also Le Page & Tabouret-Keller, Reference Le Page and Tabouret-Keller1985:184; Sharma, Reference Sharma2018).
In a study that explicitly compared speakers with more and less D2 experience, Sanchez, Hay, and Nilson (Reference Sanchez, Hay and Nilson2015) used both experimental and corpus data to examine whether New Zealanders shifted to more Australian-like variants of three vowels when the topic or prime was Australian-themed. They found an interaction between speakers’ experience with Australian EnglishFootnote 1 and their quality of topic-based shifting, but only on the dress vowel, which is not a socially salient marker of AusE versus NZE to New Zealanders. Critically, they did not find an interaction on the highly salient kit vowel, or the middling-conscious trap vowel: speakers shifted toward AusE on these variables regardless of their degree of exposure to AusE.
The fact that we see uneven topic-based shifting across different variables is unsurprising. It has long been noted in the style-shifting literature that some variables are more prone to change than others (e.g., Labov, Reference Labov1972), with a general understanding that the most flexible variables are the ones that speakers recognize as being socially meaningful (e.g., Irvine, Reference Irvine, Eckert and Rickford2001:22; Nycz, Reference Nycz2018). The fact that Sanchez et al. (Reference Sanchez, Hay and Nilson2015) found that speakers make similar shifts on the stereotypical features of dialects regardless of their experience suggests that even fairly inexperienced speakers have robust representations of the stereotyped features of a dialect, and when the idea of a dialect is activated, it is critically these stereotypical markers that are activated. Experience, then, may matter most/only in terms of what speakers do with less stereotypical features.
It should be noted, however, that Sanchez et al. (Reference Sanchez, Hay and Nilson2015) were examining shifts on phonetic differences between the two dialects. These types of variables allow speakers to shift toward the D2 without crossing a categorical boundary and usually while staying in a D1-consistent production space. Speakers may be less likely to style-shift across (allo)phonological boundaries (Hashimoto, Reference Hashimoto2019:28), and it may be the case that in looking at phonological differences between dialects, we will observe a larger effect of experience on topic-based shifting, in ways that interact with second-dialect acquisition.
In the current study we explore the role of experience on how speakers of US English and British English shift their speech by comparing the speech of migrant and nonmigrant speakers and looking at three phonological variables that differentiate Standard Southern British English (SSBE), and Standard American English (SAE): rhoticity, intervocalic /t/, and the bath/trap split.Footnote 2 In SAE, /ɹ/ can appear in coda position, while in SSBE it cannot, and has vocalized. In SSBE, an intervocalic /t/ preceding an unstressed syllable is aspirated (with a stop and a burst release) whereas in SAE it is flapped: the tongue makes only brief tip contact, the release is unaspirated, and voicing does not stop (Zue & Laferriere, Reference Zue and Laferriere1979).Footnote 3 For the bath-trap split, in SSBE vowels in a subset of words that were historically in the trap class lengthened and merged with the backed and lowered /a:/ of father (Wells, Reference Wells1982); the words remain in the trap class in SAE. However, in England a hypersalient bath-trap split isogloss runs across the Midlands from East Anglia to the Welsh border, and north of the isogloss there is no split (Gupta, Reference Gupta2005; Wells, Reference Wells1982).
These three variables were chosen because they have all been described as salient, shibboleth-like markers of US/UK English (Trudgill, Reference Trudgill1986; Walker, Reference Walker2014:126–127; Wells, Reference Wells1982), and this is where most of the literature has suggested we will see both style-shifting and second dialect acquisition (i.e., Labov, Reference Labov1972; Nycz, Reference Nycz2018; Siegel, Reference Siegel2010:121). Moreover, all three variables represent phonological differences between the dialects, enabling us to test for effects of D2 experience on topic-based shifting when such shifts would move speakers to more clearly D2 production spaces.
METHODOLOGY
Participants
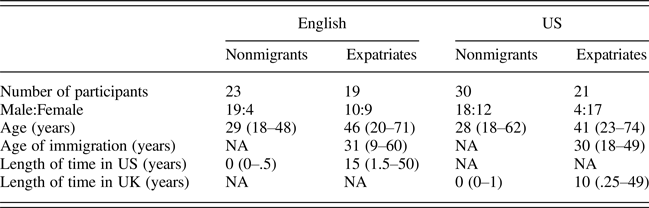
This study was conducted in Columbus, Ohio, and London, UK, in offices, public spaces, and at participants’ homes. Expatriates and nonmigrants were recruited in both locationsFootnote 4. 102 people participated in this study, but six were removed from analysis for not being easily categorized as English or American, three were removed for technological problems, and one participant was removed for being the lone English speaker from a rhotic dialect region (Blackburn). Of the 93 remaining participants, 23 were in the English nonmigrant group, 19 were English expatriates in Ohio, 30 were US nonmigrants, and 21 were US expatriates in London. Table 1 shows the gender and age range for each group. Note that the groups are not well matched for age and gender; expatriates tend to be older than nonmigrants, and some groups are heavily male, while others are heavily female. Additionally, due to recruitment constraints, there were no restrictions on where, within England or the US, participants came from, which means there is dialectal variation within each subgroup (see Appendix A). The relevance of this variation for the bath/trap analysis will be discussed later.
Summary of speaker attributes, by speaker category (range of values in brackets)

Experiment Design
The experiment was run on a computer (using EPrime or SuperLab) and involved a rotating reading and transcription task. There were four reading blocks, each designed around a UK or US theme. Each reading block was followed by a transcription block, which involved participants transcribing a mix of English and US speakers whose recordings were mixed with noise. The transcription task will not be discussed further in this paper (see Walker, Reference Walker2018).
Each of the reading blocks consisted of 70 words or collocations, which appeared individually on the screen. Participants were instructed to read each word aloud in their regular voice, while wearing a Shure 54 head-worn microphone, and being recorded onto a Zoom H4N portable digital recorder (44100 Hz, 16 bit). Of the 70 words in each block, 40 were specific to one of the following topics: US football (mostly regarding the National Football League [NFL]), US government, UK football (mostly regarding the English Premiere League [EPL]), and UK government (see Appendix B). In the analysis below, these four topics are collapsed along two dimensions: topic nationality refers to UK government and EPL football versus US government and NFL football, while topic genre refers to UK and US government versus EPL and NFL football. The purpose of the topic-specific terms was to prime the associated dialects. The remaining 30 words in each block were “neutral” in that they were not related to the themes, and there were 10 words for each of the three variables of interest in this paper: non-prevocalic /ɹ/, intervocalic /t/, and bath/trap (see Appendix C). Neutral words were included, and are the focus of the analysis in this paper, to confirm that observed topic-based shifting reflects systemic changes to the linguistic system and is not an artifact of the topic-specific words themselves, which might already be biased in their production toward more topic-consistent pronunciations (Hashimoto, Reference Hashimoto2019; Hay & Foulkes, Reference Hay and Foulkes2016; Yaeger-Dror & Kemp, Reference Yaeger-Dror and Kemp1992).Footnote 5 While the themed words in a block were the same across participants, the neutral words were randomized across blocks.
The order of presentation of themed blocks varied across participants, but the two US and two UK topics were always adjacent. While participants were not explicitly told that the blocks were themed, each block began with ten theme-specific words to set the topic, and participants reported noticing the themes. The order of presentation of the remaining 30 topic-specific and 30 topic-neutral words was random. After finishing the experiment, participants were then interviewed. The interviews are not being analyzed in this paper, though comments participants made during the interviews inform the interpretation of results.
Data Processing and Analysis
The data in this study were analyzed both auditorily and acoustically, so that we could investigate perceptually clear, categorical shifts between dialect variants as well as more subtle, subphonemic shifts. For auditory analysis, neutral words were extracted and categorically coded for intervocalic /t/ realization (flap, glottal stop, or canonical /t/), rhoticity (rhotic or nonrhotic), or bath realization (bath or trap). The author (a nonrhotic, native speaker of New Zealand English) coded all tokens, and a rhotic, native speaker of US English coded ~75% of the tokens. Neither coder was blind to the research questions, but they were blind as to which topic blocks the tokens had been extracted from. Their agreement rates for intervocalic /t/ were 99% (with a Kappa Statistic of 0.97), 94% for bath (Kappa = 0.88), and 93% for rhoticity (Kappa = 0.85). Kappa statistics over .7 are usually considered to reflect satisfactory rates of agreement (Clopper, Reference Clopper, Di Paolo and Yaeger-Dror2011:190; Landis & Koch, Reference Landis and Koch1977:165), and the author's judgments will be reported in this study.
All tokens were also acoustically analyzed to explore whether there was any subphonemic shifting occurring in cases where there weren't categorical shifts. Each reading block was transcribed and run through the Penn Forced Aligner (Yuan & Liberman, Reference Yuan and Liberman2008), which automatically segmented the files at the phonemic level. The resulting TextGrids were hand-checked and boundaries were adjusted where there was clear alignment error. Formant and duration values were then extracted automatically using Praat, which was set to a window length of 0.025 seconds and to find five formants under 4500, 5000, 5500, or 6000 Hz, depending on which settings appeared to best track formants for each speaker. Formant measures were taken at 5% intervals throughout the duration of the vowel, starting at 10% into the segment, and ending at 90%.
To assess which factors contributed to variance in the data, mixed effects logistic regression models were built for the auditory data, and mixed effects linear regression models for the acoustic measures. All models included random intercepts for Speaker and Word, and random slopes for topic nationality and topic genre when included as fixed effects, although these were removed when models did not converge (see table captions). Each analysis began with a full model with interactions for topic, group, and any critical linguistic factors, and factors/interactions were removed in a step-down process based on model comparison using a likelihood ratio test (α = 0.05).
RESULTS
Intervocalic-t
There were 3904 usableFootnote 6 /t/ tokens extracted from the reading blocks. Of these, 61 were coded as glottal stops, which came predominantly from one English expat (n = 35), and one US expat (n = 18). For the purpose of analyzing categorical shifts between variants, these glottal variants have been collapsed with canonical [th] as being “English” /t/ (in opposition to “American” flaps). Table 2 shows the distribution of variants across the four groups of speakers. Only a handful of tokens from either group of English speakers were coded as flaps, and English expatriates did not have higher rates of flap than English nonmigrants, suggesting no acquisition of flapped /t/. US expatriates, on the other hand, have more English /t/ than US nonmigrants. It is worth noting that US nonmigrants produce “English” /t/ 12% of the time, consistent with work showing that the variant does show up, albeit infrequently, in SAE (German, Carlson, & Pierrehumbert, Reference German, Carlson and Pierrehumbert2013:237; Riehl, Reference Riehl2003).
Percentage of /t/ tokens coded as American ([ɾ]) or English ([th], [ʔ]), with n in parentheses. Total n = 3904

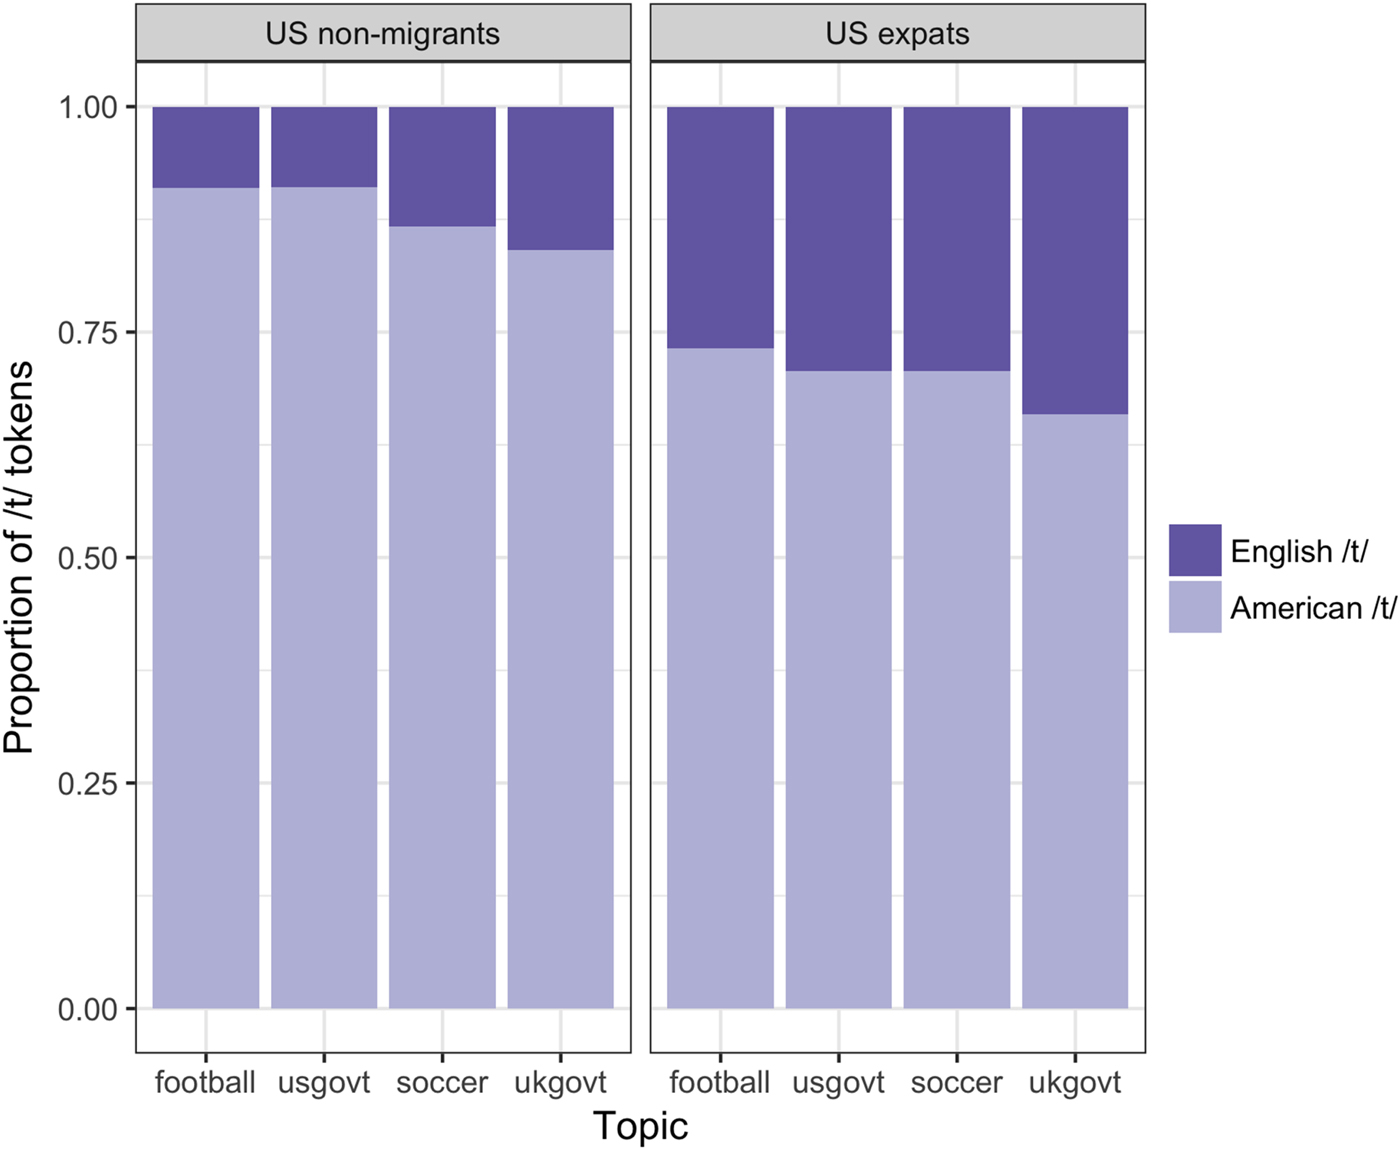
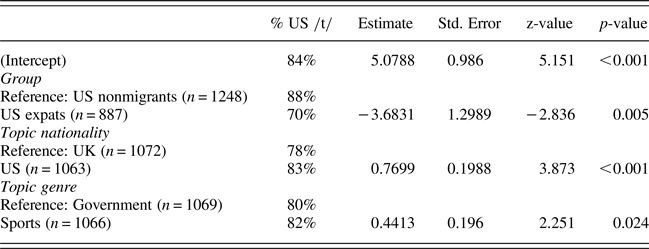
Because of the negligible variance in /t/ realization for English speakers, they were excluded from the statistical investigation of categorical differences in /t/. Table 3 shows the coefficients from the best-fit model of /t/ realization. The model confirms the patterns seen in Table 2: US expatriates are acquiring English /t/ relative to US nonmigrants. There is also a main effect of both topic factors: Americans have more released /t/ when talking about English topics compared to American topics, but also when talking about government versus sports topics (Figure 1). This highlights the pre-existing variability and social meaning of intervocalic /t/ within US English. There is no interaction between speaker group and topic: both expats and nonmigrants produce more English /t/ with English topics, at similar rates.
Proportion of /t/ tokens coded as American ([ɾ]) or English ([t], [ʔ]) based on topic and migrant status, for American participants (n = 2135).

Model coefficients for best fit model of categorical /t/ realization. Model does not include slopes for topic because it does not converge when they are included. Percentage US /t/ is calculated from raw data and reflects group means; for the intercept it reflects the raw data mean for US nonmigrants when the topic was UK government. Total n = 2135

The purpose of the acoustic analysis is to look for subphonemic differences in /t/ realization. That is, within tokens coded as released, or tokens coded as flaps, were there subtle phonetic differences in realization depending on the block topic or the migrant status of the speaker? For this analysis, we exclude glottal stops and use duration as an acoustic proxy for /t/ realization, since flaps are considerably shorter than aspirated variants (De Jong, Reference De Jong1998; Zue & Laferriere, Reference Zue and Laferriere1979). Because duration is susceptible to a number of other factors, such as speech rate or preceding vowel identity, the speaker's mean vowel duration for a given blockFootnote 7 was subtracted from their /t/ token duration, to try and control for these factors.Footnote 8
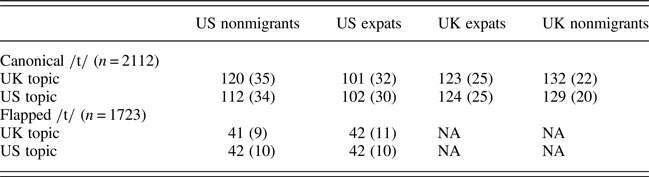
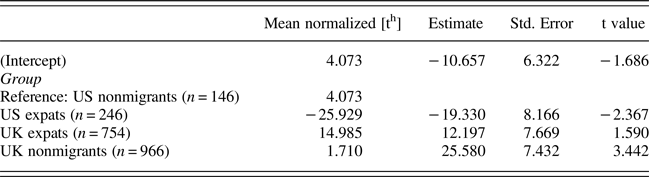
Table 4 shows the means and standard deviations for the durations of tokens coded as [th] and tokens coded as [ɾ] by speaker group and topic. Duration clearly separates tokens coded as [th] (mean = 124 ms) and [ɾ] (mean = 42 ms), confirming that duration reliably differentiates between the two variants. The table also suggests that there may be some differences in [th] realization between English and American speakers and between the migrants and nonmigrants. This is confirmed in the best-fit model of normed duration for [th] tokens (Table 5): English nonmigrants’ [th] is significantly longer than American nonmigrants’ and also longer than English expats’. The American nonmigrants also differ from American expats, but in an unexpected direction: expats’ [th] are shorter than the nonmigrants’.Footnote 9 Despite the presence of subphonemic group-level differences however, there was no statistical evidence of an effect of topic on the length of tokens coded as [th], and in the flap model, there was no evidence of an effect of either speaker group or topic. This latter point may be due to the limited room for variance in flapped tokens, seen in the small standard deviations in Table 4: much shorter and they would be deleted, much longer and they would probably be perceived as a [th].
Mean duration (ms) for /t/ coded as [th] or [ɾ] by speaker group and topic. Standard deviations are in parentheses

Model coefficients for best-fit model of normalized [th] duration (token duration [ms]–speaker mean duration [ms] for that block). Mean normalized duration calculated from raw data and reflect group means; the intercept is US nonmigrants. Total n = 2112. For mean values without normalization, see Table 4

Rhoticity
There were 3873 usable rhotic tokens extracted from stressed syllables in neutral words in the reading blocks. Table 6 shows the distribution of tokens auditorally coded as r-ful and r-less across the four speaker groups. American expatriates have marginally fewer r-ful tokens than nonmigrants. English nonmigrants are essentially categorically nonrhotic, but English expatriates exhibit around 9% rhoticity. This difference between the two English groups is significant in a chi-squared test (χ 2 = 81.812, df = 1, p < 0.001).
Percentage of /ɹ/ tokens coded as rhotic or nonrhotic, with n in parentheses. Total n = 3873

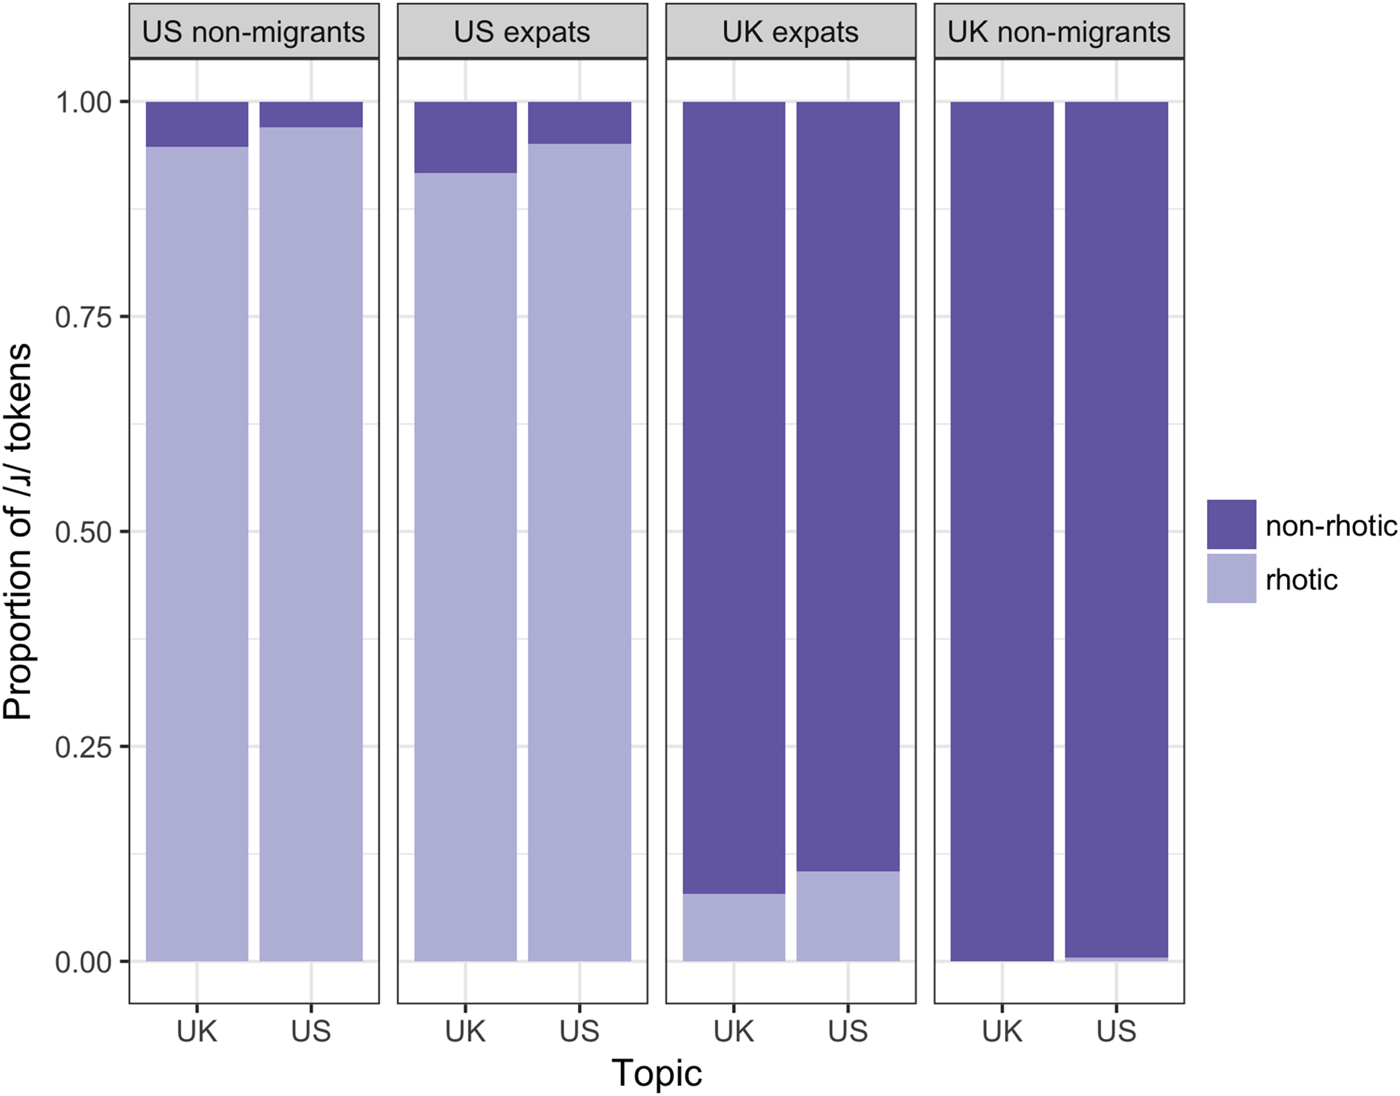
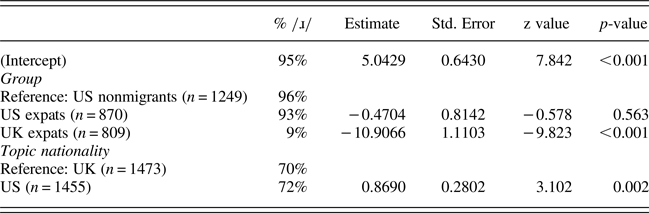
Because of the homogeneity of their realizations, English nonmigrants were excluded from the categorical analysis of /ɹ/ realization. The best-fit model is presented in Table 7. As expected, English expats produced significantly fewer rhotic tokens than American speakers. The small difference between American expatriates and nonmigrants in Table 6, however, is not significant, perhaps unsurprising given previous work showing that American expatriates are resistant to losing rhoticity (i.e., Chambers, Reference Chambers1992; Foreman, Reference Foreman2003). Finally, there is a significant effect of topic: participants have more r-ful tokens when talking about US topics, and this effect does not interact with speaker group (Figure 2).
Proportion of /ɹ/ tokens coded as rhotic or nonrhotic based on topic and migrant status. Total n = 3873.

Best fit model for categorical /ɹ/ realization. Percentage /ɹ/ is calculated from raw data and reflects group means; for the intercept it reflects the raw data mean for US nonmigrants when the topic was UK. Total n = 2928

To examine phonetic shifts within tokens categorized as r-ful or r-less, the five lowest F3 values taken across the /ɹ/ segment and the preceding vowel were averaged. Following Hagiwara (Reference Hagiwara1995), this F3 value was divided by each speaker's mean F3 for nonrhotic vowels, resulting in a F3 proportion: relative to their nonrhotic F3, what was the F3 of this token? A value of 1 means that a token had the same F3 as nonrhotic tokens from the speaker. For rhotic tokens, we would expect an F3 proportion between .55 and .8 (based on Hagiwara's data). Linguistic factors tested in the analysis were whether the vowel was back/front (front vowels have higher F3 than back vowels [cf. Hagiwara [Reference Hagiwara1995]; Stevens [Reference Stevens1998]), and whether a pause followed the /r/ (in some dialects F3 is lower when a pause follows, see Piercy and Britain [Reference Piercy and Britain2011] for a discussion).
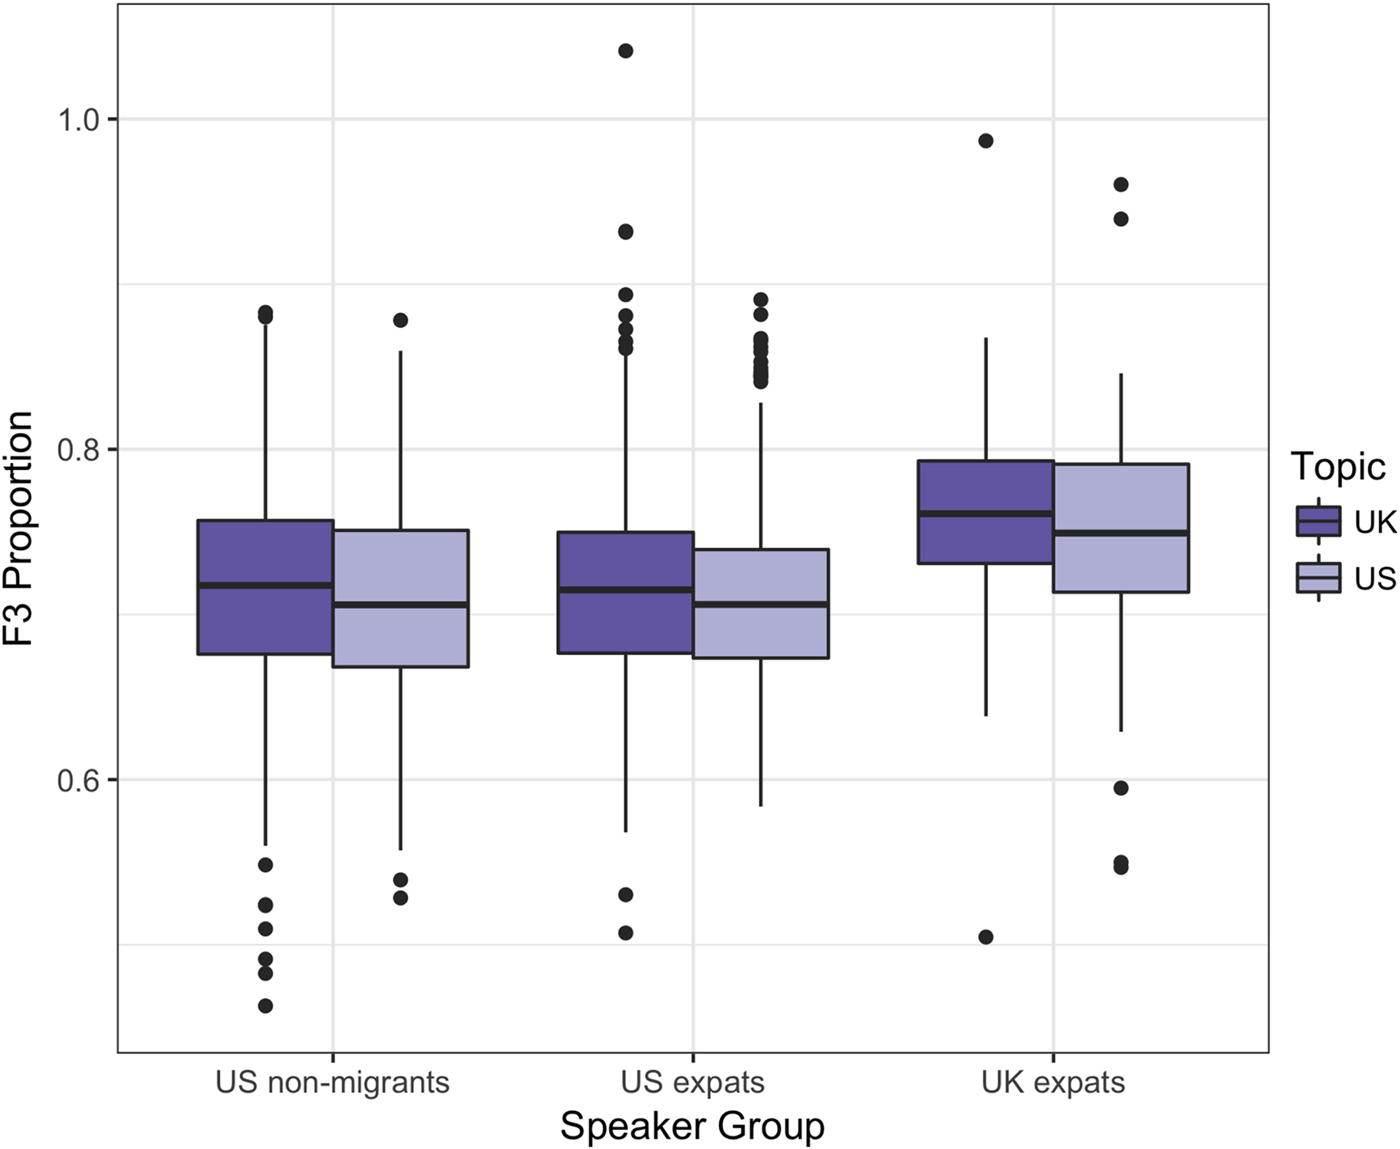
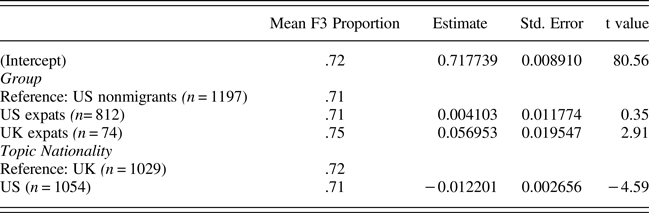
Table 8 shows the best-fit model for F3 proportion in r-ful tokens (excluding the two tokens from English nonmigrants) and includes a main effect of speaker group and topic (Figure 3). Rhotic tokens from English expatriates still have higher F3 than American rhotic tokens, and when the topic is US-themed, participants have lower F3 than when the topic is English. Again, topic does not interact with speaker group. Within the r-less tokens, adding speaker group and topic did not significantly improve on a model without them: tokens coded as r-less do not exhibit subphonemic evidence of shifting or second dialect acquisition. Like flapped /t/ tokens, this may reflect a limited range of variability in F3 realization for nonrhotic tokens before they are perceived as categorically rhotic.
F3 proportion of tokens coded as rhotic, by speaker group and topic. n = 2083.

Best fit model for F3 Proportion for tokens categorized as rhotic. Mean F3 Proportion calculated from raw data and reflects group means; the intercept is US nonmigrants when the topic is UK. n = 2083

Bath/Trap
There were 3,537 usable tokens of bath extracted for analysis. Given the fact that some of the English participants did not natively have the bath-trap split, it was necessary to split participants six ways for this analysis, with a division between “Southern” English expatriates (n = 11), “Southern” English nonmigrants (n = 18), “Northern” English expatriates (n = 8), and “Northern” English nonmigrants (n = 5). Inclusion in the Northern category was based primarily on self-reported trap usage, which was in turn supported by performance in the reading task (the highest rate of bath usage by a “Northern English” speaker was 18%), and all speakers raised North of the classic bath-trap isogloss (Wells, Reference Wells1982) were in the Northern category, though two speakers in the Midlands, and one from Somerset, were also included.
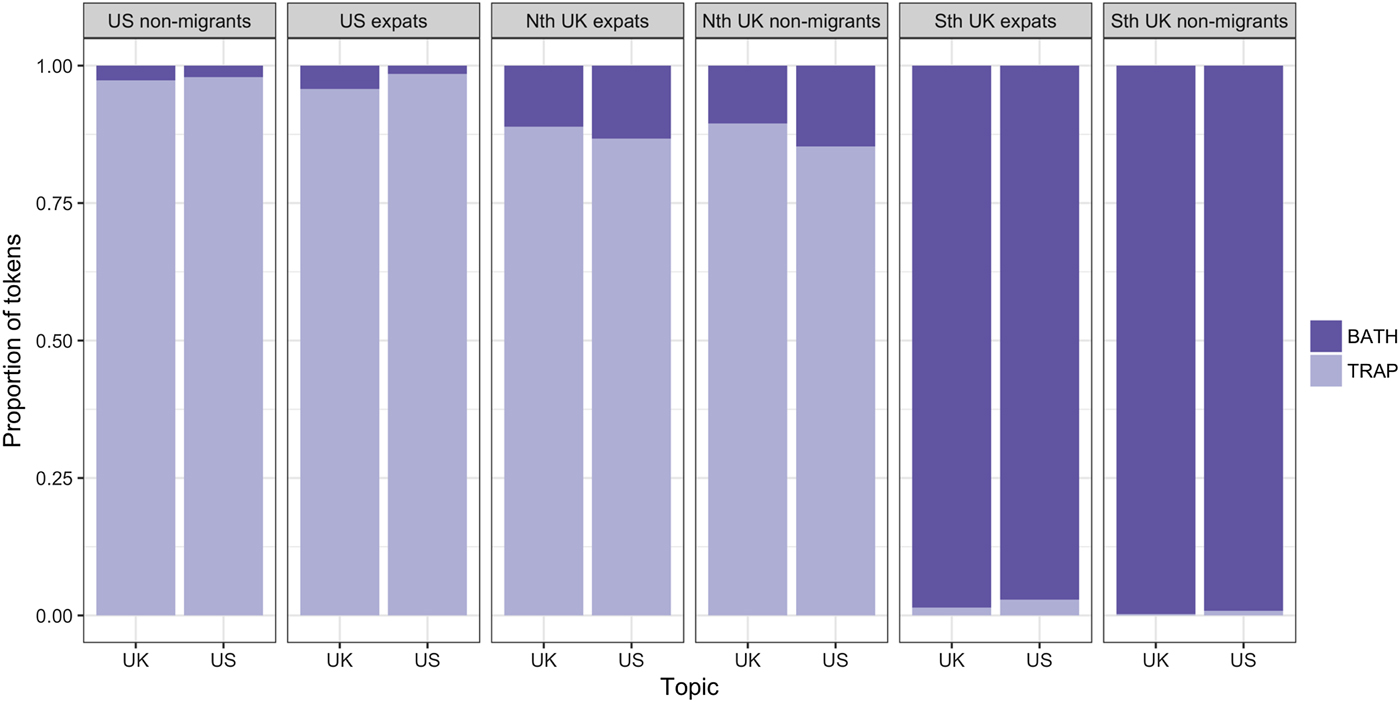
Table 9 shows the distribution of tokens coded as bath or trap across the six speaker groups. Southern English speakers almost categorically use bath, though expats have marginally higher rates of trap than nonmigrants. US participants conversely show very low rates of bath usage, and these numbers are padded by 12/50 tokens coming from one very UK-connected nonmigrant speaker, and 17/50 being on the word aunt, which is bath in the D1 for some speakers of US English. The Northern UK speakers show the most variability, although there is also evidence here of strong lexical effects: of the 13 Northerners, 12 produced banana, and 11 produced can't and rather with bath. The best-fit model for categorical bath realization, complete with random intercepts for speaker and word, does not support a difference between any expatriate and nonmigrant groups, nor any effect of topicFootnote 10 (Figure 4).
Proportion of bath tokens coded as bath or trap based on block topic, and the dialect and migrant status of speakers. Total n = 3537.

Percentage of bath tokens coded as bath or trap, with n in parentheses. Total n = 3537

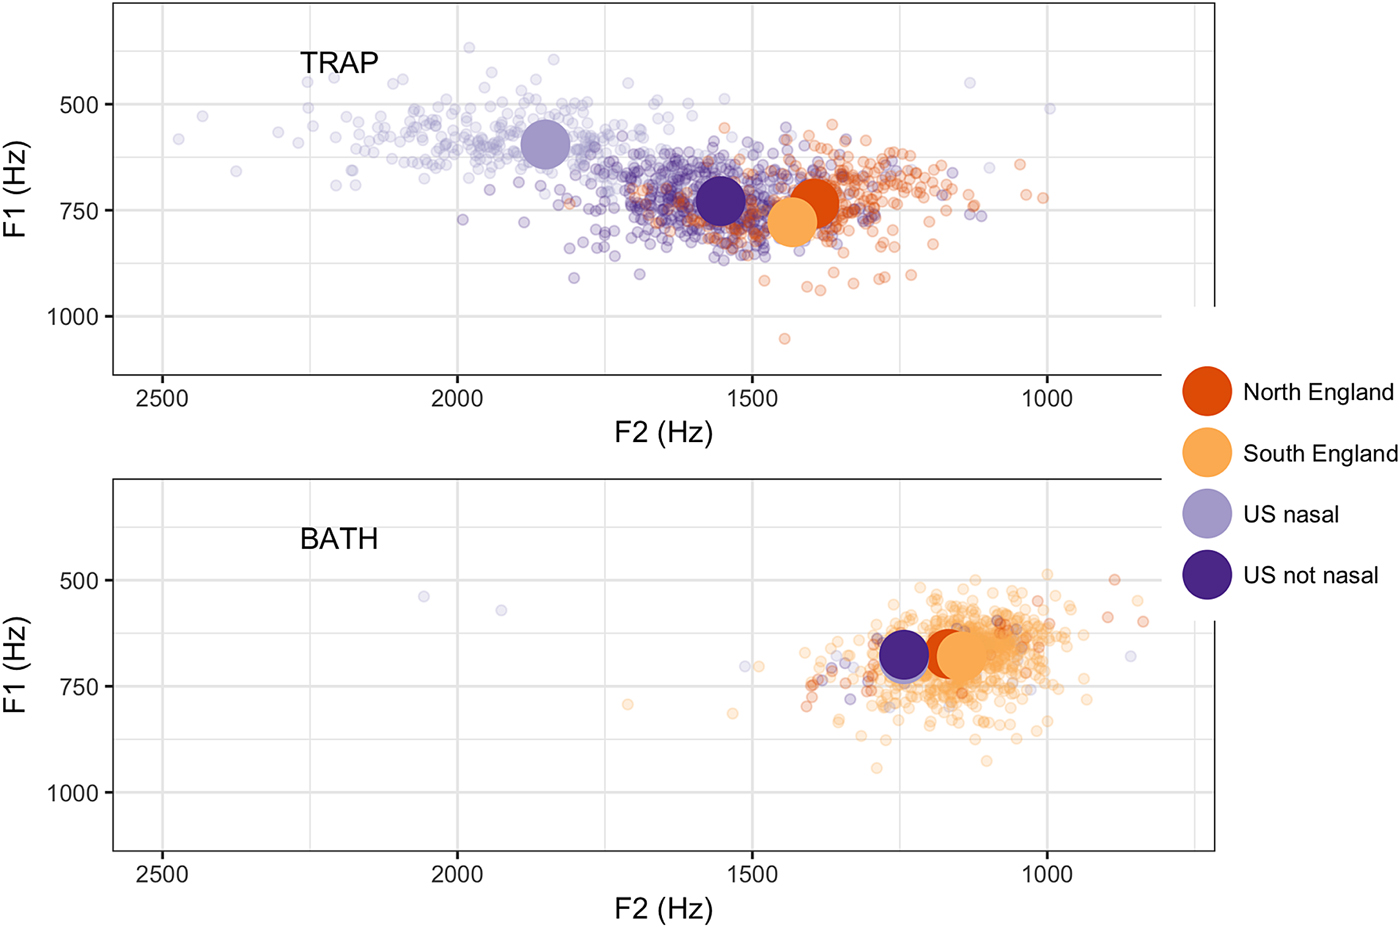
For the analysis of subphonemic shifts in bath and trap realizations, the average of the five central (40–60% of the vowel) F2 and F1 measures were taken from each vowel. To demonstrate the dialectal differences that remain within vowels categorized as trap (top) and bath (bottom), the F1 and F2 values for male speakers are shown in Figure 5. For US speakers, tokens are divided further into whether they preceded a nasal or not, since there is allophonic trap-raising pre-nasals in SAE (Labov et al., Reference Labov, Ash and Boberg2006). For all speakers, trap tokens are more fronted than bath tokens. For trap tokens, F2 separates English and US speakers fairly clearly, especially when prenasal. For bath tokens, the realizations are much closer, although US bath is more fronted still than English bath. Therefore, we can use F2 as a proxy for American versus English pronunciations, with more fronted (higher) F2 being an indication of a relatively more American pronunciation.
Male bath (bottom) and trap (top) tokens plotted in F1-F2 space, by region, and for American speakers, by preceding nasal. Large dots represent group means. Total n = 1118.

Of course, using F2 is complicated by the fact that men on average have lower F2 than women (Peterson & Barney, Reference Peterson and Barney1952). To control for this in our subphonemic analysis, we will model F2 as the dependent variable and include speaker gender as a fixed effect in the model. An alternative measure—subtracting F1 from F2—normalizes vocal tract length somewhat and results in the same qualitative results reported below.Footnote 11
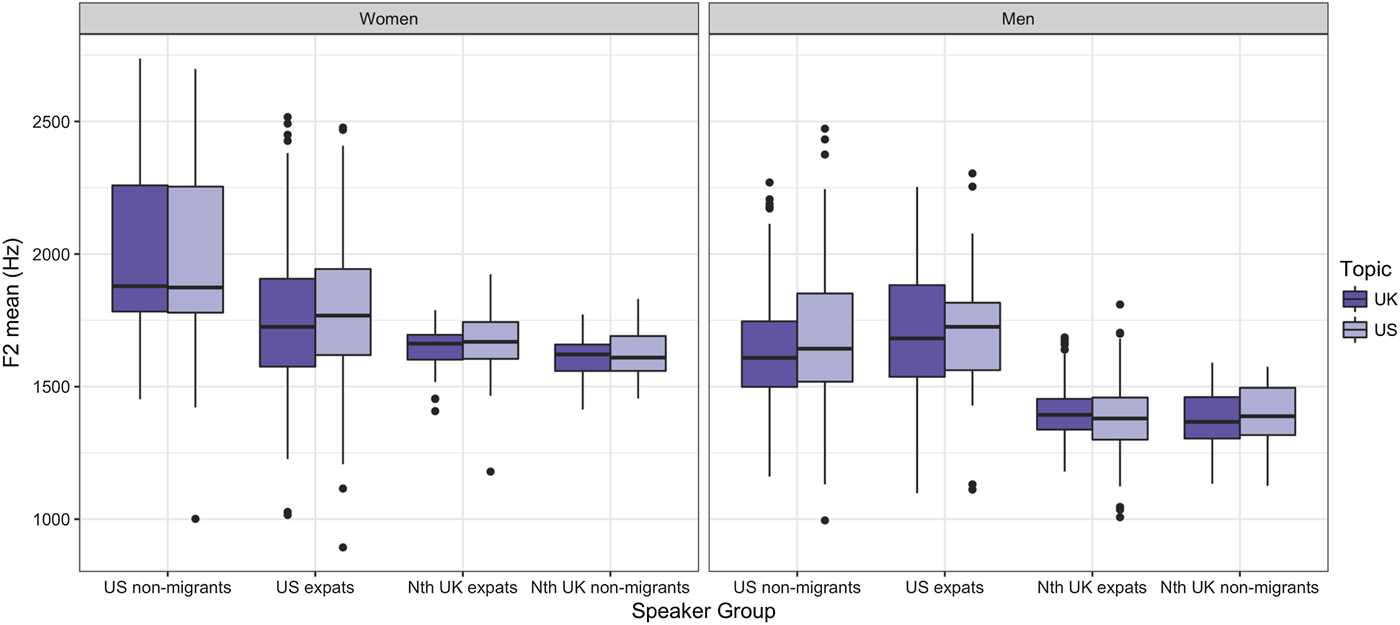
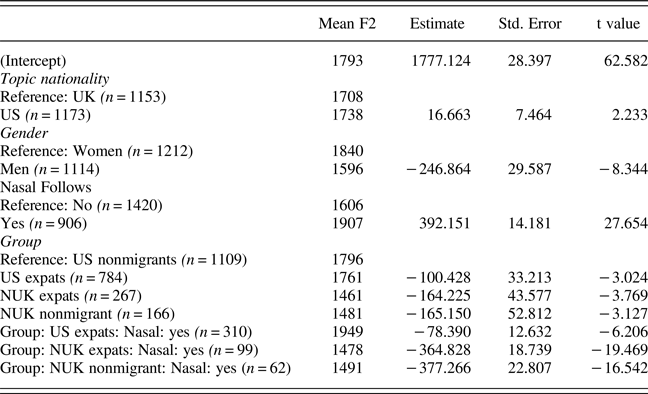
Because of the low numbers of trap tokens from Southern British speakers, these speakers were excluded from trap analysis. The coefficients of the best-fit model for the F2 of tokens coded as trap are in Table 10, and, unsurprisingly, the model includes speaker gender (men have lower F2 than women, see Figure 6). The model also shows an interaction between nasality and speaker category: US nonmigrants have a higher F2 (more fronted vowels) than all other groups in the model, including US expats, and this is especially true for prenasal tokens, where US nonmigrants have the trap nasal split. There is also a main effect of topic (Figure 6)—trap tokens are more fronted when embedded in US topics compared to English topics—and again this does not interact with speaker group. The best-fit model of F2 for tokens coded as bath did not include speaker group or topic.
Model prediction from best-fit model for F2 (Hz) for tokens coded as trap by speaker group, gender, and topic. The high variability in the US speakers is because these speakers have the trap nasal split. n = 2326.

Model coefficients for best-fit model of F2 (Hz) for tokens coded as trap. Mean F2 is based on raw data and represents group means; the intercept is calculated for US nonmigrant women when the topic is UK and the token does not precede a nasal. Total n = 2326

DISCUSSION
In this study, expatriate and nonmigrant speakers of American and British English read words embedded in US- or English-themed lists. There was an effect of the block's topic on participants’ pronunciation of all three variables investigated in this study (bath/trap,Footnote 12 intervocalic /t/, and rhoticity), although it matters whether shifting is measured categorically, using auditory measures, in which case we do not observe topic-based shifting on bath/trap; or subphonemically, using continuous acoustic measures, in which case we do not observe topic-based shifting on /t/. Importantly, when shifts are observed, they are always in a predictable direction: people produce more SSBE-like tokens when the topic is English-themed, and comparatively more SAE-consistent tokens when the theme is American. At the most basic level, this study confirms other findings that topic can affect pronunciation (i.e., Becker, Reference Becker2009; Love & Walker, Reference Love and Walker2013; Rickford & McNair-Knox, Reference Rickford, McNair-Knox, Biber and Finegan1994). Moreover, it shows that such shifts can happen between dialects outside of a typical standard-nonstandard relationship, on nontopic specific words (it is not driven by topic-specific lexemes), and in a noninteractive experimental reading task (Drager et al., Reference Drager, Hay and Walker2010).Footnote 13
The primary purpose of this paper was to see whether topic-based shifting interacts with dialectal exposureFootnote 14 on phonological variables, and the answer is: it depends. We can only test for the role that topic has on variability when there is variability, and there are differences here between migrant versus nonmigrant groups. For example, English nonmigrants and expats produce almost no flaps intervocalically (Table 2), and introducing an American topic does not result in the introduction of an American variant. However, in Figure 2, for rhoticity, English expats do alter their rates of rhoticity based on topic because they have acquired some rhoticity overall, while English nonmigrants do not, because they are categorically nonrhotic. Critically, then, exposure does matter insomuch that it appears that primed variants must be in a speaker's repertoire to affect their production (a constraint of repertoire), and that, for some of these phonological variables, inclusion in a speaker's repertoire is only coming through long-term second dialect exposure. The fact that shifting is easier where there is already internal variability mirrors arguments in second dialect acquisition that acquisition is easier where there is existing flexibility on a variable (i.e., Bowie, Reference Bowie2000; Sankoff & Blondeau, Reference Sankoff and Blondeau2007) and in accommodation tasks, where more convergence is observed when there is already variability in a speaker's production of a variant (e.g., Walker & Campbell-Kibler, Reference Walker and Campbell-Kibler2015:14).
However, so long as there is some variability in a speaker's repertoire, dialectal exposure does not appear to interact with the amount of topic-based shifting we observe. This doesn't appear to simply be a byproduct of statistical power; plots of the raw data tell a similar story to the statistical models, that of equal-sized, very small shifts based on topic across most groups. This is true even when the expatriates significantly differ from the nonmigrants in their overall rates of variant usage. For example, in Figure 1, US expatriates show overall higher rates of using aspirated or glottal /t/ than US nonmigrants—that is, it looks like they are undergoing second dialect acquisition of English variants—but both groups show similar-sized shifts in /t/ realization across the different topics, because even though nonmigrants only use aspirated /t/ at low levels, it is still in their repertoire.
If we try to explain these results in terms of exemplar models, we might initially be surprised. Experience, and specifically the role of frequent versus infrequent experiences, is a cornerstone of exemplar theory (i.e., Bybee, Reference Bybee, Barlow and Kemmer2000; Hay, Pierrehumbert, Walker, & LaShell, Reference Hay, Pierrehumbert, Walker and LaShell2015; Pierrehumbert, Reference Pierrehumbert, Bybee and Hopper2001), and if topic-based shifting is the result of activating previously encountered exemplars, we would expect listeners with more experience to show larger shifts in their speech as a function of having more UK/US exemplars to activate. Instead, it looks as if both types of speakers are activating the idea of UK/US English—the stereotypical conception they have of these dialects—and these ideas are shared between migrants and nonmigrants. This claim that stereotypes drive topic-based shifting is consistent with other findings in the topic-based shifting literature: there is inaccurate shifting (Sanchez et al., Reference Sanchez, Hay and Nilson2015), and markers and stereotypes shift more than indicators (Bell, Reference Bell1984; Callary, Reference Callary1975; Drager et al., Reference Drager, Hay and Walker2010; Labov, Reference Labov1972; Nycz, Reference Nycz2018).Footnote 15 Of course, stereotypes are not the opposite of experience, and the nonmigrant speakers in this study at the very least still have a fair amount of media-conveyed exposure to the D2. But stereotypes filter, overgeneralize (socially and linguistically), and essentialize experience and perhaps make no distinction between native and performed instances of a dialect or even give greater weight to stereotype-confirming performance (see Drager & Kirtley, Reference Drager, Kirtley and Babel2016). These results add to a growing number of studies complicating our understanding of what it means for a listener to have experienced something, and in turn for how experience impacts their cognitive representations and language-activating mechanisms (Drager & Kirtley, Reference Drager, Kirtley and Babel2016; McGowan, Reference McGowan and Babel2016; Sanchez et al., Reference Sanchez, Hay and Nilson2015).
These findings also highlight the need for a distinction between representations and/or processes that impact production versus those that influence perception (cf., Baese-Berk, Reference Baese-Berk2010; Pierrehumbert, Reference Pierrehumbert, Bybee and Hopper2001). The ambient dialect for expatriates in this study is the D2; they definitely have substantial exposure to the D2, and this exposure has improved their ability to process D2 speech compared to the nonmigrants (Walker, Reference Walker2018; see also Sumner & Samuel, Reference Sumner and Samuel2009). Moreover, in the interviews that followed the experiment, participants explicitly mentioned activating the D2 for certain words/pronunciations, even when it had no impact on their own categorical realizations (1–3).
1) “[when I was reading] I could hear them [bath words] in an RP accent in my mind” (participant 321, US Expat, produced no [a] for bath tokens in task).
2) [regarding daft] “I can hear English people saying it in my head” (participant 314, US Expat, produced no [a] for bath tokens in task).
3) “Because I said the American words, in my head, I could hear what an American accent would be. I said it in my normal accent. But in my head I can hear superbowl” (participant 801, UK nonmigrant, italics indicate performed American accent, produced no rhotic tokens in task).
Critically, then, it is not the case that, when participants did not produce a variant, it was because they did not activate it. Rather, if a variant is not in a speaker's personal repertoire,Footnote 16 associatively priming a variant does not appear to shift production toward it.
One possible explanation for the significance of pre-existing in a speaker's repertoire is that participants can only shift on variants that carry social meanings that are already somewhat consistent with how they self-present. I have been describing the variables in this study in terms of their significance in distinguishing two demographic categories: people raised in England and people raised in the US. However, Eckert (Reference Eckert2008) has argued that variants have lower-order indexicalities (“stances and characteristics that constitute those categories,” [453]), and there is increasing evidence that it is these meanings that drive behavior (D'Onofrio, Reference D'Onofrio2015; Sneller & Roberts, Reference Sneller and Roberts2018; cf., Silverstein, Reference Silverstein2003). For example, aspirated intervocalic /t/ in US English appears to be associated with hyperarticulation and careful speech, and with educated and elegant speech (Eckert, Reference Eckert2008:469) In this study, we can see that speakers vary their /t/ realizations not only by topic nationality but also by topic genre (more formal topics result in more aspirated /t/). It is possible that activating the English variant can influence speech in this case, because speakers do not see themselves as using an English /t/; rather, they may see themselves as being a little more educated and proper (which is not arbitrarily associated with UK topics and British English [Eckert Reference Eckert2008, see also Coupland, Reference Coupland2007]).
Social meaning may also help explain the bath-trap results, which are different from rhoticity and /t/ in that there is neither categorical-level shifting due to topic or evidence of second dialect acquisition for either US expats or UK expats. The bath-trap split differs from the other two variables in that it is lexically specified; there is no single phonological rule to predict which words split in UK English and which did not (gas and glass rhyme in SAE, but only the latter is bath class is SSBE). Moreover, it's likely that the “variability” observed in Figure 4 is not systemic, but simply reflects variability in bath-trap classification in the D1 for specific lexical items. But bath-trap also differed from the other two variables in that a number of participants talked about the social meaning of bath (specifically poshness, see also Gupta [Reference Gupta2005]), and explicitly stated that using that variant was stigmatized for them (4–6).
4) “I can't say grass [gras] cos that's absurd - sounds like me putting on a posh accent” (318, US expat).
5) “If I was saying aunt [ant] that's putting it on” (321, US expat)
6) “If I said bath [baθ]] … I'd have the mickey taken out of me” (521, UK expat).
Note that participants did mention rhoticity and intervocalic /t/ as being differences between US and UK English (Walker, Reference Walker2014:126–127), but it was never accompanied by such socially charged commentary. This stigma may explain why we do not see second dialect acquisition of this variable at the categorical level (Sankoff, Reference Sankoff and Fought2004; Trudgill, Reference Trudgill1986), and relatedly, why we observe no categorical topic-based shifting between using bath and trap forms (cf., Lin, Reference Lin2018). A second related reason for the lack of topic-based shifting on bath-trap, especially for English participants, is that we may have used the wrong topic (UK versus US) to elicit shifting on this variable: for these speakers, the bath-trap split appears to be associated first as a difference within England, marking speakers as Southern or Northern (7). Invoking a US topic then did not invoke the US variant while invoking a Northern UK topic might. One Southern UK expat said as much (8).
7) “It's definitely the dividing line between North and South” (535, UK expat).
8) “If I'm talking to a Northern person, or about Northern topics, I might switch bath [baθ] to bath [bæθ]; I can say both” (507, UK expat).
To summarize, it appears that, when a second dialect is primed through topic, listeners with long-term D2 exposure and listeners with limited D2 exposure both activate stereotypical representations of the dialect. These representations bias their productions to more D2-like pronunciations, but only within their existing repertoire. This means that it is likely that when looking at D1-D2 shifts, we will more commonly observe phonetic/subphonemic shifts compared to (allo)phonological shifts, since the latter is more likely to force speakers out of their D1 space, unless they have acquired D2 variants. This proposal also predicts that we will not see topic or prime-based shifting in production on variables that are not stereotypical, and that, if a person does not have a stereotype of a dialect, we will not see (accurate) shifting. Furthermore, topics will have an effect so much as they invoke a linguistic stereotype, and conversely, linguistic variables will only shift so much as they are associated with a topic. While experience should not inherently change the degree to which someone shifts topic, it could interact with topic-shifting if it changes a person's stereotypes of a dialect, either by changing perception of the differences between two dialects or of the connection of linguistic behaviors to topics and speaker groups (see Blommaert, Reference Blommaert2009:423). After all, Sanchez et al. (Reference Sanchez, Hay and Nilson2015) do find an interaction between D2 exposure and topic-based shifting in New Zealanders speaking about Australian topics, but only on the nonstereotyped dress vowel. Experience, then, appears to impact whether speakers have a(n accurate) dress stereotype.
CONCLUSION
In this study, speakers produce more US/UK-like speech when reading words in the context of US/UK-themed reading blocks in an experimental task. This is true across the three variables measured (intervocalic /t/, bath/trap, and rhoticity), although some effects are only categorical (/t/), some categorical and subphonemic (rhoticity), and some are subphonemic only (trap). Shifting appears to be constrained by the variants in a speaker's repertoire, and this repertoire can be affected by long-term second dialect exposure. However, beyond adding to the repertoire, experience with a D2 does not impact the degree to which the topic affects a speaker's production: if the variant is in a speaker's repertoire, speakers can move on it in response to the topic, and speakers with more variability do not show greater shifts than speakers with low variability. This appears to happen because topic-based style-shifting critically involves priming dialectal stereotypes, which are often the same for speakers with or without substantial second dialect contact.
APPENDIX A MAPS OF SPEAKER ORIGIN
These maps mark where participants originated from. Each dot represents one participant, unless an adjacent number indicates otherwise.
Appendix A.1: Origin of US Expats

Appendix A.2: Origin of US Nonmigrants

Appendix A.3: Origin of UK Expats

Appendix A.4: Origin of UK Nonmigrants

APPENDIX B TOPIC-SPECIFIC WORDS
40 of the 70 words/collocations participants read in each block were topic-specific. These were to set the topic and prime participants, but were not included in the acoustic analysis.
American football (NFL) block
BALTIMORE RAVENS, INTERCEPTION, PUNTER, QUARTERBACK SAN FRANCISCO 49ERS, SUPERBOWL, CHICAGO BEARS, CONVERSION, DENVER BRONCOS, GUARD, LINEBACKER, NEW YORK GIANTS, PASS INTERFERENCE, PITTSBURGH STEELERS, PURDUE BOILERMAKERS, RECEIVER, SAN DIEGO CHARGERS, TAMPA BAY BUCCANEERS, URBAN MEYER, ATLANTA FALCONS, BRUTUS BUCKEYE, CINCINNATI BENGALS, MINNESOTA VIKINGS, PASSING YARDS, AARON RODGERS, ADRIAN PETERSON, ARIZONA CARDINALS, CAROLINA PANTHERS, CLEVELAND BROWNS, EDDIE GEORGE, ELI MANNING, FIRST DOWN, FLORIDA GATORS, GREEN BAY PACKERS, KANSAS CITY CHIEFS, NEW ORLEANS SAINTS, NFL DRAFT, OAKLAND, RAIDERS, OHIO STATE BUCKEYES, TENNESSEE TITANS
American government and history block
EXECUTIVE BRANCH, JIMMY CARTER, SENATOR, TEA PARTY, HERBERT HOOVER, MISTER PRESIDENT, A MORE PERFECT UNION, FDR, FEDERAL GOVERNMENT, FIRST TERM, FOUNDING FATHERS, GOVERNOR, GREEN CARD, HOUSE SPEAKER, JOHN BOEHNER, JUSTICE RUTH BADER GINSBURG, LEGISLATURE, REPUBLICAN PARTY, RIGHT TO BEAR ARMS, STAR SPANGLED BANNER, STATE BOARD, THE SUPREME COURT, VOTING REFORM, CALAMITY JANE, DEMOCRATIC PARTY, HILLARY CLINTON, HOUSE COMMITTEE, HOUSE OF REPRESENTATIVES, CAPITOL BUILDING, FEDERAL REGULATOR, FIRST AMENDMENT, GEORGE BUSH, MARTIN LUTHER KING JNR, NATIVE AMERICANS, PRESIDENTIALVETO, ROSA PARKS, TED KENNEDY, WASHINGTON DC
English Football (EPL) block
EVERTON, ARSENAL GUNNERS, ARSENE WENGER, BRADFORD CITY, CARDIFF CITY, CENTRE CIRCLE, CORNER ARC, HEADER, KEEPER, LIVERPOOL, MANCHESTER CITY, MERSEYSIDE, MIDFIELDER, OLD TRAFFORD, SKIPPER, STRIKER, SUNDERLAND, TOTTENHAM HOTSPUR, WINGER, YELLOW CARD, LEE CATTERMOLE, MANCHESTER UNITED, PENALTY SHOOTOUT, WIGAN ATHLETIC, NEWCASTLE, ASTON VILLA, CHELSEA, EDEN, HAZARD, ENGLISH PREMIER LEAGUE, FRANK LAMPARD, FULHAM, LUIS SUAREZ, NORWICH CITY, QUEENS PARK RANGERS, STAMFORD BRIDGE, STOKE CITY, SWANSEA CITY, VICTOR MOSES, WEST BROMWICH ALBION, WEST HAM UNITED
English government and history block
ARCHBISHOP OF CANTERBURY, CONSERVATIVE PARTY, LABOUR PARTY, OXFORD UNIVERSITY, THE SUPREME COURT OF THE UNITED KINGDOM, CHANCELLOR OF THE EXCHEQUER, CHURCH OF ENGLAND, EARL OF WESSEX, FRONTBENCHER, KING RICHARD THE THIRD, MARGARET THATCHER, MONARCH, PARLIAMENTARY CHAMBERS, RIVER THAMES, SENIOR MINISTER, SIR WINSTON CHURCHILL, TONY BLAIR, WINDSOR CASTLE, ROYAL PREROGATIVE, BIG BEN, CHANGING OF THE GUARD, CONSTITUTIONAL MONARCHY, DAVID CAMERON, DUCHESS OF YORK, DUKE OF EDINBURGH, GORDON BROWN, GOVERNOR GENERAL, GRAND COMMITTEE, HOUSE OF LORDS, KATE MIDDLETON, MEMBER OF PARLIAMENT, NATIONAL HEALTH SERVICE, NUMBER TEN DOWNING STREET, PALACE OF WEST MINISTER, POUND STERLING, PRIME MINISTER, PRINCE WILLIAM, QUEEN ELIZABETH THE FIRST, SCOTLAND YARD, UNITED KINGDOM
APPENDIX C NEUTRAL WORDS
In each block, 30 neutral words were interspersed between the 40 topic-specific words. 10 words came from each of the following lists for each variable. Some words contained more than one variable of interest; the other variable will be marked in parentheses. Words marked with * were excluded from analysis for exhibiting variation outside of the variants of interest.
Intervocalic /t/
BEAUTY, BEETLE, BETTER, BITING, BITTER, BOATING, BOTTLE, BRIGHTEST, COATING, CUTTING, DIRTY(r), DUTY, FATAL, FATTER, FETISH, FITTER, GRATER, GRATING, HEARTY(r), KITTY, LETTER, LITTLE, MATTER, NOTED, OTTER, PATTING, PETAL, PLOTTED, PLOTTING, POUTING, RATED, RATING, SHOUTED, SHUTTER, SIGHTED, STUTTER, TITLE, TUTOR, VITAL, WETTER, WRITER
Rhoticity
AIR, BARE, BEARD, BOMBARD, BOREDOM, CART, CHAIR, CHORD, COURSE, COURTYARD, CURSE, EAR, FORT, FORTH, FOUR, FUR, HEARD, HEART, HERE, HURT, LARGE, NEAR, NURSE, ORPHAN, PART, PEAR, PERSON, PURE, PURPLE, SHORE, STAIRWAY, START, SURE, TARGET, THERE, WAR, WEIRD, HARD, LARD, PERFECT
BATH
ADVANTAGE, AFTER, ANSWER, ASK, AUNT, BANANA, BATH, BRANCH, CAN'T, CAST, CASTLE, CHANCE, CHANT, CRAFT, DAFT, DANCE, DATA* (t), DRAFT, ENHANCE, EXAMPLE, FAST, FLASK, GASP, GRAPH, GRASS, LANCE, LAST, LAUGH, MAST, PASS, PAST, PATH, RANCH, RATHER, SAMPLE, STAFF, TASK, TRESPASS*, VANTAGE