Introduction
The digestibility of horse feeds and rations can be determined or predicted using different direct or indirect techniques: calculations based on the chemical composition of feeds (Martin-Rosset et al., Reference Martin-Rosset, Andrieu and Jestin1996a), in vivo (Miraglia et al., Reference Miraglia, Bergero, Bassano, Tarantola and Ladetto1988, Reference Miraglia, Bergero, Polidori, Gagliardi and Tarantola1999a, Reference Miraglia, Bergero, Polidori, Peiretti and Ladetto1999b and Reference Miraglia, Martin-Rosset and Tisserand2006) or in vitro (Andrieu et al., Reference Andrieu, Jestin and Martin-Rosset1996; Martin-Rosset et al., Reference Martin-Rosset, Andrieu and Jestin1996b; Macheboeuf et al., Reference Macheboeuf, Jestin, Andrieu and Martin-Rosset1997) methods. The total collection of faeces method is considered to be the most accurate and it has been tested extensively on a large numbers of feeds, with a significant number of horses to perform original table of nutritional value of feedstuffs in Europe such as those of INRA (1984 and 1990). The marker methods overcome some difficulties that are encountered with the analysis of the ingesta/egesta method: stressful conditions for the animals (depending on the kind of harness and/or the width of stalls) and longer experimental periods. In recent years, indigestible markers have been used in digestibility trials: some markers are naturally occurring substances such as n-alkanes (Peiretti et al., Reference Peiretti, Meineri, Miraglia, Mucciarelli and Bergero2006), acid-insoluble ash (AIA) (Miraglia et al., Reference Miraglia, Bergero, Bassano, Tarantola and Ladetto1999a and Reference Miraglia, Bergero, Polidori, Gagliardi and Tarantola1999b; Almeida et al., Reference Almeida, Lopez Donzeles, Leao and Cecon2001) and acid detergent lignin (ADL) (Miraglia et al., Reference Miraglia, Bergero, Bassano, Tarantola and Ladetto1999a and Reference Miraglia, Bergero, Polidori, Gagliardi and Tarantola1999b), while other markers are added to diets, such as chromic oxide (Cr2O3) in horses (Parkins et al., Reference Parkins, Snow and Adams1982; Cuddeford and Hughes, Reference Cuddeford and Hughes1990) or titanium dioxide (TiO2) in cattle (Titgemeyer et al., Reference Titgemeyer, Armendariz, Bindel, Greenwood and Loest2001).
In field conditions, the natural indigestible markers can be used with no changes in the normal ration, providing thus a very useful tool for digestibility trials. The advantages of the AIA method over the techniques using other markers are the simplicity of the analysis and the lack of special equipments. AIA may be composed predominantly of silicate, as discussed by Van Keulen and Young (Reference Van Keulen and Young1977) who obtained a 100% recovery of AIA with sheep. Satisfactory results with AIA as an indicator for horse digestibility measurement have also been reported by Sutton et al. (Reference Sutton, Bowland and McCarthy1977) and Bergero et al. (Reference Bergero, Miraglia, Abba and Polidori2004).
In the determination of AIA content, the concentration of HCl used in the laboratory technique appears as an important factor. In seven digestion trials with horses, two AIA methods were compared 2N HCl v. 4N HCl AIA (Van Keulen and Young, Reference Van Keulen and Young1977), with the aim to assess the reliability of repeated determinations performed in faeces and feedstuffs for horses.
Material and methods
Six standardbred horses, aged between 3 and 9 years, with average initial and final weights of 495 ± 78 and 492 ± 49 kg, respectively, were used in a set of seven in vivo apparent digestibility trials. The diets were based on a first-cut meadow hay (100% for trial 4, on dry matter (DM) basis) supplemented with three different cereals (barley for trials 1 and 2; oats for trials 3 and 5; and corn for trials 6 and 7), the hay : concentrate ratio being 60 : 40 respectively, on DM basis. According to Martin-Rosset et al. (Reference Martin-Rosset, Andrieu, Vermorel and Dulphy1984) and for each trial, the experimental period lasted 20 days: with 14 days of adaptation to the diet and 6 days of total collection according to the routine method described by Martin-Rosset and Dulphy (Reference Martin-Rosset and Dulphy1987). The feeding level was close to maintenance in all the experimental periods, since the horses performed a very light exercise made of a daily 20 min walk using an automatic lungeing.
Aliquot samples were daily collected during the experimental period. Each aliquot represented about 10% of the faecal output. Then cumulative samples were prepared by mixing daily samples. The faecal cumulative samples were dried in a forced-draft oven at 65°C for at least 48 h till constant weight. The feeds were taken for immediate determination of the DM content at 105°C. All the dried samples were ground in a mill fitted with a 1 mm screen. The samples were analysed to determine crude protein (CP), crude fibre (CF) and ash, according to Association of Official Analytical Chemists (2004). The neutral detergent fibre (NDF), acid detergent fibre (ADF) and ADL were determined according to Van Soest et al. (Reference Van Soest, Robertson and Lewis1991). The gross energy (GE) was measured with an adiabatic calorimeter bomb (IKA C7000; IKA, Staufen, Germany).
Feedstuffs and faeces from each horse were analysed to determine the AIA, using both the 2N HCl and 4N HCl techniques (Sutton et al., Reference Sutton, Bowland and McCarthy1977; Miraglia et al., Reference Miraglia, Bergero, Bassano, Tarantola and Ladetto1999a and Reference Miraglia, Bergero, Polidori, Gagliardi and Tarantola1999b).
In order to assess the accuracy and the repeatability of the two methods, the AIA determinations were performed nine times (three samplings and three determinations in each sampling) on each feedstuff with each method (2N and 4N), and at least in duplicate for faeces samples.
The rations’ apparent digestibility coefficients were evaluated using the AIA as internal markers and were calculated according to the indirect digestibility method (Van Keulen and Young, Reference Van Keulen and Young1977). The calculation of the DM digestibility was as follows:

where A and B were the AIA concentrations in the feed and faeces, respectively. The organic matter (OM) digestibility was calculated as follows:

where OMA and OMB were the OM concentrations in the feed and faeces, respectively.
Results were submitted to analysis of variance (ANOVA) using the SPSS statistics package (version 11.5; SPSS Inc., Chicago, IL, USA). All the trials’ data were first pooled into a single database and then considered separately to assess the intra-group variance. A two-tailed t-test was used to compare the results of the AIA analysis on each feedstuff, using the final mean value obtained out of the three mean values for each sub-sampling. In this way, it was possible to compare the data that were used in practice for the digestibility coefficients assessment.
Digestibility coefficients for DM and OM were also calculated, and a two-way, diet and method, ANOVA was used to determine the statistical differences between the two different AIA techniques.
Results
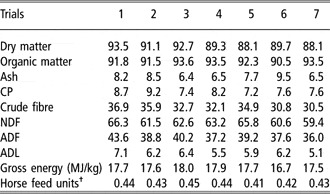
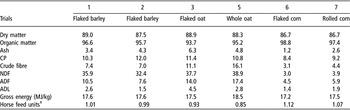
Tables 1 and 2 summarise the chemical composition of the hays and grains used in the different trials, respectively. During all the trials, the hay composition showed a variability in terms of CP, fibrous fractions and ash, even if the net energy value was almost steady. As far as grains is concerned, the process did not influence in particular the protein and net energy value of grains.
Dry matter (DM) content and chemical composition (g/kg DM) and energy content (MJ/kg DM) of the meadow hays

†Net energy value, according to Vermorel and Martin-Rosset (Reference Vermorel and Martin-Rosset1997).
Dry matter (DM) content and chemical composition (g/kg DM) and energy content (MJ/kg DM) of the cereal grains

†Net energy value, according to Vermorel and Martin-Rosset (Reference Vermorel and Martin-Rosset1997).
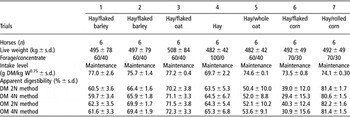
The characteristics of the horses, the intakes and the apparent digestibility coefficients measured with the two methods are given in Table 3.
Intake and apparent digestibility coefficient (%) of the diet

DM = dry matter; OM = organic matter.
Feeding levels was stated to be close to maintenance according to the reference method (Martin-Rosset and Dulphy, Reference Martin-Rosset and Dulphy1987).
The mean AIA concentrations were used to calculate the apparent digestibility coefficients during digestibility trials. The accuracy of the measurement is a key point for the determination since a small difference in the accuracy or repeatability of the mean measurement can influence, to a large extent, the final results.
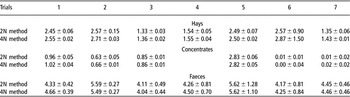
The concentration of the AIA measured by the 2N and 4N methods along with data variability in the hays, concentrates and faeces are reported in Table 4. There were no significant differences between the two methods; when the whole faeces database set was compared, we obtained P = 0.85. Similar findings were obtained for trial 1 (P = 0.66); for trial 2 (P = 0.74); for trial 3 (P = 0.89); for trial 4 (P = 0.78); for trial 5 (P = 0.99); for trial 6 (P = 0.82); and for trial 7 (P = 0.96). There was however a difference between the two methods for hay (P = 0.05), but not for barley, (P = 0.27); for oats (P = 0.87) or for corn (P = 0.66).
Concentration (%) in acid-insoluble ash measured according to the 2N and 4N data methods

The concentrations of the AIA in faeces were, as expected, different between the different trials. When the measurement was repeated on the same faeces samples, the data analysis showed no significant differences. The best relationship between the two methods was obtained for trial 5, where P was close to 1 (0.99) and the worst in trial 1 with P = 0.66. On the whole, the correlations obtained with the two different methods were very close and the standard deviations were similar, when single trials were compared. It was, however, important to point out that the distribution of the data was not always the same: the standard deviation of the data in trial 2 was 0.27 for both methods, while in trial 5 it was observed as 1.28 for 2N AIA and 1.10 for 4N AIA. This was a per se different variability, which was not connected either to the method used, or to the feedstuffs (hay + oats in trial 5, as in trial 3, which has a standard deviation of 0.49 for the 2N method and 0.44 for the 4N method) and then to the AIA level in feedstuffs or in faeces (the values observed were similar to those that were found for other trials) or to the horses, which were the same in all the trials.
Good correlations were obtained with the concentrates, but the results were less satisfactory for hay. However, the mean values obtained for hays using the 4N method were slightly but constantly higher. The main problem was in trial 6, in which a difference was observed over 0.3% between the two determinations with a very high standard error (0.90 for 2N AIA and 1.50 for 4N AIA). The high value of ash reported for the hay used in trial 6 (9.5%) can explain partly the high variability. As a consequence, higher differences were found between digestibility coefficients obtained with the two tested methods, particularly when hay diets were tested. For diets including concentrates, this effect was less evident. Another important fact to point out was the AIA absence in corn using both methods.
Consequently, no statistical differences were found for the factor ‘method’ both for DM and OM digestibility coefficients (Table 3).
Discussion
Van Keulen and Young (Reference Van Keulen and Young1977) used 2N HCl and found no significant difference in the AIA concentrations determined by either 2N or 4N HCl methods. They concluded that 2N HCl was preferable because of easy handling. Furuichi and Takahashi (Reference Furuichi and Takahashi1981) determined the AIA content of feed and faeces using three different concentrations of HCl (2N, 4N and 6N). They did not find any significant differences among the three methods. Other authors used only 4N AIA method for apparent digestibility method comparison in other species (Kavanagh et al., Reference Kavanagh, Lynch, O’Mara and Caffrey2001)
As to digestibility coefficients, no significant difference between the two methods for each trial was found: this is consistent with observed AIA concentrations and can stand for the suitability of both methods while studying horse diets’ apparent digestibility.
As to the coefficients considered per se, it is interesting to observe that the hay used in trial 4 was highly digestible compared to our previous data (Bergero et al., Reference Bergero, Miraglia, Abba and Polidori2004), and on the contrary, the mixed diets coefficients were sometimes very low, especially for trials 5 and 6. The normal increase in the digestibility coefficients expected while using concentrates in the diets compared to hay alone was observed only for trials 2, 3 and 7. This stands for interfering internal (e.g. disturbances in the gut functions, as previously referred by Miraglia et al. (Reference Miraglia, Bergero, Bassano, Tarantola and Ladetto1999a and Reference Miraglia, Bergero, Polidori, Gagliardi and Tarantola1999b)) or external factors (e.g. corn quality in terms of moulds or mycotoxins, and others) that occurred, in particular, during trial 6. However, if we considered the single trial, even those interferences did not affect the differences found using the two methods.
Since no differences was found between the two methods for means and accuracy, it was concluded that the 2N HCl method was the easiest technique to be used, even if in some trials interfering factors consistently lowered the overall values. Consequently, the AIA 2N HCl can be considered the easier and cheaper method to state apparent digestibility in field conditions, and a good tool for digestibility trials in horses fed hay-based diets.