Introduction
The starting points for the present article are two seemingly banal demographic observations. The first observation concerns spousal age differences. In heterosexual couples, husbands are on average a few years older than their wives, and men-older couples are far more common than women-older couples. This pattern appears in virtually all countries in the world and studies have shown that is has existed for a long time (Buss Reference Buss1989; Casterline, Williams and McDonald Reference Casterline, Williams and McDonald1986; Díez Minguela Reference Díez Minguela2010; Gustafson and Fransson Reference Gustafson and Fransson2015; Mignot Reference Mignot2010). The second observation can be described as joint or synchronised retirement. Several studies have shown that the retirement of one spouse often has a considerable influence on the timing of the other spouse's retirement and that many couples prefer to retire simultaneously even if there is an age difference between the spouses (Blau Reference Blau1998; Gustman and Steinmeier Reference Gustman and Steinmeier2000, Reference Gustman and Steinmeier2004; Honoré and de Paula Reference Honoré and de Paula2014; Hurd Reference Hurd and Wise1990; O'Rand and Farkas Reference O'Rand and Farkas2002; Pienta Reference Pienta2003).
Synchronised retirement may have consequences both for society at large and for individual retirees. If younger spouses retire early to synchronise with older spouses, this will reduce the overall supply of labour. An opposite effect is also possible if older spouses work longer to await the retirement of their younger spouses (Johnson Reference Johnson2004, Reference Johnson2009; Klevmarken Reference Klevmarken2010; Szinovacz and Davey Reference Szinovacz and Davey2004). In either case, given that men-older couples are far more common than women-older couples, the net effect will mostly be that men work longer than women. Due to concerns about ageing populations and the future viability of pension systems, several Western countries have launched, or are currently considering launching, pension reforms that encourage older persons to delay retirement. These reforms generally reward those who work longer while providing less favourable economic conditions for those who retire early. Synchronised retirement may thus contribute to economic inequality between male and female retirees. Moreover, gender theory and research suggest that synchronised retirement tends to conserve traditional gender roles within the couple, whereas independent retirement might potentially disrupt such roles (Arber and Ginn Reference Arber, Ginn, Arber and Ginn1995; Moen, Kim and Hofmeister Reference Moen, Kim and Hofmeister2001; Szinovacz and Davey Reference Szinovacz and Davey2004). There are therefore several good reasons to examine retirement synchronisation.
Yet synchronised retirement is a complex issue to study, in at least three respects. First, synchronisation is a couple-level rather than an individual-level event (Loretto and Vickerstaff Reference Loretto and Vickerstaff2012). Several studies have shown that the retirement decision of one spouse may be affected not only by individual characteristics of this spouse, but also by characteristics of the other spouse and of the couple (e.g. Blau Reference Blau1998; Coile Reference Coile2004; Denaeghel, Mortelmans and Borghgraef Reference Denaeghel, Mortelmans and Borghgraef2011). Second, theories about gender roles and social status suggest that the mechanisms underlying synchronisation may look different in men-older couples, same-age couples and women-older couples (Moen, Kim and Hofmeister Reference Moen, Kim and Hofmeister2001; Myers and Booth Reference Myers and Booth1996). Third, synchronisation in age-dissimilar couples may occur either because the younger spouse retires earlier than he or she would otherwise have done to synchronise with the older spouse, or because the older spouse continues working longer to await the retirement of the younger spouse – or a combination of both (Johnson Reference Johnson2004; Klevmarken Reference Klevmarken2010). These issues need to be considered when examining retirement synchronisation.
The present study used high-quality register data from Sweden to explore to what extent and under what circumstances married dual-earner couples synchronise their retirement. The following research questions were examined:
-
1. To what extent do married dual-earner couples in Sweden synchronise their retirement?
-
2. How is synchronisation associated with spousal age differences and gender? How common is synchronisation in same-age, women-older and men-older couples?
-
3. To what extent are individual and couple characteristics other than age differences and gender associated with synchronisation?
-
4. How is synchronisation associated with retirement age? Do spouses in synchronising couples retire earlier or later than spouses in other couples?
Theoretical perspectives
Spousal age difference – which most often involves men-older couples – is a well-known phenomenon throughout the world that may have consequences in several areas. One such area is retirement. In recent years, research on retirement has increasingly come to acknowledge that the decision to retire is often made in the context of the couple or household (e.g. An, Christensen and Datta Gupta Reference An, Christensen and Datta Gupta2004; Blau Reference Blau1998; Johnson and Favreault Reference Johnson and Favreault2001; Syse et al. Reference Syse, Solem, Ugreninov, Mykletun and Furunes2014; Szinovacz and DeViney 2001). It seems that many older couples want to retire together, i.e. to synchronise their retirement, even if they differ in age (Arber and Ginn Reference Arber, Ginn, Arber and Ginn1995; Johnson Reference Johnson2004; Pienta Reference Pienta2003).
The present study puts the focus on this particular aspect of spousal retirement patterns. As social scientists have attempted to explain synchronised retirement, two different theoretical arguments have emerged. One concerns preferences for joint leisure, often conceptualised as ‘leisure complementarity’; the other concerns gender roles and social status.
The notion of leisure complementarity, drawing on economic research and rational choice theory, explains retirement synchronisation with reference to the general preference, among married women and men, to spend leisure time together (Blau Reference Blau1998; Casanova Reference Casanova2010; Gustman and Steinmeier Reference Gustman and Steinmeier2004; Schirle Reference Schirle2008). Several studies have shown that both women and men are more likely to retire if their spouses retire (or are already retired) than if their spouses keep on working (Pienta Reference Pienta2003; Schirle Reference Schirle2008; Syse et al. Reference Syse, Solem, Ugreninov, Mykletun and Furunes2014). There is also evidence that spouses express a preference for spending time and doing things together once retired (Coile Reference Coile2004), and relatively often make plans for joint retirement (Ho and Raymo Reference Ho and Raymo2009; Honoré and de Paula Reference Honoré and de Paula2014). Such preferences may be an important predictor of retirement behaviour, to some extent overriding economic incentives (Coile Reference Coile2004; Gustman and Steinmeier Reference Gustman and Steinmeier2004).
Other explanations draw on theories from sociology and social psychology concerning gender roles and social status. According to traditional gender role expectations, women are attributed the main responsibility for domestic work whereas men are presumed to be the primary breadwinners. If men in men-older couples retire before their wives, these roles may be difficult to uphold and to some extent even become reversed (Arber and Ginn Reference Arber, Ginn, Arber and Ginn1995; Moen, Kim and Hofmeister Reference Moen, Kim and Hofmeister2001). Research suggests that this tends to increase marital conflict and to decrease marital quality for both women and men (Myers and Booth Reference Myers and Booth1996; Szinovacz and Davey Reference Szinovacz and Davey2004). Synchronisation, according to this argument, may therefore be an attempt to avoid problems associated with status incongruence and disruption of traditional gender roles. It may also reflect gendered power relations in the marriage (Szinovacz and DeViney Reference Szinovacz and DeViney2000).
Importantly, whereas the leisure complementarity literature assumes that preferences for joint leisure exist in all kinds of couples, arguments about gender and social status primarily concern synchronisation in men-older couples. Theoretically, this suggests that the mechanisms behind synchronisation may look different in men-older, women-older and same-age couples.
Previous empirical studies
Several studies indicate that synchronised retirement is relatively common, although the figures vary depending on the definition of synchronisation, the definition and measurement of retirement, and the population under study. Arber and Ginn (Reference Arber, Ginn, Arber and Ginn1995) reported joint retirement (within six months) among 17 per cent of British couples, including persons who had not been in the labour force. Hurd (Reference Hurd and Wise1990) examined retired male and female workers in the United States of America (USA), and found a synchronisation rate (retirement ‘in the same year’) of 25 per cent in the male sample and 28 per cent in the female sample. Blau (Reference Blau1998), in a similar study of US couples where both spouses had a registered exit from the labour force, found that 30 per cent of these couples retired within one year. Johnson (Reference Johnson2004), using more recent US data on working couples, found that around 19 per cent retired the same year, whereas Coile (Reference Coile2004) reported a 15 per cent synchronisation rate (within one year) in US couples where both spouses were working at age 50. O'Rand and Farkas (Reference O'Rand and Farkas2002), also using US survey data on working couples, found that synchronisation within 12 months occurred in 39 per cent of couples where at least one of the spouses retired during the time-frame under study. Szinovacz (Reference Szinovacz2002), using survey data on couples where both spouses had left paid employment, report synchronisation rates (same or next calendar year) of 31 per cent in Austria and 41 per cent in the USA.
Not surprisingly, synchronisation is more common in couples with small or no age differences, whereas large age differences make it difficult to synchronise (Blau Reference Blau1998; Hurd Reference Hurd and Wise1990; Johnson Reference Johnson2004). A number of studies have also found a gender dimension in synchronisation. As gender theory suggests, it seems that men in particular want to avoid a situation where the husband retires but the wife is still working. In men-older couples, men therefore tend to either postpone their own retirement or encourage their wives to retire early (Gustman and Steinmeier Reference Gustman and Steinmeier2000, Reference Gustman and Steinmeier2009; Moen, Kim and Hofmeister Reference Moen, Kim and Hofmeister2001; Pienta and Hayward Reference Pienta and Hayward2002; Smith and Moen Reference Smith and Moen1998). This is likely to promote synchronisation, and higher synchronisation rates in men-older couples than in women-older couples have been reported in a few studies (Arber and Ginn Reference Arber, Ginn, Arber and Ginn1995; Johnson Reference Johnson2004). However, a recent study by Syse et al. (Reference Syse, Solem, Ugreninov, Mykletun and Furunes2014) found no significant gender differences in synchronisation, and Dahl, Nilsen and Vaage (Reference Dahl, Nilsen and Vaage2003) found no association between spousal age differences and early retirement.
In addition to gender and age differences, a range of other factors may influence the timing of retirement. These include income and wealth (An, Christensen and Datta Gupta Reference An, Christensen and Datta Gupta2004; Bloemen Reference Bloemen2011; Jørgensen Reference Jørgensen2012), pension and social security entitlement (Baker Reference Baker2002; Coile Reference Coile2004; Gruber and Wise Reference Gruber and Wise1998; Gustman and Steinmeier Reference Gustman and Steinmeier2004; Johnson Reference Johnson2004), health and health insurance (An, Christensen and Datta Gupta Reference An, Christensen and Datta Gupta2004; Blau and Gilleskie Reference Blau and Gilleskie2006; Denaeghel, Mortelmans and Borghgraef Reference Denaeghel, Mortelmans and Borghgraef2011; Pienta and Hayward Reference Pienta and Hayward2002), employment (Johnson and Favreault Reference Johnson and Favreault2001; Klevmarken Reference Klevmarken2010; Parry and Taylor Reference Parry and Taylor2007), education (Blau Reference Blau1998; Klevmarken Reference Klevmarken2010), ethnicity (Pienta Reference Pienta2003) and family situation (Sundsback Halse Reference Sundsback Halse2008; Szinowacz and DeViney Reference Szinovacz and DeViney2000). It is less clear how these factors relate to the specific phenomenon of synchronisation. Few studies have had an explicit focus on synchronisation, and it is difficult to distinguish any systematic patterns in their findings (An, Christensen and Datta Gupta Reference An, Christensen and Datta Gupta2004; Arber and Ginn Reference Arber, Ginn, Arber and Ginn1995; Blau Reference Blau1998; Henretta, O'Rand and Chan Reference Henretta, O'Rand and Chan1993).
With regard to synchronisation and retirement age, the predominance of men-older couples means that, in most synchronising couples, the husband will retire at a higher age than the wife. Theorists with a focus on gender roles and social status often seem to assume that older husbands are exerting influence on their younger wives to retire earlier than they would otherwise have done, rather than postponing their own retirement (e.g. Arber and Ginn Reference Arber, Ginn, Arber and Ginn1995; Smith and Moen Reference Smith and Moen1998). Yet the empirical support for this assumption is unclear, as the association between synchronisation and retirement age has not been systematically examined in previous research. A study by Szinovacz (Reference Szinovacz2002) suggests that the effect of synchronisation on retirement age depends to an important extent on the design of national pension programmes.
Age differences, retirement and pensions in Sweden
Retirement behaviour and retirement age may differ between countries, due to demographic characteristics, cultural norms and, in particular, legal, institutional and economic conditions for retirement (Arber and Ginn Reference Arber, Ginn, Arber and Ginn1995; Coile Reference Coile2004; Jørgensen Reference Jørgensen2012; Szinovacz Reference Szinovacz2002). The present study examined retirement patterns in Sweden using data from 2002 to 2010. During this period, the proportions of married persons in the age span where retirement normally occurs, 55–69 years, were on average 60 per cent for women and 63 per cent for men, with a slightly declining tendency over time, according to population data from Statistics Sweden (www.statistikdatabasen.scb.se). Average spousal age differences at marriage had been between two and three and a half years for most of the 20th century, and were just under three years in the early 2000s (Bergstrom and Lam Reference Bergstrom and Lam1989; Statistics Sweden 2010). The present study was restricted to married couples, as official data on unmarried co-habitation are not available. Sweden is known for having high rates of unmarried co-habitation. However, most unmarried couples either dissolve or eventually marry (Holland Reference Holland2013; Thomson and Bernhardt Reference Thomson and Bernhardt2010), and recent estimates made by Statistics Sweden indicate that well over 80 per cent of Swedish couples in the age span 55–69 years are married (www.statistikdatabasen.scb.se).
Swedish society is also characterised by strong social and political norms of gender equality and dual-earner couples (Halleröd Reference Halleröd2005; Rothstein Reference Rothstein2012). Female labour participation is high. Between 2000 and 2010, 82 per cent of women aged 45–54 were employed, in comparison with 84 per cent of men in the same age group. However, part-time work was relatively common among women. Data from 2005 onwards indicate that 29 per cent of employed women, but only 7 per cent of employed men, had a contracted working time of less than 35 hours per week (www.statistikdatabasen.scb.se). Women also tend to retire earlier than men, but the difference is modest – on average less than one year according to estimations from the Swedish Social Insurance Agency (Försäkringskassan 2006; see also Klevmarken Reference Klevmarken2010).
Sweden has a universal old-age pension system, based on a combination of public and occupational pensions. Public pensions can be paid out from age 61, but the minimum age for ‘guarantee pension’, available to those who have had low or no work-related incomes, is 65 (Hallberg Reference Hallberg2003; Sundén Reference Sundén2006). Almost all employees in Sweden are also eligible for occupational pensions, based on central agreements between their employers and trade unions. According to current agreements, occupational pensions for private-sector and local government employees can be paid out from age 55, whereas for state employees the minimum age is 61. However, for those who have earned occupational pension rights during earlier agreements, various transitional rules may apply (information on current schemes is available at www.minpension.se/tjanstepension; see also Statistics Sweden 2009). In addition, private pension schemes have become an increasingly common complement to public and occupational pensions (Flood and Klevmarken Reference Flood, Klevmarken, Klevmarken and Lindgren2008). Pensions from such schemes can normally be paid out from age 55 (Statistics Sweden 2009).
The current Swedish pension system is the result of a major pension reform, passed in 1998 (Sundén Reference Sundén2006) and implemented in 2003 (cf. Statistics Sweden 2009). The reform aimed at ensuring the long-term economic viability of the pension system, partly by encouraging older persons to delay retirement. Previously, retirement at age 65 had been the legal norm, although in reality earlier retirement had been common. The reform included economic incentives to work longer and a legal right for all employees to continue working until age 67. The information that accompanied the reform emphasised that there was no longer any normal retirement age, but that individuals had to make their own decisions about when to retire – and take the economic consequences of these decisions. However, due to the design of the reform, pension payments for most retiring persons examined in the present study came from a combination of the new and old systems (Klevmarken Reference Klevmarken2010; Statistics Sweden 2009; Sundén Reference Sundén2006).
Methods
Data and population
The study was designed to examine to what extent working couples with various age relationships chose to synchronise their retirement. It is not a total study of overall retirement patterns in the Swedish population, but focuses on persons who initially belonged to the labour force and whose transitions to retirement can be estimated with some certainty.
The main analyses examined couples where both spouses were in the labour force in 2002, but at least one of the spouses retired between 2003 and 2008. Register data from Statistics Sweden for the years 2002–2010 were used for the analyses. These are high-quality individual-level data for the entire Swedish population, collected for the production of official statistics. In a first step, data from 2002 were used to identify all married couples where both spouses were in the labour force. The criterion for being in the labour force was that each spouse should have work-related incomes of at least 1.5 Basic Income Amounts (BIA), or SEK 58,200. The BIA (inkomstbasbeloppet) is an indexed amount, based on average labour earnings in the Swedish working population and used, among other things, for calculating various benefits and thresholds in the Swedish pension system.
In a second step, couples where at least one of the spouses retired between 2003 and 2008 were identified. As Statistics Sweden does not have self-reported data on retirement, annual income data were used to estimate retirement year. Methods for such estimations have been developed and validated in several previous studies using Swedish register data (Glans Reference Glans2008; Hallberg Reference Hallberg2011; Palme and Svensson Reference Palme, Svensson, Gruber and Wise2004). The present study largely followed the method used by Glans (Reference Glans2008), which compares work-related incomes, broadly defined, with pension incomes. Work-related incomes include salaries and income from self-employment, but also temporary sickness benefits, unemployment benefits and adult education benefits, as such incomes indicate that the recipients are still in the labour force. Pension incomes include public pensions, occupational pensions, withdrawals from private pension funds and permanent sickness benefits.
Persons were defined as retired when their work-related incomes were below 1.5 BIA and their pension incomes above 1.5 BIA. The threshold of 1.5 BIA was chosen to ensure that persons with the minimum guarantee pension level would be defined as retired. Persons were also defined as retired if their work-related income was zero and they had some pension income. Year of retirement was defined as the first year in which either of these two patterns occurred if pension income was zero the previous year. If the person had some pension income the previous year, the previous year was defined as year of retirement (cf. Glans Reference Glans2008).
Persons with missing income data any year prior to retirement, with unclear patterns of incomes from work versus pensions, or with retirement age under 55 (the earliest age for occupational pensions and withdrawal from private pension funds) were excluded from the data-set together with their spouses. Couples were also excluded if either of the spouses who was defined as retired received permanent sickness benefits (sjukersättning; before 2003 the term was early retirement pension, förtidspension). For the purpose of the present study – to investigate to what extent spouses chose to synchronise their retirement – retirement decisions necessitated by poor health or disability were of less interest (cf. Glans Reference Glans2008). Additional conditions for inclusion were that both spouses should be alive, still married and living in Sweden until the year after the first spouse retired.
The final analysis of retirement age used a slightly different data-set. It included married individuals who retired between 2004 and 2008 and their spouses, regardless of whether the other spouse was in the labour force or was already retired in 2002. Using the main data-set, with couples where both spouses were in the labour force in 2002, would have systematically under-estimated average retirement age in non-synchronising couples. That is because this data-set included all individuals who retired before their spouses, but excluded many of those individuals who retired after their spouses. Including individuals who retired between 2004 and 2008, regardless of the work/retirement status of their spouses, gave a more balanced sample and more correct estimations of average retirement age. The reason for using 2004 (rather than 2003) as the starting year was to enable tests with a broad definition of synchronisation (plus or minus one year; see next section).
Analyses and variables
Two points from the theoretical review were central to the analytical strategy pursued here. First, theories about gender and social status suggest that synchronisation patterns may differ between men-older, women-older and same-age couples. Second, the notion of synchronisation as a couple-level event, reflecting joint preferences and/or complementary gender roles, speaks in favour of couple-level rather than individual-level analyses.
The initial descriptive analysis examined spousal age differences and synchronisation rates in couples with various age differences. A second round of multivariate analyses used regressions to examine how a range of socio-demographic characteristics of the spouses and the couple were associated with synchronisation. Given the theoretical and analytical focus on synchronisation or lack thereof – a dichotomous outcome – binary logistic regressions were preferred to the longitudinal approaches commonly used in earlier research on retirement.
The decision to synchronise retirement may depend on a range of socio-demographic factors. The following variables were used in the regression analyses:
-
• Level of education, with up to two years of secondary education categorised as low education, and three years of secondary education or higher categorised as high education. Persons with no registered education were classified as having a low education.
-
• Individual disposable income, according to the definition used by Statistics Sweden (2009) and controlled for inflation, was transformed into a dichotomy with incomes above/below the median income for all individuals in the database coded as high versus low income.
-
• Net assets was calculated as the difference between total assets and total debts using data from Statistics Sweden's register on taxed assets. This variable distinguished between persons with assets above 20 BIA and others.
-
• Sickness benefits for temporary sickness among employees (any versus no sickness benefits).
-
• Unemployment benefits, including benefits for participation in labour market programmes (any versus no such benefits).
-
• Country of birth, Sweden versus any other country.
-
• Years since marriage, based on a variable for ‘number of years in current civil status’.
-
• Grandchildren under age 18 still living with their parents (any versus no grandchildren), based on a variable describing the parents' household.
-
• Employment sector: those who had at least half their work-related income from self-employment were classified as self-employed. Others were classified as state, local government or private-sector employees, following Statistics Sweden's (2009) institutional sector code.
-
• First retirement year, i.e. the year when the first of the spouses in the couple was defined as retired (or both, if they synchronised).
-
• The age of the younger spouse the year the first of the spouses retired. Age was defined according to year of birth.
-
• Age difference between spouses.
The variables for education, income, assets, sickness, unemployment, years since marriage, grandchildren and employment sector were based on data, for both spouses, from the year before the first spouse retired. The analyses mostly used couple-level variables rather than separate individual-level variables for both spouses. Because synchronisation is a couple-level event, there are strong theoretical reasons for also using couple-level variables in the analyses – for example in order to highlight potential effects of differences in power or status between spouses. The construction of couple-level variables necessitated rather crude classifications (dichotomies). However, initial tentative analyses using individual-level variables strongly suggested that the advantages of couple-level variables outweighed the drawbacks of using broad categories.
The final analyses of synchronisation and retirement age used comparisons of mean retirement age in different groups. A separate analysis, using cross-tabulations, was also made of synchronising couples with various age differences.
Additional analyses were conducted to test the robustness of the results. First, the main analyses used a dichotomous measure of synchronisation, indicating whether or not both spouses were defined as retired during the same calendar year. Yet calendar year is a rather crude temporal measure. On the extreme, a couple where one spouse retired in January would be defined as synchronising if the other spouse retired in December the same year, but as not synchronising if the other spouse retired in December the year before. A more generous measure of synchronisation was therefore used as a complement. This measure also included couples where one spouse was defined as retired the year after the other spouse. Second, the multivariate analyses included couples where one of the spouses retired, regardless of the age of the other spouse. As retirement could by definition only occur at age 55 and later, additional regressions were made with a population restricted to couples where the younger spouse was at least 55 years old when the older spouse retired.
Results
Age differences, synchronisation and gender
The main data-set consisted of 83,986 couples where both spouses were initially in the labour force but at least one of the spouses retired between 2003 and 2008. In these couples, the husband was on average 2.7 years older than the wife, and 73.9 per cent were men-older couples. The wife was older than her husband in 16.2 per cent of the couples and only 9.9 per cent were same-age couples.
Synchronised retirement was not particularly common. Only 10.3 per cent of the married couples had the same retirement year. In 65.9 per cent of the couples, the husband retired before his wife, and in 23.9 per cent the wife was the first to retire. With the more generous definition of synchronisation, plus or minus one year, 25.1 per cent synchronised.
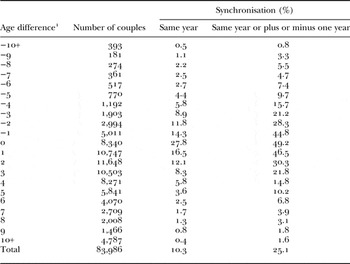
Synchronisation was strongly associated with age differences between spouses, as shown in Table 1. Among same-age couples, 27.8 per cent retired the same year and 49.2 per cent the same year or plus or minus one year. With growing age differences, the propensity to synchronise decreased rapidly. The fact that persons younger than 55 were not eligible for retirement pensions – and could therefore not fulfil the retirement criteria used here – obviously restricted the opportunities for synchronisation in couples with very large age differences. Synchronisation the same year occurred in 8.0 per cent of men-older couples and 10.1 per cent of women-older couples. For synchronisation the same or subsequent years, the figures were 21.2 and 28.2 per cent, respectively. However, the higher degree of synchronisation in women-older couples was largely due to the skewed distribution of age differences shown in Table 1, as the proportion of couples with large age differences (where synchronisation was uncommon) was much higher among men-older couples than among women-older couples. As shown in the last two columns of Table 1, synchronisation was in fact slightly more common in men-older than in women-older couples when age differences were small.
Age differences in retiring couples and percentage of couples who synchronised their retirement

Note: 1. Negative values for women-older couples, positive values for men-older couples.
These analyses indicate that synchronisation in Sweden was less common than gender theory and previous international research would suggest. The analyses excluded couples where one or both spouses retired with permanent sickness benefits. If such couples had been included, tentative analyses (not shown) indicate that synchronisation rates would have been even lower.
Variation in synchronisation
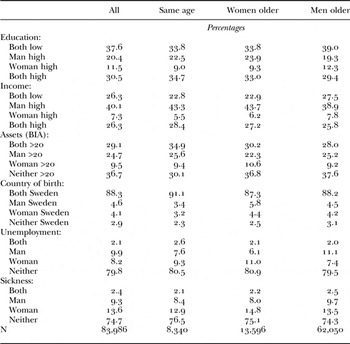
Next, a set of multivariate analyses were conducted to explore the relationship between synchronisation and a range of socio-economic and demographic characteristics: education, income, assets, country of birth, unemployment and sickness. Descriptive statistics for these variables are presented in Table 2. In addition, all analyses were controlled for number of years since marriage, grandchildren, first retirement year, employment sector and age of the younger spouse when the first spouse retired.
Descriptive statistics for the multivariate analyses

Note: BIA: Basic Income Amount.
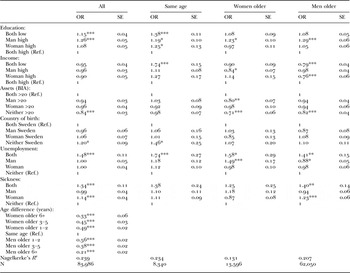
Results from the multivariate analyses are presented in Table 3. An initial analysis used the entire data-set, where age difference was included as a categorical variable (seven categories, with same-age couples as reference). Same-age couples were most likely to synchronise. In age-dissimilar couples, synchronisation was less likely the larger the age difference. Moreover, odds ratios for synchronisation were higher for men-older couples than for women-older couples when age differences were smaller (one to two years), but higher for women-older couples than for men-older couples when age differences were larger. These differences between men-older and women-older couples were statistically significant (p < 0.05). Couples where both spouses had a low education or where the wife but not the husband had a low education were more likely to synchronise than couples where both spouses had a high education. Incomes were not significantly related to synchronisation. One or both spouses having high assets was positively associated with synchronisation and couples where both spouses were born abroad were more likely to synchronise than native Swedish couples. Finally, couples where both spouses received unemployment benefits or sickness benefits, or where the wife but not the husband received sickness benefits, were more likely than others to synchronise.
Couple characteristics and synchronisation (same year), logistic regression

Notes: OR: odds ratio for synchronisation. SE: standard error. Ref.: reference category. BIA: Basic Income Amount. All analyses are controlled for number of years since marriage (continuous), first retirement year (categorical), both spouses' employment sector (categorical), grandchildren (categorical) and age of the younger spouse (continuous).
Significance levels: * p < 0.05, ** p < 0.01, *** p < 0.001.
Separate analyses of same-age, women-older and men-older couples showed that the effects of several variables depended on the age relationship in the couple. In same-age couples, the likelihood of synchronisation tended to increase with low education, low income, unemployment, sickness and non-Swedish origin. This stands out as a systematic pattern, although the strongest effects appeared when both spouses displayed these characteristics, and in the case of sickness benefits did not reach the p < 0.05 level (p = 0.067). Assets, on the other hand, were not significantly associated with synchronisation in same-age couples.
The results for age-dissimilar couples were less systematic, but displayed a few note-worthy tendencies. First, in both women-older and men-older couples, synchronisation was more likely if the younger spouse but not the older spouse had a low income, was unemployed or received sickness benefits. All these differences were significant at the p < 0.05 level, except for the difference between men-older couples where only the man versus only the woman received unemployment benefits. Second, in both women-older and men-older couples, synchronisation was more likely if the husband but not the wife had a high education. Third, if none of the spouses had assets over 20 BIA, the odds for synchronisation were lower than in couples where one or both spouses had such assets, although the difference was not significant in the case of women-older couples where only the man had assets over 20 BIA. Fourth, age-dissimilar couples where both spouses received unemployment benefits, and men-older couples where both spouses received sickness benefits, were also more likely to synchronise than couples where neither spouse experienced sickness or unemployment the year before retirement.
Most of these different patterns also appeared in regressions (not shown) that used the more generous measure of synchronisation, although some differences were not significant at the p < 0.05 level. The main exceptions were that no significant differences in synchronisation appeared with regard to education in women-older couples and in couples where both spouses were born abroad. The effects of sickness were also smaller when using the broader definition of synchronisation. As the definition of retirement did not allow retirement before age 55, tentative analyses (not shown) were also made with a population that excluded couples where the younger spouse was less than 55 years old when the older spouse retired. The results from these analyses differed very little from those presented in Table 3.
Moreover, making separate regressions for same-age, women-older and men-older couples involves certain statistical limitations, most importantly that odds ratios are not directly comparable across models. Tentative analyses (not shown) were therefore also made in which age difference was interacted with the six socio-demographic variables, with the same reference categories as in Table 3. In brief, these analyses indicate that when both spouses had a low education, low incomes or assets not exceeding 20 BIA, synchronisation was significantly more likely in same-age couples than in age-dissimilar couples. Also, when the woman but not the man had a high income, synchronisation was less likely in men-older couples than in other couples, and when the man but not the woman had a high income or assets over 20 BIA, synchronisation tended to be less likely in women-older couples. When the man but not the woman was unemployed, synchronisation was less likely in men-older couples than in other couples, and when the woman but not the man received sickness benefits, synchronisation was more likely in men-older couples than in women-older couples. The interaction analyses thus showed a number of significant between-group differences, the most systematic ones appearing between same-age couples and age-dissimilar couples. However, the main purpose of the multivariate analyses was not to compare individual odds ratios between groups, but to highlight the within-groups patterns displayed in Table 3.
Synchronisation and retirement age
How does synchronisation affect the timing of men's and women's retirement? Does the older spouse postpone retirement or does the younger spouse retire earlier in order to synchronise? And are the patterns in this respect the same for men and women? In order to explore these questions, a separate data-set was used, as described above, including couples where at least one of the spouses retired between 2004 and 2008, regardless of the work/retirement status of the other spouse. This data-set consisted of 114,270 couples in which 79,998 men and 75,185 women retired within the time-frame under study.
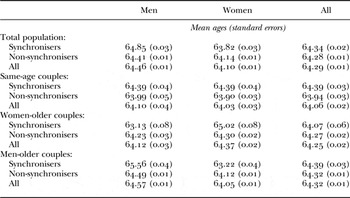
Table 4 examines average retirement age among those men and women. Figures for the total population show that the overall differences in average retirement age between synchronisers and non-synchronisers were very small. Yet men who synchronised their retirement tended to retire later than other men, whereas women who synchronised tended to retire earlier than other women.
Average retirement age, synchronisation (same year) and gender

Further analyses, which distinguish between same-age, women-older and men-older couples, indicated that this gender difference was partly a consequence of the predominance of men-older couples in the total population. In same-age couples, average retirement age was higher among synchronisers than among non-synchronisers, whereas in age-dissimilar couples that synchronised, the older spouse tended to retire later and the younger spouse earlier than in age-dissimilar couples that did not synchronise. These patterns appeared for both women and men.
However, average retirement age was higher in men-older couples that synchronised than in synchronising women-older couples, mainly because men in men-older couples tended to retire at a higher age. The difference between synchronisers and non-synchronisers in average retirement age was also larger in the case of men in men-older couples than among women in women-older couples. In Table 4, synchronisation is defined as retirement the same year, but the same analyses using the more liberal (plus or minus one year) measure of synchronisation displayed similar patterns (not shown).
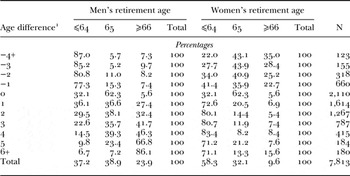
Table 5 provides a more detailed analysis of those 7,813 couples that synchronised their retirement (the same year) by examining the relationship between spousal age difference and the retirement age of the spouses. It is clear from the table that the previous normal retirement age in Sweden, 65 years, remained an important norm. When same-age couples synchronised their retirement, most of them (62.3%) did so at age 65. Some 32.1 per cent synchronised at an earlier age, and only 5.6 per cent of the same-age couples continued working after 65.
Age differences, retirement age and gender in synchronising couples (same year)

Note: 1. Negative values for women-older couples, positive values for men-older couples.
In age-dissimilar couples that synchronised their retirement, the younger spouse very often retired before age 65. This was the case both for men (80.1%) and for women (77.1%). However, men were more likely than women to continue working after 65 if they had a younger spouse (37.1 versus 25.2%). Women, on the other hand, were more likely than men to retire before age 65 even if they had a younger spouse (35.9 versus 27.5%). In Table 5, synchronisation was defined as retirement the same year, but these gender differences also appeared in analyses using the more generous measure of synchronisation (not shown). Together with the overall preponderance of men-older couples, the outcome of these patterns was that far more women than men in synchronising couples retired before age 65, and that more men than women in such couples retired after age 65.
Discussion
The present article has examined synchronised retirement in relation to spousal age differences and other socio-demographic factors, using comprehensive register data from Sweden. Four research questions have been explored.
The first question concerned the extent of synchronisation. Just over 10 per cent of dual-earner couples in Sweden retired the same calendar year and a further 15 per cent within one year. Although not fully comparable due to differences in research design, these proportions appear to be lower than those reported in several earlier studies, mainly from the USA (Blau Reference Blau1998; Hurd Reference Hurd and Wise1990; Johnson Reference Johnson2004; O'Rand and Farkas Reference O'Rand and Farkas2002; Szinovacz Reference Szinovacz2002). One reason may be that the present study used more recent data and that retirement trends have changed. More systematic longitudinal studies would be required to determine whether that is the case. Another reason may be national differences. Sweden is characterised by strong norms of gender equality and dual-earner (and dual-career) couples (Halleröd Reference Halleröd2005; Rothstein Reference Rothstein2012). This could hypothetically lead to more individualised patterns of work and retirement. Social and institutional norms concerning retirement age may also matter. Until recently, work after age 65 was discouraged or even precluded by legal and institutional norms in Sweden. Such norms obviously restricted the opportunities for age-dissimilar couples to synchronise, and the results presented here indicate that these norms remained influential in spite of the recent pension reform. However, more research is needed if we are to better understand how economic, cultural, institutional and other characteristics of the Swedish and other national settings affect synchronisation rates (cf. Szinovacz Reference Szinovacz2002).
A second question concerned the association between synchronisation, spousal age differences and gender. Synchronisation was more frequent in couples with small or no age differences. Overall, it also occurred in a larger proportion of women-older than men-older couples. This was largely a result of the skewed distribution of age differences. Further analyses indicated that the likelihood of synchronisation was higher in men-older couples than in women-older couples when age differences were small, whereas the pattern was reversed when age differences were larger. Thus, the theoretical assumption that synchronisation should be more common in men-older couples, due to a desire to avoid a situation with a retired husband and a working wife (Arber and Ginn Reference Arber, Ginn, Arber and Ginn1995; Moen, Kim and Hofmeister Reference Moen, Kim and Hofmeister2001), did not receive any clear support from the present study.
Synchronisation may also be associated with a range of other socio-demographic characteristics, as suggested by the third research question. Multivariate analyses used couple-level variables for exploring this, and same-age, women-older and men-older couples were examined in separate regression models.
In same-age couples, the odds of synchronisation were higher in couples where one or, in particular, both spouses had a low education or a low income, received unemployment or sickness benefits, or were of non-Swedish origin, whereas assets were not significantly associated with synchronisation. It thus seemed that, in same-age couples, more resources in terms of incomes, education, employment and health were associated with more individual timing of the spouses' retirement. All these kinds of resources may be associated with more stimulating work tasks, better working conditions and higher work satisfaction, which in turn may have reduced the ‘pull’ towards retirement. Swedish versus non-Swedish origin had a similar effect, but not assets. Assets may, on the one hand, also be associated with a good work situation but may, on the other, provide economic opportunities to synchronise retirement early for those with such preferences (Bloemen Reference Bloemen2011). Hypothetically, these two tendencies may have counterbalanced each other among same-age couples.
The results for women-older and men-older couples were more complex but nevertheless displayed some interesting patterns. These patterns differed in several respects from those found in same-age couples. For three variables, differences in synchronisation rates were not associated with men-older versus women-older couples, but rather with the characteristics of the older versus younger spouse in the couple. When the older spouse had superior resources in terms of income, employment or health, this promoted synchronisation regardless of gender. On the one hand, as discussed above, superior resources may reflect that the person has a stimulating job and therefore is more willing than his or her spouse to continue working and thus await the retirement of the younger spouse. On the other hand, having superior resources may imply an advantage in within-couple negotiations about retirement and an ability to exert influence on the younger spouse to retire early in order to synchronise. It is not clear, though, how these arguments relate to the finding that both men-older and women-older couples were more likely to synchronise if the husband but not the wife had a high education. If one or both spouses had assets over 20 BIA, this increased the odds of synchronisation in both men-older and women-older couples – a pattern that was not present in same-age couples. Assets may provide better opportunities for individuals to retire early, and this may be particularly important in facilitating synchronisation among age-dissimilar couples.
Yet the interpretations and explanations suggested here remain speculative. In most cases, further research based on interviews or questionnaires with self-reported reasons for retirement is necessary if we are to understand more fully the variation in synchronisation patterns. Importantly, such studies should include data on within-couple dynamics (Smith and Moen Reference Smith and Moen1998; Szinovacz and DeViney Reference Szinovacz and DeViney2000).
The final research question suggested that synchronisation, and its gender dimension, may have implications for women's and men's retirement age. In the total population, average retirement age differed very little between synchronisers and non-synchronisers, so the study does not indicate that synchronisation has any important effects on the total supply of labour. Yet women who synchronised tended to retire at an earlier age than other women, whereas men who synchronised tended to retire later than other men. This was partly an effect of the predominance of men-older relationships, but further analyses of synchronisation in age-dissimilar couples also indicated that men were more likely than women to continue working after age 65 in order to synchronise with a younger spouse. Overall, same-age couples that synchronised mostly did so at age 65. In age-dissimilar couples that synchronised, the younger spouse very often retired at an earlier age.
The research design implied a number of limitations. First, estimating retirement time from income data involves a degree of uncertainty. Some persons have incomes from both work and pensions for several years. Moreover, annual data give a rather crude measure of synchronisation, as discussed in the Methods section. Additional analyses were therefore carried out with a more liberal measure of synchronisation (plus or minus one calendar year). The results were similar but in some respects less clear-cut, so the more strict measure (retirement the same year) was used in the main analyses. Second, persons who retired from paid work before they were entitled to retirement pensions (i.e. before age 55) were not defined as retired. Defining retirement this way may underestimate synchronisation rates in couples with very large age differences, but this effect is probably small. The analyses shown in Table 3 were also re-run with the population limited to couples where the younger spouse was at least 55 years old when the older spouse retired, and the results were almost identical. Third, the study was restricted to married couples, as Statistics Sweden does not have full register data on unmarried co-habitants. As selection into marriage versus co-habitation is not random (Holland Reference Holland2013; Wiik, Bernhardt and Noack Reference Wiik, Bernhardt and Noack2009), further research would be required to determine to what extent the findings presented here apply to unmarried co-habitants. Fourth, there is also a non-random selection into age-similar versus age-dissimilar marriages (Gustafson and Fransson Reference Gustafson and Fransson2015; Mansour and McKinnish Reference Mansour and McKinnish2014; Mignot Reference Mignot2010). This selection may possibly be associated with spouses' propensity to synchronise retirement, for example if preferences for joint leisure vary due to the initial homogamy or heterogamy of the couple (cf. Berardo, Appel and Berardo Reference Berardo, Appel and Berardo1993; Larson and Holman Reference Larson and Holman1994). The current study did not have access to data on spouses' pre-marital characteristics, but the issue of marital selection should be borne in mind when interpreting variation in synchronisation rates. Finally, the present study primarily compared same-age, women-older and men-older couples. In the latter two categories, the association between synchronisation and various socio-demographic characteristics of the couples may differ depending on the size of the age gap. However, such differences are difficult to establish due to the very low overall rates of synchronisation in couples with large age differences.
In Sweden and many other countries, retirement age has economic consequences – the earlier a person retires, the lower his or her pension will be – and recent pension reforms have aimed at increasing the economic incentives to postpone retirement. Given the predominance of men-older couples, synchronisation often means that women retire at an earlier age than their husbands, and thus receive lower pensions than if they had retired at the same age. One may argue that this is of little importance, as married couples share their economic resources. Yet family research suggests that the idea of equal sharing between spouses co-exists with an idea of individual ownership and that individual incomes and assets may therefore affect the spouses' spending power and their bargaining position in the household (Burgoyne Reference Burgoyne1990; Nyman Reference Nyman2002). Current trends of individualisation may reinforce this tendency (Pahl Reference Pahl2005). Moreover, individual incomes do matter when one spouse dies, and due to the predominance of men-older couples and the higher average life-span among women (Statistics Sweden 2010), most wives outlive their husbands. Taken together, these observations suggest that synchronisation may reinforce economic inequality between male and female retirees. Examining the economic consequences of retirement synchronisation from a gender perspective would therefore be a highly relevant path for future research.
Another aspect to consider is that, even if working longer involves economic gains, early retirement and more leisure time may also have its benefits – an important point made by the leisure complementarity literature (Coile Reference Coile2004; Gustman and Steinmeier Reference Gustman and Steinmeier2004). If retirement represents liberation from a boring or stressful working life and the opportunity to pursue more pleasurable activities, it may rather be those who retire at an earlier age than their spouses who gain from synchronisation. Theory and research on gender roles and the gendered division of domestic work suggest that interpretations along these lines should be made with some caution, at least in the case of synchronisation in men-older couples (Rothstein Reference Rothstein2012). Yet more knowledge about decision-making processes and negotiations between spouses, with attention to gendered power relations, would be useful for better evaluating the synchronisation patterns examined here (Smith and Moen Reference Smith and Moen1998).
In addition to the empirical findings, the theoretical and analytical approach of the present article also merits attention. The initial review of previous research suggested that there were good theoretical reasons to examine synchronised retirement as a specific social and demographic phenomenon, to examine this phenomenon on the level of the couple, to distinguish between men-older, women-older and same-age couples in the analysis, and to consider how synchronisation was associated with retirement age. Subsequent analyses have clearly demonstrated the relevance of these assumptions. That per se constitutes a major contribution of the present study, which will hopefully inspire future research on retirement in general and on synchronised retirement in particular.
Acknowledgements
The research presented here was funded by Forte (The Swedish Research Council for Health, Working Life and Welfare, Reg. No. 2010-0070). The author wishes to thank Urban Fransson for initial work with the databases used for the study, and Cecilia Enström Öst and Mattias Engdahl for valuable feedback on earlier versions of the text. The study has been approved by the Regional Ethical Review Board, Uppsala (Reg. No. 2011/464).