I. INTRODUCTION
Microcellular plastics are foamed plastics produced using supercritical fluids (SCFs) such as N2 and CO2 as a physical blowing agent.Reference Gong, Turng, Park, Liao, Mohanty and Nalwa1, Reference Xu and Pierick2 The cell size and cell density of microcellular plastics generally range from 5 to 100 μm and 106 to 109 cells/cm3, respectively.Reference Xu3 Microcellular plastics can be produced using several processes such as microcellular extrusion, microcellular injection molding, and microcellular blow molding. In the past decade, microcellular injection molding has drawn considerable attention due to its ability to mass-produce molded parts with complicated geometries.Reference Xu and Pierick2 The microcellular injection molding process consists of three major steps.Reference Gong, Turng, Park, Liao, Mohanty and Nalwa1, Reference Gong, Yuan, Chandra, Winardi, Osorio and Turng4: (i) Gas Dissolution: SCF is injected into the barrel and mixed with the polymer melt to form a single-phase polymer–gas solution; (ii) Nucleation: Nucleation occurs at the nozzle or gate and is triggered by a rapid pressure drop; (iii) Cell Growth: Cell growth occurs during the molding stage and within the mold cavity. Cell growth is thermodynamically favorable only when the size of the nucleated cell is greater than the critical size; cells smaller than the critical size will dissolve back into the polymer–gas single-phase solution. Also, the cell growth rate is controlled by the gas diffusion rate and the melt strength of the polymer–gas solution.Reference Gong, Turng, Park, Liao, Mohanty and Nalwa1
Microcellular injection molding offers several advantages compared with conventional injection molding. The microcells can potentially improve mechanical properties by serving as crack arrestors due to blunting of the crack tip, thereby enhancing the material’s impact strength, fracture toughness, and fatigue life.Reference Gong, Turng, Park, Liao, Mohanty and Nalwa1, Reference Xu and Pierick2, Reference Gong, Yuan, Chandra, Winardi, Osorio and Turng4 Moreover, microcellular components exhibit near-zero shrinkage, excellent dimensional stability, and may be produced at lower cost (due to the use of less material and energy) and with a shorter cycle time.Reference Gong, Turng, Park, Liao, Mohanty and Nalwa1, Reference Xu and Pierick2, Reference Gong, Yuan, Chandra, Winardi, Osorio and Turng4–Reference Javadi, Kramschuster, Pilla, Lee, Gong and Turng6 Due to their unique properties, microcellular plastics are particularly attractive for applications such as food packaging, the automotive industry, sporting equipment, roof sheet insulators, microelectronic circuit board insulators, electronic wire insulation, and molecular-grade filters.Reference Gong, Turng, Park, Liao, Mohanty and Nalwa1, Reference Xu and Pierick2, Reference Gong, Yuan, Chandra, Winardi, Osorio and Turng4–Reference Javadi, Kramschuster, Pilla, Lee, Gong and Turng6
Poly(hydroxyalkanoates) (PHA) are a family of biobased aliphatic polyesters which have drawn significant attention due to their biodegradability, biocompatibility, and other material properties comparable to those of petroleum-based polymers.Reference Mohanty, Misra and Drzal7–Reference Barkoula, Garkhail and Peijs9 Poly(hydroxybutyrate-co-hydroxyvalerate) (PHBV) is the most widely studied copolymer in the PHA family owing to its broad range of potential applications such as packaging, automotive, and agricultural sectors.Reference Adamus10, Reference Gursel, Balcik, Arica, Akkus, Akkas and Hasirci11 However, certain inferior mechanical properties (e.g., low elongation-at-break, low impact strength and toughness), as well as poor thermal stability, limits its potential application.Reference Gursel, Balcik, Arica, Akkus, Akkas and Hasirci11 One of our previous studies demonstrated that blending tough polymers [e.g., poly(butylene adipate-co-terephthalate) (PBAT)] with PHBV (ENMAT 5010P, Ningbo City, China) could effectively improve the toughness and impact strength of PHBV.Reference Javadi, Kramschuster, Pilla, Lee, Gong and Turng6 However, high loading levels of tough polymer (e.g., ∼70 wt%) were required to effectively improve toughness and impact strength.Reference Javadi, Kramschuster, Pilla, Lee, Gong and Turng6
Hyperbranched polymers (HBPs) are dendritic polymers with a repetitive branching sequence and a globular structure.Reference Zhang and Sun12 HBP’s unique characteristics─including a high degree of branching and remarkably low viscosity (compared with linear polymers of similar molecular weights─make them an effective compatibilizer or toughening agent for polymers.Reference Bhardwaj and Mohanty13–Reference Pilla, Kramschuster, Lee, Clemons, Gong and Turng15 Moreover, inorganic nanofillers such as nanoclays (NCs) have been reported to improve the barrier properties, mechanical properties (e.g., Young’s modulus), and thermal stability of PHBV.Reference Choi, Kim, Park, Chang and Lee16–Reference Chen, Hao, Guo, Song and Zhang18
In the present study, both organic nanofiller (i.e., HBP) and inorganic nanofiller [i.e., organically modified NC (Cloisite® 30B, Louisville, KY)] have been incorporated into the PHBV–PBAT polymer blends. Solid and microcellular PHBV–PBAT blends and their HBP–NC nanocomposites were processed using conventional and microcellular injection molding processes. Three different formulations as listed in Table 1 were processed and their structure–property relationships were investigated.
The composition of various formulations.

II. EXPERIMENTAL
A. Materials and processing conditions
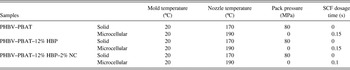
A PHBV–PBAT blend (ENMAT 5010P) with a blend ratio of PHBV: PBAT = 45:55 by weight was purchased, in pellet form, from Ningbo Tianan Biological Material Co. Ltd. (Tinan-ENMAT, Ningbo City, China). It has a specific gravity of 1.24 and a melt flow index of 11.8 g/10 min (175 °C, 2.16 kg). Boltorn H2004® (Perstorp, Sweden), a hyperbranched polyester (i.e., HBP) with a molecular weight of 3100 g/mol, was supplied by Perstorp Specialty Chemicals AB, Sweden. Poly(maleic anhydride-alt-1-octadecene) (PA) was purchased from the Sigma–Aldrich Company and used as a cross linking agent for the HBP. The organically modified montmorillonite NC, Cloisite® 30B, was obtained from Southern Clay Products, Inc. (Louisville, KY). The PA, Cloisite® 30B, and processing aids [i.e., two antioxidants (Naugard 10 and 524; Uniroyal Chemical Co., Geismar, LA) and one slip and antiblocking agent (Kemamide-W40; Witco Corp., Greenwich, CT)] were blended with the PHBV–PBAT matrix in various formulations as tabulated in Table 1. A kinetic mixer (K-mixer) (Vanzetti Systems Series 3009, Stoughton, MA) was used to prepare master batches in quantities of 200 g of PHBV–PBAT, PA, and Cloisite 30B, depending on the formulation. The K-mixer was turned on and once it reached to 150 °C, it was turned off. The resulting mixtures were hot-pressed into flat sheets and subsequently granulated. All of these master batches were then compounded with the PHBV–PBAT blend and HBP at the appropriate ratios to achieve the formulations described in Table 1 using a Cole–Parmer peristaltic pump (model #7553-80, Vernon Hills, IL) and mixed in a twin-screw extruder. The co-rotating twin-screw extruder has a screw diameter of 32 mm and an L/D ratio of 36.25. HBP was crosslinked with PA in situ during the melt extrusion of the PHBV–PBAT–HBP-based nanocomposite to further improve the toughening effect. Thereafter, different formulations were processed using an Arburg Allrounder 320S injection molding machine (Lossburg, Germany) with a 25 mm diameter screw and equipped with Mucell® technology (Trexel, Inc., Woburn, MA). The processing conditions for conventional and microcellular injection molding are presented in Table II.
Injection molding parameters for the PHBV–PBAT blend and its HBP–NC nanocomposites.

SCF N2 was introduced into the polymer melt inside the injection-molding barrel to process the microcellular components. The weight percentage of the required SCF can be calculated using Eq. (1),Reference Kramschuster, Pilla, Gong, Chandra and Turng5, Reference Javadi, Kramschuster, Pilla, Lee, Gong and Turng6, Reference Javadi, Srithep, Lee, Pilla, Clemons, Gong and Turng19, Reference Javadi, Srithep, Pilla, Lee, Gong and Turng20
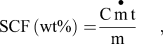
where C is the conversion factor of 27.8,  is the mass flow rate of the SCF (kg/h), t is the SCF dosage time (s), and m is the shot weight (g).
III. METHODS
Various techniques have been used to evaluate the mechanical, thermal, and morphological properties.
A. Tensile testing
The specific tensile properties (modulus, strength, toughness,and elongation at break) were measured at room conditions using a 5 kN load cell on an Instron Model 5566 tensile tester (Norwood, MA). The extension was set at 25.4 mm/min. All tests were carried out according to the ASTM standard (ASTM-D638). Five specimens of each sample were tested and the average results were reported.
B. Dynamic mechanical analysis (DMA)
The DMA experiments were carried out using a dynamic mechanical analyzer (DMA Q800, TA instruments, New Castle, DE). Rectangular specimens with a dimension of approximately (17 ✕ 12 ✕ 3) mm3 were cut from the injection molded parts and were tested in single-cantilever mode. The heating rate was 3 °C/min from −50 °C to 80 °C with 1 Hz frequency and 0.02% prestrain, which is in the linear viscoelastic region as determined by a strain sweep.
C. Differential scanning calorimetry (DSC)
Thermal properties were determined using differential scanning calorimetry (DSC; TA Instruments, model Auto DSC Q20, New Castle, DE). Samples were first heated from 40 °C to 200 °C, kept isothermal for 3 min at 200 °C, cooled down to −50 °C, and then reheated to 200 °C. The ramp rate for all of the heating and cooling cycles was 10 °C/min. The crystallization temperature (Tc), melting temperature (Tm), and apparent melting enthalpy (ΔHf) were determined from the DSC curves. Parameters Tm and ΔHf (J/g) were taken as the peak temperature and the area of the melting endotherm, respectively. The crystallinity (χc) of the PHBV phase was calculated by,

where ΔH° (PHBV) is the enthalpy of melting per gram of the perfect PHBV crystal (109 J/g) and w is the weight fraction of PHBV in the blend.Reference Addonizio, Martuscelli and Silvestre21
D. Wide-angle x-ray diffraction (WAXRD)
A WAXRD analysis was performed using Scintag XDS 2000 with Ni-filtered Cu Kα radiation (0.15418 nm; Cupertino, CA) at room temperature in the range of 2θ = 1.5–40° with a scanning rate of 2°/min.
E. Scanning electron microscopy (SEM)
SEM images of the fracture surfaces of injection-molded specimens were obtained using an ultra-highresolution field emission scanning electron microscopy (FE-SEM; Hitachi S-4800, Tokyo, Japan) operated at 5 kV. The fracture surfaces were obtained by freeze-cracking the injection-molded samples using liquid N2. All specimens were sputter-coated with a thin layer of gold-palladium (5 nm) prior to examination. The comparison among the SEM images of different specimens was made at the same magnification. Analysis of the average cell size and cell density was performed quantitatively using an image analysis tool (UTHSCSA image tool, San Antonio, TX). The cell density was calculated using the following formulaReference Naguib, Park, Panzer and Reichelt22:
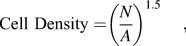
where N is the number of cells and A is the area wherein the number of cells was determined.
F. Transmission electron microscopy (TEM)
The structure of the PHBV–PBAT–HBP–NC nanocomposites was investigated using a Hitachi H-600 TEM operated at 75 kV (Tokyo, Japan). The ultrathin sections with a thickness of 70 nm were prepared using a cryo-ultramicrotome (Model# MT-7000, Tucson, AZ) without staining. The TEM sections were taken from the middle portion of the tensile test specimens.
IV. RESULTS AND DISCUSSIONS
A. WAXRD and TEM analysis
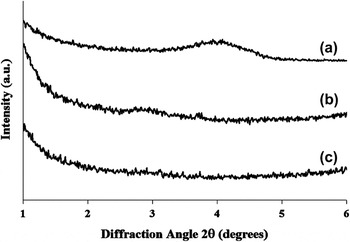
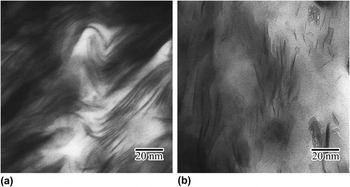
The structure of solid and microcellular PHBV–PBAT–12% HBP–2% NC nanocomposites was investigated using WAXRD and TEM as shown in Figs. 1 and 2. WAXRD determines the degree of NC dispersion by monitoring the position, shape, and intensity of their (001) diffraction peak. Generally, when the NCs are intercalated, the XRD will shift to lower angles because of the increase in the interlayer spacing (d001). When the NCs are completely exfoliated and/or heterogeneously intercalated, the (001) diffraction peak disappears. The interlayer distance after intercalation was calculated from the angular position 2θ using the Bragg formula [Eq. (4)], λ = 2 d001 sin θ (λCu Kα = 0.154 nm).Reference Lim, Hyun, Lee and Choi23

Wide-angle XRD patterns of (a) NC (Cloisite® 30B), (b) PHBV–PBAT–12% HBP–2% NC (solid), and (c) PHBV–PBAT–12% HBP–2% NC (microcellular).

TEM images of (a) PHBV–PBAT–12% HBP–2% NC (solid) and (b) PHBV–PBAT–12% HBP–2% NC (microcellular).

As depicted in Fig. 1, the (001) peak for NC (Cloisite® 30B) was observed at (2θ = 4.05°) with a corresponding interlayer spacing (d001) of 2.18 nm. However, the diffraction peaks of the NC in solid PHBV–PBAT–12% HBP–2% NC nanocomposites shifted to a lower angle (2θ = 2.96°) with a corresponding interlayer spacing (d001) of 2.99 nm, indicating NC intercalation.Reference Li, Turng, Gong and Erlacher24 This result was in accordance with qualitative TEM analysis of the solid PHBV–PBAT–12% HBP–2% NC nanocomposites which is shown in Fig. 2(a). The intercalation of the NCs in the PHBV–PBAT matrix was attributed to the formation of hydrogen bonding between the ester groups of PHBV–PBAT chains and the hydroxyl groups in the gallery of silicate layers of NCs.Reference Wang, Song, Chen, Guo, Liu, Zhang and Takeuchi17 For microcellular PHBV–PBAT–12% HBP–2% NC nanocomposites, the (001) diffraction peak for the NC completely disappeared. A qualitative analysis on the TEM image of microcellular PHBV–PBAT–12% HBP–2% NC nanocomposites showed that the NCs were partially exfoliated and/or heterogeneously intercalated.Reference Li, Park, Lee and Ha25, Reference Miao, Qiu, Yang and Ikehara26 Heterogeneous intercalation usually leads to a nonuniform interlayer spacing, which might be accompanied with the disappearance of the NC’s diffraction peak.Reference Chen, Wang, Lin, Chan and Wu27
B. Morphology of the fractured surfaces of the PHBV–PBAT blend and its HBP–NC nanocomposites
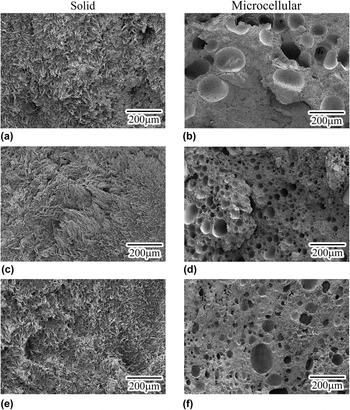
Figure 3 shows the SEM images of the PHBV–PBAT blend and its HBP–NC nanocomposites. As shown in Figs. 3(a), 3(c), and 3(e), the tensile fractured surfaces of the solid PHBV–PBAT blend, PHBV–PBAT–12% HBP, and PHBV–PBAT–12% HBP– 2% NC nanocomposites were relatively rough, indicating that the samples fractured under ductile mode.
Tensile fractured surfaces of solid and microcellular components made of (a) and (b) PHBV–PBAT blend; (c) and (d) PHBV–PBAT–12%HBP; and € and (f) PHBV–PBAT–12% HBP–2% NC.

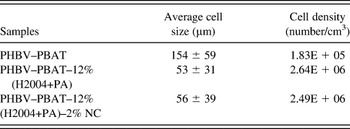
Figures 3(b), 3(d), and 3(f) show the representative images of the tensile fractured surface of the microcellular PHBV–PBAT blend, PHBV–PBAT–12% HBP, and PHBV–PBAT–12% HBP–2% NC nanocomposites, respectively. Quantitative analysis of the average cell size and cell density of the microcellular components was performed using an image analysis tool (UTHSCSA Image Tool, San Antonio, TX); the results are summarized in Table III. For cell morphology computation, only the center portion of the tensile bar was considered. As listed in Table III, with the addition of 12% HBP, the average cell size decreased to almost one-third and the cell density increased by more than one order of magnitude compared with that of the PHBV–PBAT blend. By adding 2% NC, the average cell size of the PHBV–PBAT–12% HBP–2% NC nanocomposites further decreased whereas the cell density increased.
Representative values of the average cell size and cell density of the microcellular PHBV–PBAT blend and its HBP–NC nanocomposites.

The observed reduction in the average cell size and enhancement in the average cell density caused by the addition of 12% HBP and/or 2% NC might be attributed to the following two causes. First, NC and HBP nanoparticles act as nucleating agents during the microcellular injection molding process, thereby facilitating the energy-favorable heterogeneous nucleation process.Reference McClurg28 Second, the addition of NC and HBP increased the melt viscosity and induced strain hardening, thus hampering cell coalescence and growth.Reference Lee, Zeng, Cao, Han, Shen and Xu29
C. Thermal properties
1. Thermal stability
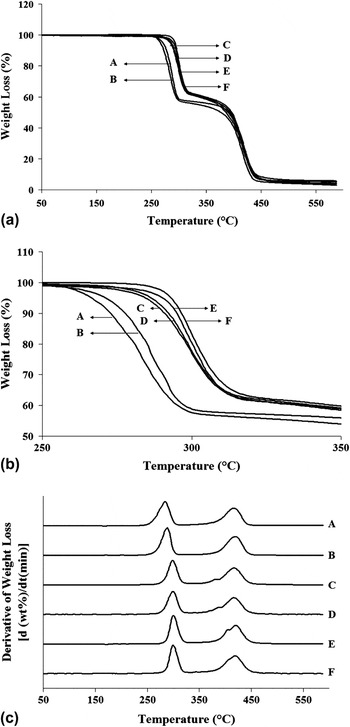
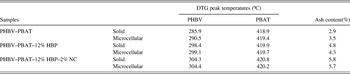
The thermal stability of the PHBV–PBAT blend and its HBP–NC nanocomposites was investigated using thermogravimetric analysis (TGA). Figures 4(a) and 4(b) show the weight loss of the PHBV–PBAT blend and its HBP–NC nanocomposites as a function of temperature. Figure 4(b) is a magnified image of Fig. 4(a) in the first major weight loss area (250–350 °C). As can be seen from the TGA curves, two major weight loss steps were observed for all samples. The first and second major weight losses can be attributed to PHBVReference Bruzaud and Bourmaud30 and PBAT,Reference Mohanty and Nayak31 respectively. The difference in the thermal decomposition behavior of the samples can be seen more clearly in the derivative thermogravimetry (DTG) [dw/dt (min)] curves [Fig. 4 (c)]. In Fig. 4(c), the DTG curves show double peaks for all samples, which indicates thermal degradation during the two major weight loss steps. The peak temperatures (i.e., the mid-points of the degradation at each major step) are a measure of thermal stability.Reference Wang, Song, Chen, Guo, Liu, Zhang and Takeuchi17, Reference Bruzaud and Bourmaud30 The peak temperatures obtained by DTG curves, as well as the ash content, are reported in Table IV. As can be observed, with the addition of 12% HBP, the first DTG peak (i.e., the PHBV decomposition temperature) shifted to a higher temperature for both the solid and microcellular components. This is attributed to the higher thermal stability of the HBP which decomposes at temperatures around 300 °C.Reference Bhardwaj and Mohanty13 Moreover, with the further addition of 2% NC, the first DTG peak slightly shifted to an even higher temperature for both solid and microcellular components, which might be attributed to the fact that NC acts as a heat barrier and enhances the thermal stability of the nanocomposites.Reference Sinha Ray, Okamoto, Yamada and Okamoto32
(a) and (b) Weight loss of the PHBV–PBAT blend and its HBP–NC nanocomposites with respect to temperature; and (c) DTG curves: (A) PHBV–PBAT blend (solid), (B) PHBV–PBAT blend (microcellular), (C) PHBV–PBAT–12% HBP (solid), (D) PHBV–PBAT–12% HBP (microcellular), (E) PHBV–PBAT–12% HBP–2% NC (solid), and (F) PHBV–PBAT–12% HBP–2% NC (microcellular).

Initial degradation temperatures, DTG peak temperatures, and the ash content of the PHBV–PBAT blend and its HBP–NC composites.

It should be noted that the addition of 12% HBP and 2% NC did not cause a significant change in the second DTG peak (i.e., PBAT). Moreover, the ash content increased with the addition of 12% HBP and 2% NC for both solid and microcellular components which might be attributed to improved thermal stability.Reference Bhardwaj and Mohanty13, Reference Sinha Ray, Okamoto, Yamada and Okamoto32
D. Crystallinity and melting behavior
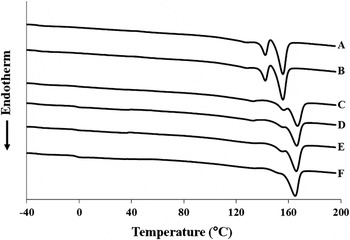
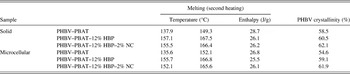
The crystallization and melting behavior of the PHBV–PBAT blend and its HBP–NC nanocomposites were studied using DSC. The thermograms of PHBV–PBAT blend and its HBP–NC nanocomposites, their numerical values of melting temperatures, melting enthalpies, and the degree of crystallinity obtained from the second heating cycle, are presented in Fig. 5 and Table V. The thermograms and data obtained from the second heating cycle provide the crystallization and melting behavior of the samples regardless of their thermal histories.
Thermograms of the solid and microcellular PHBV–PBAT blend and its HBP–NC nanocomposites obtained from the second heating run: (A) PHBV–PBAT (solid), (B) PHBV–PBAT (microcellular), (C) PHBV–PBAT–12% HBP (solid), (D) PHBV–PBAT–12% HBP (microcellular), (E) PHBV–PBAT–12% HBP–2% NC (solid), and (F) PHBV–PBAT–12% HBP–2% NC (microcellular).

Thermal properties of the solid and microcellular PHBV–PBAT blends and their HBP–NC nanocomposites obtained from the second heating run.

As shown in Fig. 5, the thermograms of the neat PHBV–PBAT blend showed double melting peaks. Since PBAT is amorphous, both melting peaks were attributed to PHBV.Reference Liu, Yang, Wang, Dong and Liu33 The presence of two melting peaks might be due to the different types of crystalline structures and/or differences in the thickness of the lamellar structure or differences in the size of the spherulites obtained during the crystallization process.Reference Liu, Yang, Wang, Dong and Liu33 With the addition of HBP and NC, the intensity of the lower melting peak was significantly reduced relative to the higher melting peak and both peaks shifted to higher temperatures. The observed increase in the melting temperatures can be attributed to the fact that HBP and NC nanoparticles acted as heterogeneous nucleation sites leading to a higher crystallization rate as well as the formation of more perfect and stable crystallites with higher lamellar thicknesses.Reference Liu, Yang, Wang, Dong and Liu33–Reference Ma, Wang, Wang, Zhang, Zhang and Hristova36
The degree of PHBV crystallinity (χ) in the PHBV–PBAT blend and its HBP–NC nanocomposites for both solid and microcellular components measured from the second heating cycle is tabulated in Table V. The percentage of HV in the PHBV copolymer used for this study was 2%. Previous studies have shown that PHBV copolymers with less than 40% hydroxyvalerate (HV), crystallize in the PHB crystalline lattice.Reference Adamus10, Reference Liu, Yang, Wang, Dong and Liu33 With the addition of 12% HBP, the degree of the PHBV crystallinity of the solid and microcellular components increased 2 and 4.5%, respectively. Also, the addition of 2% NC further increased the degree of PHBV crystallinity of the PHBV–PBAT–12% HBP–2% NC nanocomposites. HBP and NC acted as nucleating agents and thus facilitated the heterogeneous nucleation and crystallization process.Reference Masirek, Kulinski, Chionna, Piorkowska and Pracella37, Reference Pracella, Chionna, Anguillesi, Kulinski and Piorkowska38 In addition, for the same formulation, microcellular components showed a slightly lower degree of crystallinity compared with their solid counterparts.
E. Mechanical properties
1. Weight reduction of the microcellular components
Microcellular components produced via microcellular injection molding weigh less than the solid components produced via conventional injection molding using the same mold. The weight reductions of the microcellular components were 11.8, 10.4, and 10.5% for the PHBV–PBAT blend, PHBV–PBAT–12% HBP, and PHBV–PBAT–12% HBP–2% NC nanocomposite, respectively.
F. Dynamic mechanical properties
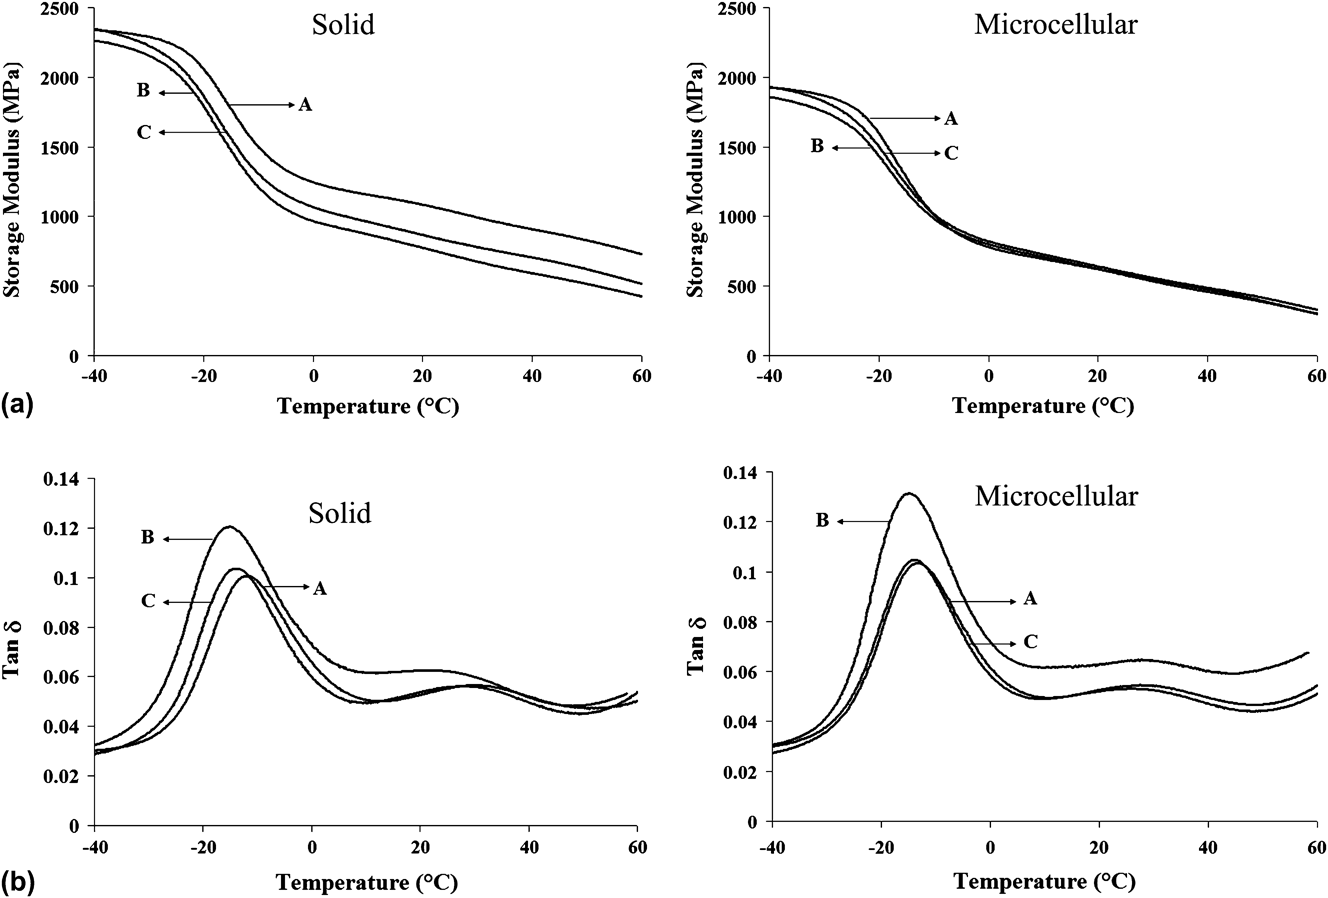
The viscoelastic properties of the solid and microcellular PHBV–PBAT blends and their HBP–NC nanocomposites were investigated using DMA. The effect of temperature on the storage modulus of different samples is shown in Fig. 6(a). As expected, the storage modulus (E′) of all of the samples decreased with an increasing temperature. In the glassy region (les than −20 °C), the storage modulus of the solid and microcellular components decreased with the addition of 12% HBP which may be due to an increased free volume in the PHBV–PBAT–12% HBP composites and hence a higher mobility of the polymer chains.Reference Bhardwaj and Mohanty13 With the further addition of 2% NC, the storage modulus of the solid and microcellular components increased compared with that of the PHBV–PBAT–12% HBP nanocomposites. This observed increase may be attributed to reduced polymer chain mobility resulting from the interaction of the polymer chains with the surfaces of the NC.Reference Bordes, Pollet and Averous39 For the same formulation, solid components had a higher storage modulus than their microcellular counterparts, which was caused by the presence of certain large voids in the microcellular components due to the dynamic nature of the microcellular injection molding process.Reference Kramschuster, Pilla, Gong, Chandra and Turng5, Reference Javadi, Kramschuster, Pilla, Lee, Gong and Turng6, Reference Javadi, Srithep, Lee, Pilla, Clemons, Gong and Turng19, Reference Javadi, Srithep, Pilla, Lee, Gong and Turng20
(a) Storage modulus as a function of temperature, and (b) Loss factor (tan δ) as a function of temperature where (A) is the PHBV–PBAT blend, (B) is PHBV–PBAT–12% HBP, and (C) is the PHBV–PBAT–12% HBP–2% NC nanocomposite.
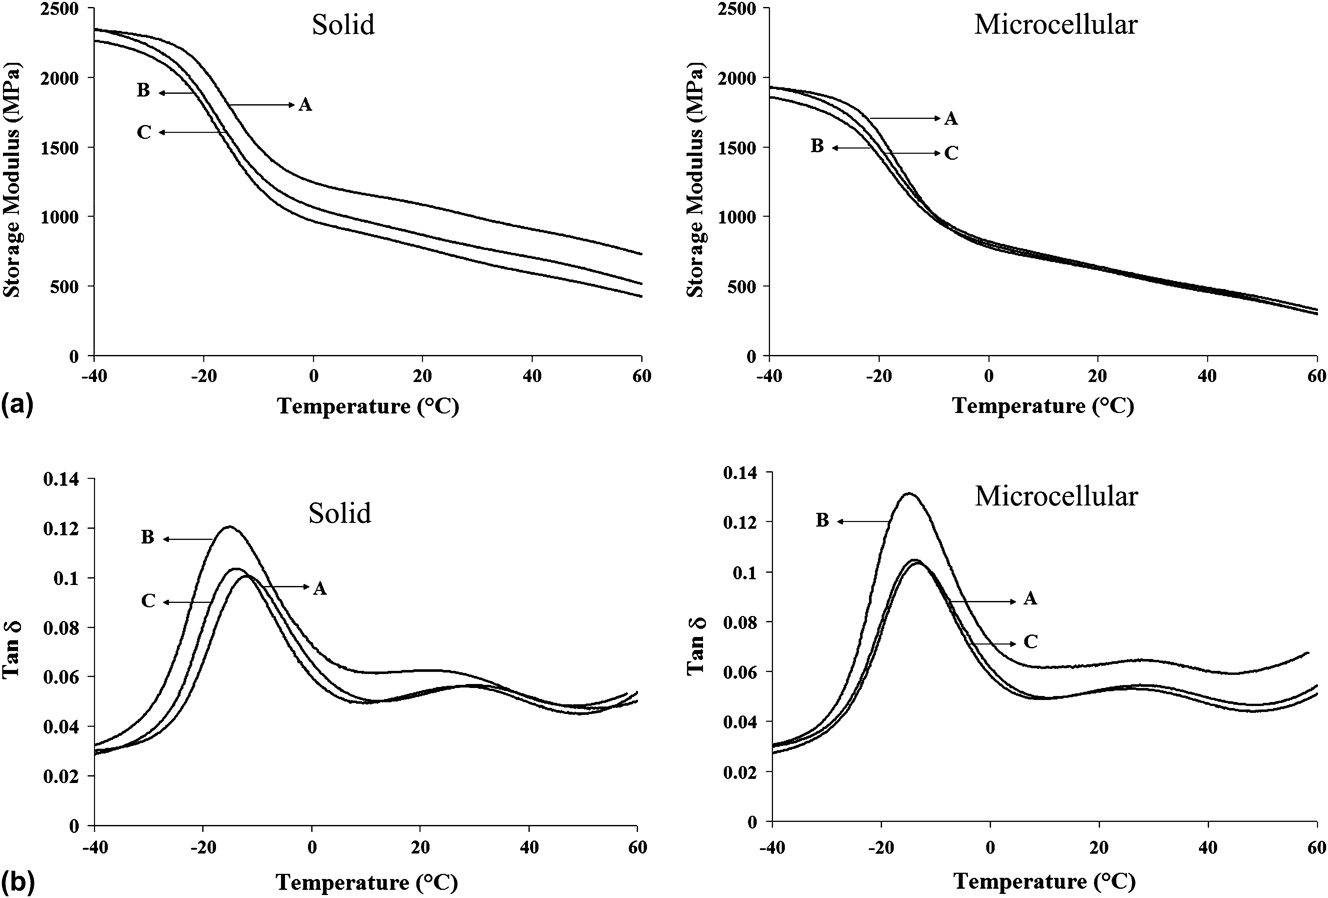
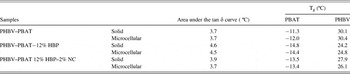
The tan δ curves, the numerical values of the glass transition temperature (Tg), and the area underneath the tan δ peak of the PHBV–PBAT blend and its HBP–NC nanocomposites are shown in Fig. 6 and Table VI. The area underneath the tan δ peak represents the material’s ability to absorb and dissipate energy.Reference Pothan, Oommen and Thomas40 With the addition of 12% HBP, the area underneath the tan δ peak of the solid and microcellular components increased compared with that of the neat PHBV–PBAT blend. This may be due to an increase in the free volume present in the PHBV–PBAT–12% HBP nanocomposites which enabled segmental motions of the polymer chains and subsequently improved their damping ability.Reference Bhardwaj and Mohanty13, Reference Lin, Zhang, Dong, Dong and Li41 However, the addition of 2% NC decreased the area underneath tan δ peak in both solid and microcellular components compared to that of PHBV–PBAT–12% HBP. This may be related to restricted polymer segmental motions as a result of NC intercalation and exfoliation.Reference Bordes, Pollet and Averous39 Also, microcellular samples had either the same or a higher area under the tan δ peak in comparison with their solid counterparts.
Numeric data of the glass transition temperature and the area underneath the tan δ peak of solid and microcellular PHBV–PBAT blends and their HBP–NC nanocomposites.

Finally, as shown in Table VI, the addition of 12% HBP slightly decreased the glass transition temperature (Tg) of both solid and microcellular components. As mentioned earlier, this is likely due to enhanced polymer chain mobility in the presence of crosslinked HBP.Reference Bhardwaj and Mohanty13, Reference Lin, Zhang, Dong, Dong and Li41 However, the further addition of 2% NC slightly increased the Tg in both solid and microcellular components which is likely due to the restriction of polymer chain movements as a result of NC intercalation and exfoliation.Reference Bordes, Pollet and Averous39
G. Static mechanical properties
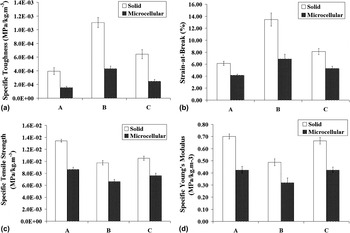
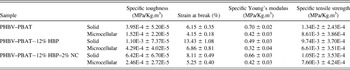
Figure 7 and Table VII show the specific mechanical properties of solid and microcellular PHBV–PBAT blends and their HBP–NC nanocomposites. The specific properties (i.e., specific strength, modulus, and toughness) were obtained by taking into account the density reduction.
(a) Specific toughness (MPa/kg.m-3), (b) Strain-at-break (%), (c) Specific Young’s modulus (MPa/kg.m-3), and (d) Specific tensile strength (MPa/kg.m-3) for (A) the PHBV–PBAT blend, (B) PHBV–PBAT–12% HBP, and (C) the PHBV–PBAT–12% HBP–2% NC nanocomposite.

Specific mechanical properties of solid and microcellular PHBV–PBAT blends and their HBP–NC nanocomposites.

Figure 7(a) shows the specific fracture toughness of the PHBV–PBAT blend and its HBP–NC nanocomposites. The specific fracture toughness was obtained by integration of the area under the stress–strain curve.Reference Kramschuster, Pilla, Gong, Chandra and Turng5, Reference Javadi, Kramschuster, Pilla, Lee, Gong and Turng6, Reference Javadi, Srithep, Lee, Pilla, Clemons, Gong and Turng19, Reference Javadi, Srithep, Pilla, Lee, Gong and Turng20 The addition of 12% HBP increased the specific fracture toughness by 178 and 182% for the solid and microcellular components, respectively. This can be attributed to: (i) the enhancement of free volume in PHBV–PBAT–12% HBP nanocomposites due to the incorporation of HBP nanoparticlesReference Bhardwaj and Mohanty13 (as discussed previously in the dynamic mechanical analysis section), and (ii) the promotion of possible toughening mechanisms such as multiple crazing, shear yielding, and cavitation where HBP nanoparticles act as rubber particles.Reference Bhardwaj and Mohanty13, Reference Argon, Cohen, Gebizlioglu, Brown and Kramer42–Reference Wong, Shanks and Hodzic44 The addition of 2% NC to the PHBV–PBAT–12% HBP nanocomposites decreased the specific fracture toughness for both solid and microcellular components which may be attributed to restricted polymer chain mobility in the presence of intercalated and exfoliated NCs.Reference Bordes, Pollet and Averous39 However, the specific toughness of PHBV–PBAT–12% HBP–2% NC nanocomposites was still higher than that of the neat PHBV–PBAT blend. Also, compared with their solid counterparts, microcellular components had lower average specific fracture toughness values likely due to the presence of certain large voids in the microcellular components.Reference Kramschuster, Pilla, Gong, Chandra and Turng5, Reference Javadi, Kramschuster, Pilla, Lee, Gong and Turng6, Reference Javadi, Srithep, Lee, Pilla, Clemons, Gong and Turng19, Reference Javadi, Srithep, Pilla, Lee, Gong and Turng20
As to the strain-at-break, it exhibited a similar trend to the specific toughness for the PHBV–PBAT blend and its HBP–NC nanocomposites [see Fig. 7(b)]. The addition of 12% HBP increased the strain-at-break of both the solid and microcellular PHBV–PBAT–12% HBP nanocomposite components by 118 and 65%, respectively. The addition of 2% NC to the PHBV–PBAT–12% HBP nanocomposites decreased the strain-at-break of both the solid and microcellular components; however, their strain-at-breaks were still higher than that of the neat PHBV–PBAT blend.
Finally, as shown in Figs. 7(c) and (d), the addition of 12% HBP into the PHBV–PBAT blend decreased the specific Young’s modulus and tensile strength of both the solid and microcellular components. However, the addition of 2% NC into the PHBV–PBAT–12% HBP nanocomposites increased the specific Young’s modulus and tensile strength of both the solid and microcellular components.Reference Sinha Ray, Okamoto, Yamada and Okamoto32, Reference Bordes, Pollet and Averous39 Moreover, the microcellular components had lower tensile Young’s moduli and tensile strengths than their solid counterparts which is attributed to the presence of certain large cells.Reference Kramschuster, Gong, Turng, Li and Li45
V. CONCLUSIONS
SCF N2 was used to fabricate microcellular PHBV–PBAT blends and their HBP–NC nanocomposites using the microcellular injection molding process. Three different formulations including the (i) PHBV–PBAT blend, (ii) PHBV–PBAT–12% HBP nanocomposite, and (iii) PHBV–PBAT–12% HBP–2% NC nanocomposite were studied. According to WAXRD and TEM analyses, NCs exhibited an intercalation structure for solid components, and a combination of exfoliation and heterogeneous intercalation structures for microcellular components. Incorporating 12% HBP and 2% NC into the PHBV–PBAT blend improved the thermal stability of the resulting nanocomposite. Also, the addition of 12% HBP and 2% NC reduced the average cell size and increased the cell density of the microcellular components. The degree of crystallinity increased with the incorporation of 12% HBP and 2% NC for both the solid and microcellular components. The addition of 12% HBP decreased the storage modulus, Young’s modulus, and tensile strength of the PHBV–PBAT–HBP nanocomposite for both solid and microcellular components. Furthermore, with the further addition of 2% NC, the storage modulus, Young’s modulus, and tensile strength of the resulting PHBV–PBAT–12% HBP–2% NC nanocomposites improved for both solid and microcellular components.
ACKNOWLEDGMENT
We gratefully acknowledge the financial support from the Environmental Protection Agency (EPA).