

Introduction
Banana is the fourth most important crop in the developing world, and India is the world's largest producer of banana and plantain, accounting for almost one-fifth of global production (Padmanaban et al., Reference Padmanaban, Sundararaju, Velayudhan and Sathiamoorthy2001). In India, the banana rhizome weevil/banana corm weevil, i.e. Cosmopolites sordidus (Germar) (Coleoptera: Curculionidae), is the most serious pest of banana (Ostmark, Reference Ostmark1974; Rukazambuga et al., Reference Rukazambuga, Gold and Gowen1998). This weevil belongs to the sub-family Rhynchophorinae, an economically important sub-family that includes pests of stored grains and other members that damage soft-trunked plants, such as aloe, banana, palm and sisal. The weevil is specific to Musa (banana and plantain), as well as to Ensete (Gold et al., Reference Gold, Pena and Karamura2001), and is distributed in all the world's major banana growing areas (Ostmark, Reference Ostmark1974). The adults, as well as larvae, cause severe damage affecting the production of banana in several tropical and sub-tropical regions (Ostmark, Reference Ostmark1974; Gold et al., Reference Gold, Pena and Karamura2001; Kiggundu et al., Reference Kiggundu, Pillay, Viljoen, Gold, Tushemereirwe and Kunert2003). Almost 100% loss of the banana crop can occur depending on the stage of plant growth at which pest infestation occurs, and also the efficiency of the management and cultivation practices followed (Rukazambuga et al., Reference Rukazambuga, Gold and Gowen1998; Gold et al., Reference Gold, Bagabe and Sendege1999a ; Reference Gold, Rukazambuga, Karamura, Nemeye, Night, Frison, Gold, Karamura and Sikora1999b ; Reference Gold, Pena and Karamura2001; Reference Gold, Kagezi, Night and Ragama2004). Use of conventional breeding in banana to transfer resistance is restricted, because of parthenocarpy (non-seeded nature and male/female sterility) of the banana plants. Organophosphorus insecticides, such as prothiofos, chlorpyrifos, pirimiphos-ethyl and ethoprophos, are applied to the corm, since the larvae and adults are cryptic in habit. Use of these insecticides gives rise to several environmental issues and has also resulted in the emergence of insecticide-resistant weevil strains (Collins et al., Reference Collins, Treverrow and Lambkin1991; Gold et al., Reference Gold, Bagabe and Sendege1999a ).
A broad integrated pest management (IPM) strategy would provide the best strategy for the successful control of this pest. Important components of a successful IPM programme would include identifying host plant resistance, cultural control, biological control and a study of the population structure of the pest. Important factors that contribute to the population structure of a pest species include genetic diversity, gene flow, migration, dispersal ability, population size, and life history. In spite of C. sordidus being a major pest of banana in India, to date, there have been no studies to assess the genetic diversity of Indian populations of the pest. In the present work, the genetic diversity within and between five populations of C. sordidus was assessed using random amplified polymorphic DNA (RAPD) and amplified fragment length polymorphism (AFLP) analyses, because these molecular approaches require no prior sequence information.
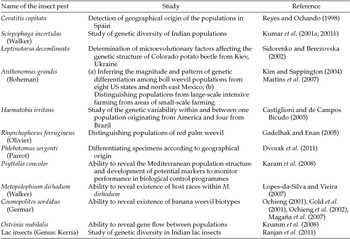
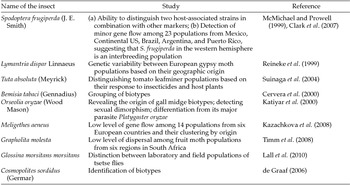
RAPD and AFLP are PCR-based DNA finger-printing techniques that have been used to study genetic diversity in different organisms. RAPD primers generate amplification products by annealing to homologous target sites on the template DNA, which are randomly distributed in the genome (Williams et al., Reference Williams, Kubelik, Livak, Rafalski and Tingey1990; Welsh and McClelland, Reference Welsh and McClelland1990). AFLP is based on selective PCR amplification of restriction fragments from a total genomic DNA digest. As dominant markers, co-migrating RAPD and AFLP amplification products need not necessarily represent the same locus or alleles. RAPDs require stringent standardization of protocols, to ensure reproducibility (Black, Reference Black1993). AFLP detects polymorphism at several hundreds of independent loci. Both these markers require no prior sequence information and have the potential to assess genome-wide variation. A few examples of their use in genetic diversity studies in insects are summarized in Tables 1a and 1b.
Examples of insect pests where RAPDs have proved useful in genetic diversity studies

Examples of insect pests where AFLPs have proved useful in genetic diversity studies

Assessment of the genetic variation between the five Indian populations of C. sordidus would help to determine their population structure, the level of gene flow between them, and whether or not they are genetically distinct. Such information is vital to draw conclusions about dispersal of banana corm weevil, since dispersal of the pest is an important factor to be considered while designing and implementing management programmes for its effective control. Knowledge about such aspects is important for the success of pest management practices, especially to understand the occurrence of resistance to insecticides and to devise suitable control strategies to prevent its spread (Aylor and Irwin, Reference Aylor and Irwin1999; Byrne, Reference Byrne1999).
Materials and methods
Sample collection
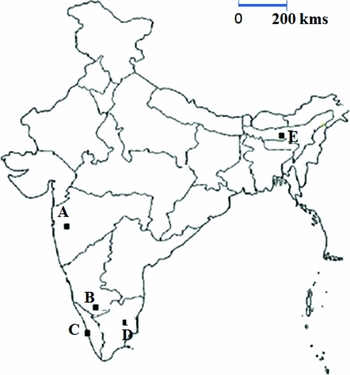
A total of 29 adult weevils of C. sordidus were collected from infested banana corms in banana fields from each of the following five locations: Kamrup (Assam), Calicut (Kerala), Narayangaon (Maharashtra), Nanjangud (Karnataka) and Trichy (Tamil Nadu) (Fig. 1). In each location, the individuals were collected within an area of 500 m2.
Geographic distribution of the populations of Cosmopolites sordidus (Germar) used in the present study. [On the map, the solid squares refer to the collection sites. In the key below, the states are shown in parentheses and the geographical coordinates are shown in square brackets. n = the number of individuals used for RAPD analysis.]
A – Narayangaon (Maharashtra) [19°7′22.45″N; 73°58′37.65″ E] (n = 6)
B – Nanjangud (Karnataka) [12°7′N; 76°44′E] (n = 6)
C – Calicut (Kerala) [11°14′52″ N; 75°46′49″E] (n = 6)
D – Trichy (Tamil Nadu) [19°53′35.28″ N; 73°43′52.63″ E] (n = 6)
E – Kamrup (Assam) [26°18′57.89″ N; 91°35′54.22″ E] (n = 5)].

DNA extraction
Total genomic DNA was extracted from individual beetles using the protocol of Dellaporta et al. (Reference Dellaporta, Wood and Hicks1983) with modifications as follows: The entire beetle was crushed to a fine powder in liquid nitrogen using a mortar and pestle. The powder was suspended for 15 min at 65 °C in pre-warmed extraction buffer [100 mM Tris (pH8), 50 mM EDTA, 500 mM NaCl, 1.25% SDS, 10 mM β-mercaptoethanol]. This was followed by the addition of 400 µl of chilled 5M potassium acetate per ml of the suspension. The suspension was then kept on ice for 1 h followed by centrifugation at 10,000 rpm for 10 min at 10 °C. An equal volume of Sevag's phase [chloroform and isoamyl alcohol (24:1)] was added to the supernatant followed by centrifugation at 10,000 rpm for 10 min at 10 °C. The DNA was precipitated from the aqueous layer by the addition of 750 µl of iso-propyl alcohol per ml of the aqueous layer. The tubes were kept overnight at room temperature to allow the DNA to precipitate. The precipitated DNA was collected by centrifugation at 10,000 rpm for 10 min at 10 °C and given a wash with 70% chilled alcohol. The DNA was air dried and dissolved in T10E1 buffer (pH 8.0). RNase treatment (50 µg/ml) was given to the DNA solution and the solution was deproteinized with equal volumes of phenol, chloroform: isoamyl alcohol mix and precipitated as described above. The DNA was dissolved in T10E1 (pH 8.0). The concentration of the extracted DNA was determined by agarose gel electrophoresis using λ DNA of known concentration.
RAPD-PCR amplification
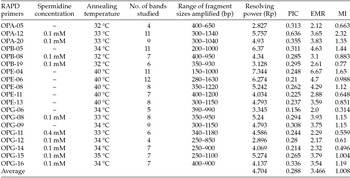
A total of 68 decanucleotide RAPD primers of the series A, B, G (20 primers per series) and E (8 primers) obtained from Operon Technologies Inc. (Alameda, CA, USA) were initially screened for identifying primers that would give clear amplification products. Of these primers, 19 RAPD primers gave clear amplification patterns and hence were selected for inter- and intra-population analyses (Table 2). RAPD-PCR was standardized with respect to the concentration of DNA, RAPD primer, temperature of annealing, Taq DNA Polymerase and spermidine concentration. The PCR reactions were carried out in a total volume of 25 µl containing 25 ng of genomic DNA, 0.1 mM dNTPs, 1 µM of primer, 1X Taq buffer, 1.5 U Taq DNA Polymerase (Bangalore Genei, India), and 0.1 mM/0.4 mM spermidine. The PCR cycle conditions for RAPD-PCR included an initial denaturation at 94 °C for 5 min followed by 35 cycles each of a denaturation step at 94 °C for 30 s; annealing at 32 to 40 °C (depending upon the primer) for 1 min; extension at 72 °C for 2 min followed by a final extension at 72 °C for 5 min. The PCR products were resolved on a 1.5% agarose gel stained with ethidium bromide (0.5 µg/ml).
Indices describing the polymorphism in the five populations of Cosmopolites sordidus (Germar) revealed by the 19 RAPD primers

Amplified fragment length polymorphism (AFLP) analysis
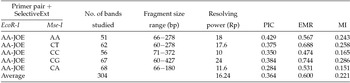
The AFLP protocol consists of the restriction of the DNA, ligation of the restricted DNA with adapters and a two-step amplification (pre-amplification and selective amplification) (Vos et al., Reference Vos, Hogers, Bleeker, Reijans, van de Lee, Hornes, Friters, Pot, Paleman, Kuiper and Zabeau1995). AFLP analysis was performed on pooled DNA from 10 Kamrup individuals and 20 individuals from each of the other populations. An initial screening using 60 pre-selective primer combinations was performed on the pooled DNA from the five locations. The following five selective primer combinations (EcoRI–MseI) with selective nucleotides, which gave clear and reproducible electrophoretic patterns and showed variation within and between populations, were chosen for further analyses: EcoRI-AA + MSeI-AA, EcoRI-AA + MSeI-CC, EcoRI-AA+ MSeI-CG, EcoRI-AA + MSeI-CT and EcoRI-AA + MseI CA (Table 3). Selective amplification products were separated with an Applied Biosystems automated sequencer. Fragments were scored automatically by the program Genemapper v3.7. For each combination, all loci showing a clear and unambiguous banding pattern were scored, whereas uncertain peaks were considered as missing data.
Indices describing the polymorphism in the five populations of Cosmopolites sordidus (Germar) revealed by AFLPs

Data scoring and analysis
A binary matrix was generated for the RAPD and AFLP data by scoring the presence of clear and unambiguous bands across the DNA samples at a particular locus as 1 and the absence of the band as 0. For each individual (for RAPDs) and each population (for AFLPs), the resolving power of the primer (Rp), polymorphic information content (PIC), effective multiplex ratio (EMR) and marker index (MI) values were calculated as follows: (i) Band informativeness (Ib) = 1−(2 × │0.5−p│), where p is the proportion of genotypes having the band. Rp of a primer is the sum of the band informativeness of all the bands amplified by that primer, i.e. Rp = ΣIb (Prevost and Wilkinson, Reference Prevost and Wilkinson1999; Guasmi et al., Reference Guasmi, Elfalleh, Hannachi, Fères, Touil, Marzougui, Triki and Ferchichi2012); (ii) PIC for each locus = 2fi (1−fi), where fi is the frequency of the genotypes having the band (Anderson et al., Reference Anderson, Churchill, Autrique, Tanksley and Sorrells1993). The PIC of a primer is the average of the PIC values of all the loci amplified by that primer; (iii) EMR is defined as the product n × β, where n = average number of bands detected per genotype for that marker and β = np/(np + nnp), where np = number of polymorphic loci and nnp is the number of non-polymorphic loci; (iv) Marker Index (MI) is a parameter that determines the utility of the marker for distinguishing the different genotypes (Powell et al., Reference Powell, Morgante, Andre, Hanafey, Vogel, Tingey and Rafalski1996; Archak et al., Reference Archak, Gaikwad, Gautam, Rao, Swamy and Karihaloo2003); (v) expected heterozygosity (Hn) for a genetic marker was calculated from the sum of the squares of allele frequencies as Hn = 1– (p 2+ q 2), where p is the frequency of individuals having the allele and q is the frequency of individuals lacking the allele. The arithmetic mean heterozygosity Hav for RAPDs was calculated as the arithmetic mean heterozygosity Hav, i.e. Hav = ∑Hn/n, where n is the number of markers or loci analyzed (Powell et al., Reference Powell, Morgante, Andre, Hanafey, Vogel, Tingey and Rafalski1996). The binary matrix was analyzed by POPGENE v 1.3 using a dominant marker data set assuming Hardy–Weinberg equilibrium for estimating diversity parameters, such as the percentage of polymorphism, heterozygosity (H), number of alleles (Na), number of effective alleles (Ne), Shannon's information index (I), coefficient of gene differentiation (Gst) and gene flow (Nm) (Nei, Reference Nei1973, Reference Nei1978; Nevo, Reference Nevo1978; Yeh et al., Reference Yeh, Rong-cai and Boyle1999). The coefficient of gene differentiation, i.e. GST values were estimated for the RAPDs data set. Gene flow was estimated from GST values and expressed as Nm = 0.5 (1−GST)/GST (McDermott and McDonald, Reference McDermott and McDonald1993). Geographical distances of pairs of populations for the Mantel test were calculated using the latitude and longitude of each population. The Mantel test was used to find out the correlation between geographical distances and genetic distances (Mantel, Reference Mantel1967). The Principal Coordinate Analysis (PCA) and Analysis of Molecular Variance (AMOVA) were carried out using the GenAlEx software v 6.1 (Peakall and Smouse, Reference Peakall and Smouse2006). For AMOVA analysis, total variance of the RAPD data set was partitioned at three hierarchical levels: (1) an among-population component; (2) a regional or five-population component; and (3) a within-population component.
Results
RAPD analysis
The 19 selected RAPD primers amplified a total of 147 bands ranging in size from 150 bp to 1630 bp, of which 111 (75.5 %) were polymorphic and 36 (24.4 %) were monomorphic (Table 2). The number of amplified bands ranged from 4 to 12 with primer OPE-06 giving the maximum of 12 bands and primers OPA-05 and OPG-12 giving the minimum number of 4 bands. Rp values ranged from 2.8 (OPA-05) to 7.3 (OPE-04) with an average of 4.704. The average PIC, EMR and MI values were 0.288, 3.466 and 1.008, respectively (Table 2). OPE 04 amplified a band of 150 bp only in the individuals from Kamrup and this band was absent in the other populations. Population-specific bands were not amplified by the other 18 primers.
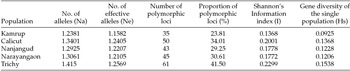
Results of the population diversity analysis using POPGENE are summarized in Table 4. The average number of observed alleles varied from 1.23 in the Kamrup population to 1.41 in the Trichy population, while the effective number of alleles varied from 1.16 (Kamrup) to 1.25 (Trichy). The intra-population genetic diversity was highest for the Trichy population (0.1538) and lowest for the Kamrup population (0.0925) with an average gene diversity within sub-populations (Hs) of 0.1253 (Table 4). The total genetic diversity (Ht) was 0.258. Shannon's information index varied from 0.1368 (Kamrup) to 0.2299 (Trichy). The percentage polymorphism varied from 23.81% (Kamrup) to 41.50% (Trichy), with an overall average polymorphism of 31.84% among the five populations.
Gene diversity indices among Cosmopolites sordidus (Germar) populations from five locations in India based on RAPD analysis

Pair-wise comparison of the populations showed that the genetic distance varied from 0.0858 between Narayangaon and Nanjangud to 0.2940 between Nanjangud and Kamrup (Table 5), suggesting that these populations were closely related. The total genetic differentiation coefficient (GST) among the populations was 0.515 and the gene flow estimate (Nm) among the populations was 0.469, suggesting little evidence of population sub-structure, because gene flow is considered significantly high when Nm > 1 (Table 6). AMOVA analysis and a PhiPT value of 0.493, which was significant at a probability of 0.001, revealed that of the total genetic diversity, 51% variance occurred within populations and 49% variance occurred among populations (Table 7).
Genetic distance (below diagonal) and genetic identity (above diagonal) indicesFootnote + for the five Cosmopolites sordidus (Germar) populations estimated using RAPDs

+ The highest and lowest genetic distances and identities are indicated in bold.
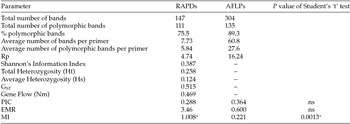
Comparison of different polymorphism and gene diversity indices of the RAPDs and AFLPs marker systems in the five populations of Cosmopolites sordidus (Germar)

*Significant; P = 0.001; ns = non-significant.
Hierarchical analysis of molecular variance (AMOVA) for the five populations of Cosmopolites sordidus (Germar)

PhiPT value = 0.493 (P = 0.001).
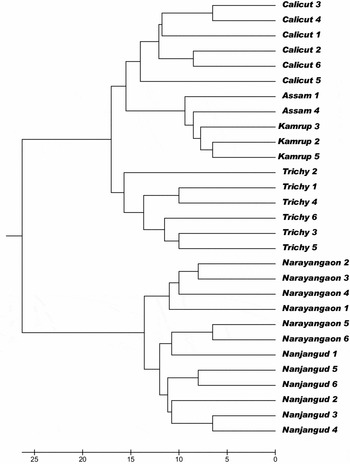
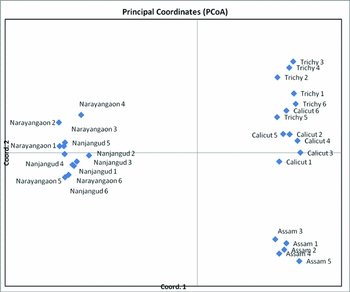
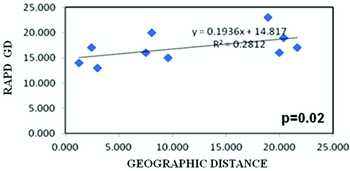
An UPGMA dendrogram generated based on the distance matrix expressed as similarity coefficients clustered all individuals into two major groups (Fig. 2). Within each group individuals from each location formed a sub-cluster. Group I had individuals from Calicut, Kamrup and Trichy, while group II clustered individuals from Nanjangud and Narayangaon. The UPGMA dendrograms did not reveal populations clustered solely based on geographic distance, i.e. populations that were situated close to each other geographically were not necessarily closely related genetically. For example, the populations of the Trichy and Calicut group were in the same cluster, which is to be expected as they are close to each other in geographical space. However, the Kamrup population is also included in this cluster. The PCA ordination based on the first two components (factors) confirmed cluster analysis with the Eigen values for first and second components being 33.79% and 9.68%, respectively. The first two components of PCA explained 36.23% of the total variation, and the first three components explained 10.38% of the total variation (Fig. 3). The Mantel test did not reveal a strong correlation (r = 0.53) between genetic distance and geographic distance (Fig. 4).
Dendrogram of 29 individuals of Cosmopolites sordidus (Germar) constructed from the genetic distance matrix estimated from the RAPD data and clustered using UPGMA.

Principal Component Analysis (PCA) of five populations of Cosmopolites sordidus (Germar) showing three distinct clusters.

Mantel test for correlation between genetic and geographical distance for the RAPDs data.

AFLP analysis
For the AFLP analysis, the DNA of 10 individuals from Kamrup and 20 individuals from each of the other populations were pooled separately, because pooled samples have been reported to give consistent results in AFLP analysis for detecting differences among populations, though variation among individuals would be sacrificed while pooling the DNA (Katiyar et al., Reference Katiyar, Chandel, Tan, Zhang, Huang, Nugaliyadde, Fernando, Bentur, Inthavong, Constantino and Bennett2000). Five AFLP primer combinations were used for studying the genetic diversity among the five populations (Table 3). A total of 304 bands representing 66 alleles were amplified by the five primer combinations in the five populations of which 135 (44.41%) were polymorphic. The maximum number of bands (69) was amplified in the Calicut population and the least number of bands (52) was amplified in the Nanjangud population. The size of the amplified bands varied from 60 to 427 bp. The resolving power (Rp) of the primer pairs screened ranged from 10 to 24 with a mean of 16.24. Pair-wise comparison of the populations showed that the genetic distances varied from 0.1374 between Calicut and Trichy to 0.2927 between Calicut and Kamrup (Table 8).
Pair-wise Nei's genetic identity (above diagonal) and genetic distance (below diagonal) between five populations of Cosmopolites sordidus (Germar) using AFLPs

+ The highest and lowest genetic distances and identities are indicated in bold.
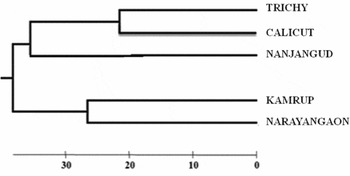
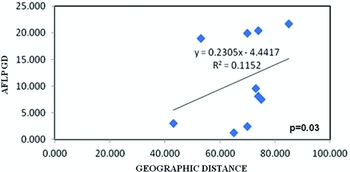
In the UPGMA dendrogram generated by AFLPs, the populations of Calicut, Trichy and Nanjangud formed a sub-cluster conforming to their geographical positions, but the populations of Kamrup and Narayangaon formed a sub-cluster though they are distantly located (Fig. 5). This observation was also confirmed by the Mantel test, which did not reveal strong correlation between genetic distance and geographic distance (r = 0.34) (Fig. 6).
Dendrogram of five Cosmopolites sordidus (Germar) populations constructed using the UPGMA method. The percentage of replicate trees in which the associated taxa clustered together in the bootstrap test (500 replicates) is shown next to the branches. The evolutionary distances are in the units of the number of base substitutions per site.

Mantel test for correlation between genetic and geographical distance for AFLPs.

One hundred and eleven (111) polymorphic bands were generated by RAPDs and 135 by AFLPs, satisfying the general recommendation of having at least 50 polymorphic bands for a precise estimation of genetic distances (Nei, Reference Nei1978). The different marker parameters derived using each of these marker systems are summarized in Table 6. Values of parameters such as average number of bands per primer, percentage of polymorphic bands, average number of polymorphic bands per primer, Rp, Hav and PIC were higher for AFLPs than for RAPDs, but estimates for the percentage of polymorphic bands, EMR and MI were higher for RAPDs than AFLPs. The MI value, which determines the utility of a marker system, was significantly higher for RAPDs than AFLPs (P = 0.001), as determined by the standard two-sample ‘t’ test, suggesting that RAPDs are more useful than AFLPs in revealing polymorphism in these populations. However, based on the level of polymorphism detected by AFLPs, which was higher than RAPDs, it can be concluded that both marker systems are useful in the genetic diversity analysis of this banana pest.
Discussion
RAPD and AFLP analyses of five Indian populations of C. sordidus has revealed that though there is restricted gene flow between them, these populations are not genetically distinct. This conclusion is supported by the sedentary nature of these weevils, which limits their dispersal capacity. Adult weevils have been observed not to disperse more than 50 m in three months (Gold et al., Reference Gold, Rukazambuga, Karamura, Nemeye, Night, Frison, Gold, Karamura and Sikora1999b ). Though the adult weevils have functional wings, their flight is uncommon and the weevils are relatively sedentary. It is a monophagous pest of bananas, i.e. it has a narrow host range and also has a low reproductive potential. These two factors limit its capacity to disperse. Hence, new infestations by this weevil mainly occur through transport or exchange of infested planting material (Gold et al., Reference Gold, Rukazambuga, Karamura, Nemeye, Night, Frison, Gold, Karamura and Sikora1999b ), which could have contributed to the range expansion of this pest, resulting in populations that are genetically related closely but geographically distinct. The UPGMA dendrogram derived from RAPDs clusters the individuals according to the sampling locations and AMOVA analysis shows that almost half of the observed genetic variation occurs within the populations. These results indicate that the banana corm weevil had formed localized populations, due to limited dispersal. Pest species can establish large local populations that maintain genetic variation for local adaptation, reflecting a successful ecological strategy.
The present strategies that are being followed for the control of banana corm weevil mainly include cultural practices and use of pesticides. Cultural practices, i.e. selection of clean planting material, systematic trapping of adult weevils with pseudostem traps and mulching, field sanitation, etc., require a high labour input and material requirements, which are not economical (Gold et al., Reference Gold, Pena and Karamura2001; Gold and Messiaen, Reference Gold and Messiaen2000). Biological control methods include use of biological control agents such as arthropods, entomopathogenic nematodes, fungi and organisms such as Beauveria bassiana, Steinerma and Heterorhabditis spp., are still in their preliminary stages (Pena et al., Reference Pena, Duncan, Martin, Gold and Gemmill1993; Godonou et al., Reference Godonou, Green, Oduro, Lomer and Afreh-Nuamah2000; Gold and Messiaen, Reference Gold and Messiaen2000). Moreover, their economic cost and efficacy limits their application for large-scale use. Hence, presently, organophosphorus insecticides, such as prothiofos, chlorpyrifos, pirimiphos-ethyl and ethoprophos, are being used to control weevil infestations. However, use of these insecticides has resulted in the emergence of insecticide-resistant weevil strains (Collins et al., Reference Collins, Treverrow and Lambkin1991; Gold et al., Reference Gold, Bagabe and Sendege1999a ). The potential of an insect pest depends upon its ability to invade, reproduce and establish itself in new habitats. Hence, knowledge about gene flow and dispersal in insect pests is instrumental to understanding the factors that enable or prevent local adaptation, the evolution of insecticide resistance and prevention of its spread. Reliable information on gene flow, i.e. pest dispersal and movement and its relationship to pest management practices, environmental factors and ecosystem is important, as it can aid in predicting pest infestations (Loxdale et al., Reference Loxdale, Hardie, Halbert, Foottit, Kidd and Carter1993; Aylor and Irwin, Reference Aylor and Irwin1999; Byrne, Reference Byrne1999). This information is important to understand the occurrence of resistance and prevention of its spread, to assess the spatial scale at which the management practices should be implemented and how fast the resistance to a given control method could evolve and how broadly, in a geographical sense, a control method should be applied (Roush and Daly, Reference Roush, Daly, Roush and Tabashnik1990; Nahrung and Allen, Reference Nahrung and Allen2003; Labbe et al., Reference Labbe, Lenormand and Raymond2005). It is important to minimize selection pressure to keep susceptible insects alive, which can be possible by use of appropriate dosages of insecticide, stringent use of control thresholds and insecticides with different modes of action in rotation. As RAPDs and AFLPs have been shown to be useful in studying the genetic diversity in C. sordidus, they can be used to monitor population structure reflecting local adaptation. Dispersal by insects is also important for IPM, especially when they carry genes for resistance to insecticides. Markers specific for susceptible and resistant insects can be identified, which would help in timely monitoring of the populations (Behura, Reference Behura2006).
Conclusion
RAPDs and AFLPs are useful marker systems to study genetic variation in Indian populations of C. sordidus (Germar), as they reveal sufficient polymorphisms. Though the four populations from central and south India and the population from Kamrup, Assam, are geographically distinct, they are genetically closely related to each other, suggesting that the dispersal of this banana pest in India has taken place by exchange and transport of planting material. Limited dispersal has resulted in the pest forming localized populations with a high level of within-population variation, thereby revealing an ecological strategy for adaptation to the local environment. These results provide important information that could be used to design suitable strategies for the control of spread of this pest and in the management of resistance to organophosphorus insecticides.
Acknowledgements
The authors thank the Department of Science and Technology, New Delhi, India, for a research grant to carry out this work. They also thank Mr Alagesan and Mr Marimuthu from the National Research Centre for Bananas, Trichy, India, for their help in the collection of weevils.