INTRODUCTION
Wedge clams of the genus Donax are an important component of the shallow-bottom macrofauna of exposed sandy beaches (Ansell, Reference Ansell, McLachlan and Erasmus1983) and are typical inhabitants of sandy and muddy beaches in both tropical and temperate zones. Of the several species of the wedge clam of the family Donacidae that occur on the west and east coasts of India in the surf-beaten sands, these clams are valued as food by local people. In Karnataka coast, Donax species are also used as food and bait by fishermen and others (Singh et al., Reference Singh, Krishnamoorthy and Thippeswamy2011, Reference Singh, Krishnamoorthy and Thippeswamy2012a, Reference Singh, Krishnamoorthy and Thippeswamyb, Reference Singh, Krishnamoorthy and Thippeswamyc). Allometry is the study of the relationship between two measurable variables, or in general, the study of size and its consequences (Reiss, Reference Reiss1989). The most reliable and widely used method of studying changes of growth pattern in bivalves is based on allometry. Growth is a three-dimensional process with all dimensions changing over time. Huxley & Tessier (Reference Huxley and Tessier1936) proposed the concept of allometry and they recognized the allometric principles of animal morphology. Growth rate in molluscs varies not only from place to place, but also within the same locality. According to Gould (Reference Gould1966), knowledge of allometry of soft body and shell characters is essential to fully understand the growth of a species. Biometrics in the length-breadth relationship showing no significant difference in different months would indicate that these parameters have a constant relative proportion of growth. In this case, the general form of the body is more or less the same throughout its life from the time of settling. These parameters are unaffected by the ecological and physiological parameters. Although it is observed that animals from colder environments grow slower, attain a larger size and live longer than their more warm-adapted conspecifics, the interpretation of data on growth and longevity of aquatic ectotherms in latitudinal gradients is controversial. Some species tend to increase longevity and maximal attainable size with increasing latitude (e.g. Placopecten magellanicus, MacDonald & Thompson, Reference MacDonald and Thompson1988), whereas others show the opposite pattern (e.g. Modiolus kurilensis, Selin et al., Reference Selin, Yu and Buyanovskij1991).
Donax scortum is one of the largest-sized wedge clams in the genus Donax, and its distribution extends along the coastal areas of India. Harvesting bivalve molluscs is an ancient traditional activity along both the southern coasts of India. Clams are the most important bivalve resources in India. The clam fishery in India is localized and at sustenance level. Allometric relationships of bivalves have received considerable attention in view of their applications, particularly in the commercial exploitation of the species in India. Although the allometric relationships of donacids along the Indian coast have been investigated (Nayar, Reference Nayar1955; Alagarswami, Reference Alagarswami1966; Ansell et al., Reference Ansell, Sivadas, Narayanan and Trevallion1972; Talikhedkar et al., Reference Talikhedkar, Mane and Nagabhushanam1976; Mohan et al., Reference Mohan, Damodaran and Salih1986), no studies on D. scortum have been undertaken from the Indian coast. The distribution of the wedge clam, D. scortum along the south-west coast of India is restricted to sandy beaches. Though some studies concerning several aspects of bivalve populations from Karnataka coast are available, the information on the morphometric relationship, length-weight relationship and condition index of wedge clam is not available except for D. incarnatus (Thippeswamy & Joseph, Reference Thippeswamy and Joseph1992) in Karnataka. Variation in growth rate of D. incarnatus and D. spiculum growing at two different stations along Kerala coast (south-west coast of India) was reported by Ansell et al. (Reference Ansell, Sivadas, Narayanan and Trevallion1972). The allometric relationship is different for the various size groups of animals in some bivalve species (Shafee, Reference Shafee1977; Jayabal & Kalyani, Reference Jayabal and Kalyani1989), whereas in some other bivalves the fitted regression line is the same for the entire size range of animals (Nayar, Reference Nayar1955; Durve & Dharmaraja, Reference Durve and Dharmaraja1965; Talikhedkar et al., Reference Talikhedkar, Mane and Nagabhushanam1976). The morphometric analyses and length-weight relationships of Donax species have been reported from various parts of the world (Donn, Reference Donn1990; Soares et al., Reference Soares, Callahan and De Ruyck1998; Gaspar et al., Reference Gaspar, Snatos, Vasconcelos and Chicharo2001, Reference Gaspar, Chicharo, Vasconcelos, Garcia, Snatos and Monteiro2002a; Herrmann et al., Reference Herrmann, Carstensen, Fischer, Laudien, Penchaszadeh and Arntz2009). Such information would allow for comparison between populations of the same species of genus Donax from different geographic areas, and could also be used in fishery.
In bivalve molluscs, relatively large variations in meat content occur depending upon their physiological condition and variations in environmental parameters. In most bivalves, gonad development and growth prior to onset of spawning result in fattening and increase meat yield. Since such variations in meat yield are of importance at the time of harvesting and utilization of commercial species of bivalves, a study on the meat content and its temporal variations forms an important aspect of wedge clam biology (Boussoufa et al., Reference Boussoufa, Ghazali, Viciano, Navarro and El Cafsi2011). From Indian waters, seasonal cycles in condition index are reported for the wedge clams, viz. Donax incarnatus (Ansell et al., Reference Ansell, Sivadas, Narayanan and Trevallion1972; Thippeswamy & Joseph, Reference Thippeswamy and Joseph1988), D. faba (Alagarswami, Reference Alagarswami1966) and D. cuneatus (Nayar, Reference Nayar1955); and other bivalves such as Crassostrea gryphoides (Durve, Reference Durve1964), Meretrix meretrix (Narasimham et al., Reference Narasimham, Muthiah, Sundararajan and Vaithinathan1988), Paphia laterisulca (Nagabhushanam & Dhamne, Reference Nagabhushanam and Dhamne1977), Katelysia opima (Mane, Reference Mane1974), Villorita cyprinoides (Reddy, Reference Reddy1983), Perna viridis (Hemachandra & Thippeswamy, Reference Hemachandra and Thippeswamy2008; Sushant & Sujit, Reference Sushant and Sujit2014).
The present study was undertaken to investigate the environmental factors in association with biotic parameters of D. scortum, morphometric relationship (length-breadth and length-width), length-weight relationship (length-total weight, length-meat weight, length-dry meat weight and length-shell weight) and condition index from Padukere beach along Karnataka coast (India).
MATERIALS AND METHODS
Study area
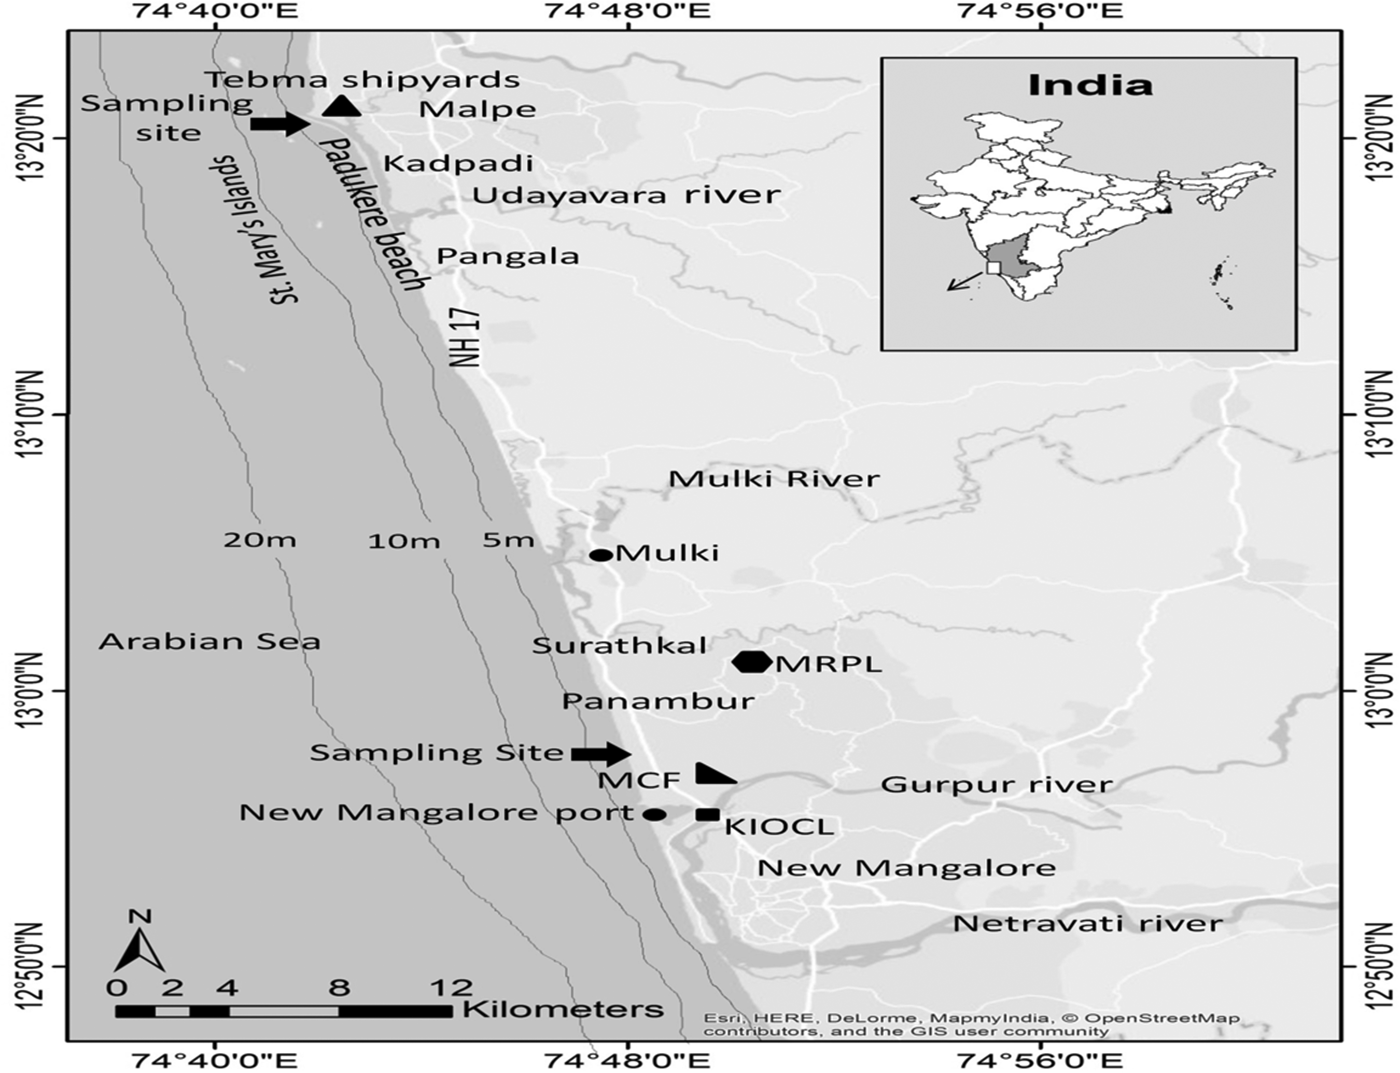
Karnataka state consists of three coastal districts, namely Dakshina Kannada, Udupi and Uttara Kannada. The coastal area, which has 14 perennial rivers, is increasingly subjected to urban development stress. This tropical region is characterized by distinct seasonality, namely pre-monsoon (February–May), south-west monsoon (June–September) and post-monsoon (October–January). At Padukere (Udupi district), the shore consists of fine sand which is so compact that footprints made by a person of average stature are scarcely visible. Near to this area, there is a group of four small islands collectively known as St Mary's Island spread over a distance of 4 km from north to south parallel to the mainland of Udupi (Figure 1). Padukere beach is located near the mouth of the Udayawara River in Udupi district. Tebma Shipyards Ltd (a shipbuilding company) is close to this sampling site.
Location of study site in Padukere Beach, Karnataka, south-west coast of India.

Sample collection
Air, water and sediment temperatures were recorded using a simple thermometer at the study area (13°20′51.80″N 74°41′30.92″E) (Figure 1). The water sample was analysed for dissolved oxygen, phosphate and silicate using the method of Strickland & Parsons (Reference Strickland and Parsons1972). For estimation of dissolved oxygen, the seawater sample near the sampling site was collected and fixed immediately in the field with Winkler's reagents. Then the dissolved oxygen content was estimated in the laboratory. Salinity, pH and electrical conductivity were estimated using a Systronics Water Analyser 371 kit. Data on rainfall during the study period were obtained from the Agricultural Research Station, Government of Karnataka, Brahmavar, Udupi. The wedge clam live specimens (Donax scortum) were collected at monthly intervals from February 2009 to January 2010 from Padukere sandy beach. This species lie buried in the sand in the surf zone. The majority of the population of D. scortum was found along the mid intertidal zone. This species is more abundant on the flatter portions of the beach where the wave wash is more uniform, thus providing better conditions for filter-feeding.
Grain size analysis and estimation of organic carbon
For the textural analysis of sediment, the coned and quartered sand samples were washed to remove salts, treated with hydrochloric acid to remove the shell fragments and rinsed with distilled water to free the sediment from traces of acid and dried in an oven. The sand samples were then subjected to granulometric analysis following a conventional sieving procedure (Wentworth, Reference Wentworth1922). The organic carbon content was determined by the method of Gaudette et al. (Reference Gaudette, Flight, Toner and Folger1974).
Measurement of specimens and processing
A total of 2367 Donax scortum specimens were collected and brought to the laboratory. The clams were subjected to morphometric measurements. Shell length (maximum anterio-posterior distance), breadth or height (maximum distance from hinge to ventral margin) and width or depth or thickness (maximum distance between outer edges of two valves) of individual organisms were measured to the accuracy of 0.01 mm using Vernier calipers (FAO, 1998). The total weights of individual clams were weighed in an electronic balance. The clam shells were then opened, the meats were separated, blotted and weighed individually. The individual weights of shells were also measured. The meat samples were dried at constant temperature of 60°C for 2 days and reweighed in the electronic balance with a sensitivity of 0.001 g to measure dry meat weight.
Condition index
Xylene was used to determine the cavity volume of individual clams in order to avoid errors resulting from surface tension. Condition index was determined by the following method of Baird (Reference Baird1958):
 $$\eqalign{\hbox{Condition index (CI)} & = \hbox{Dry meat weight} \cr & \qquad \times 100/\hbox{Shell cavity volume}}$$
Statistical analysis
Allometry in the morphometric analysis (length-breadth and length-width) was calculated using the linear equation, Y = a + bX, where a (intercept) and b (slope), and for the length-weight relationship (length-total weight, length-wet meat weight, length-dry meat weight and length-shell weight), parabolic equation, W = aLb was used; here, a and b are constants (Pauly, Reference Pauly1983). The data on environmental parameters (air temperature, water temperature, sediment temperature, dissolved oxygen, salinity, pH, electrical conductivity, phosphate, silicate, rainfall, sand texture and organic carbon) and biological parameters (length, breadth, width, total weight, wet meat weight, dry meat weight, shell weight, condition index) were subjected to Pearson correlation to understand the relationship between abiotic and biotic parameters. The computing was carried out using the Statistical Package for Social Sciences (SPSS) version 16.0. Principal component analysis (PCA) was performed for biological parameters to understand the relationship whithin biotic parameters (the above biotic variables mentioned and sample size, b values of length-breadth, length-width, length-total weight, length-wet meat weight, length-dry meat weight and length-shell weight relationships), i.e. to establish the most representative variables of the biological variability (Lewis-Bek, Reference Lewis-Bek1994).
RESULTS
Environmental parameters in clam bed of Padukere
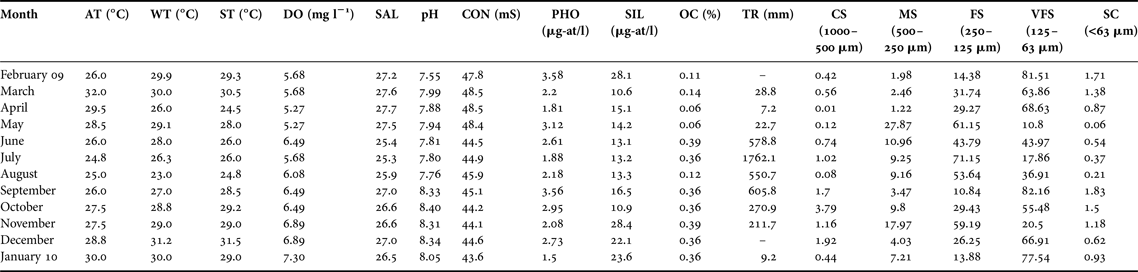
The monthly variations in air, water and sediment temperatures are shown in Table 1. The lowest (24.8°C) and highest (32.0°C) air temperatures were recorded from Padukere beach in July and March respectively. The difference between the highest and the lowest annual temperatures was 7.2°C suggesting that air temperatures differ significantly due to difference in annual rainfall at the sampling site. However, the mean annual air temperature was 27.6°C during the period of study. The water temperature ranged from 23.0°C (August) to 31.2°C (December), whereas the sediment temperature ranged from 24.5°C (April) to 31.5°C (December). The average values of water and sediment temperatures were 28.2°C and 28.0°C respectively. The seasonal change in water temperature is similar to that of sediment temperature.
Distribution of environmental parameters in Padukere beach.

AT, Air temperature; WT, Water temperature; ST, Sediment temperature; DO, Dissolved oxygen; SAL, Salinity; CON, Conductivity; PHO, Phosphate; SIL, Silicate; OC, Organic carbon; TR, Total rainfall; CS, Coarse sand; MS, Medium sand; FS, Fine sand; VFS, Very fine sand; SC, Slit and Clay.
Monthly rainfall data recorded near the sampling site are also presented in Table 1. The average value of rainfall was 404.8 mm during the study period. The monthly rainfall varied from 7.2 (April) to 1762.1 mm (July). There was no rainfall in February and December. At Padukere, salinity fell from May reaching the lowest value in July (25.3). The highest salinity value (27.7) was recorded in April. The average value was 26.7. The value of dissolved oxygen ranged from 5.27 mgl−1 (April and May) to 7.30 mg l−1 (January) and the mean annual dissolved oxygen was 6.18 mg l−1. The pH of water ranged from 7.55 (February) to 8.40 (October). The mean value of pH was 8.01. In the case of electrical conductivity, the minimum and maximum values were 43.6 mS (January) and 48.5 mS (March and April) observed during the post and pre monsoon seasons respectively. In monsoon season, the electrical conductivity decreased and the minimum value (44.5 mS) was observed in September. The average value of electrical conductivity was 45.8 mS during the study period.
The phosphate concentration was highest (3.58 µg-at/l) in February and lowest in January (1.5 µg-at/l). The mean value of phosphate was 2.52 µg-at/l. The silicate content of seawater fluctuated between 10.6 (March) and 28.4 µg-at/l (November). The mean value was 17.42 µg-at/l. Silicate content of seawater was low from March to October with minor variations.
Sand texture and organic carbon in clam bed of Padukere
The variations in the percentage composition of different sediment fractions at Padukere are shown in Table 1. Very fine sand (10.80% in September to 82.16% in May) dominated throughout the period of study followed by fine sand (10.84% in September to 71.15% in July). The coarse (0.01% in April to 3.79% in October) and medium (1.22% in April to 27.87% in May) sands showed variations in abundance during the study period. The silt-clay was less than 2.00% and varied from 0.06% (May) to 1.83% (September). At the sampling site, the organic carbon (OC) content varied from 0.06% (April and May) to 0.39% (June and November). The average value of OC for the entire period was 0.26%.
Morphometric analysis of Donax scortum
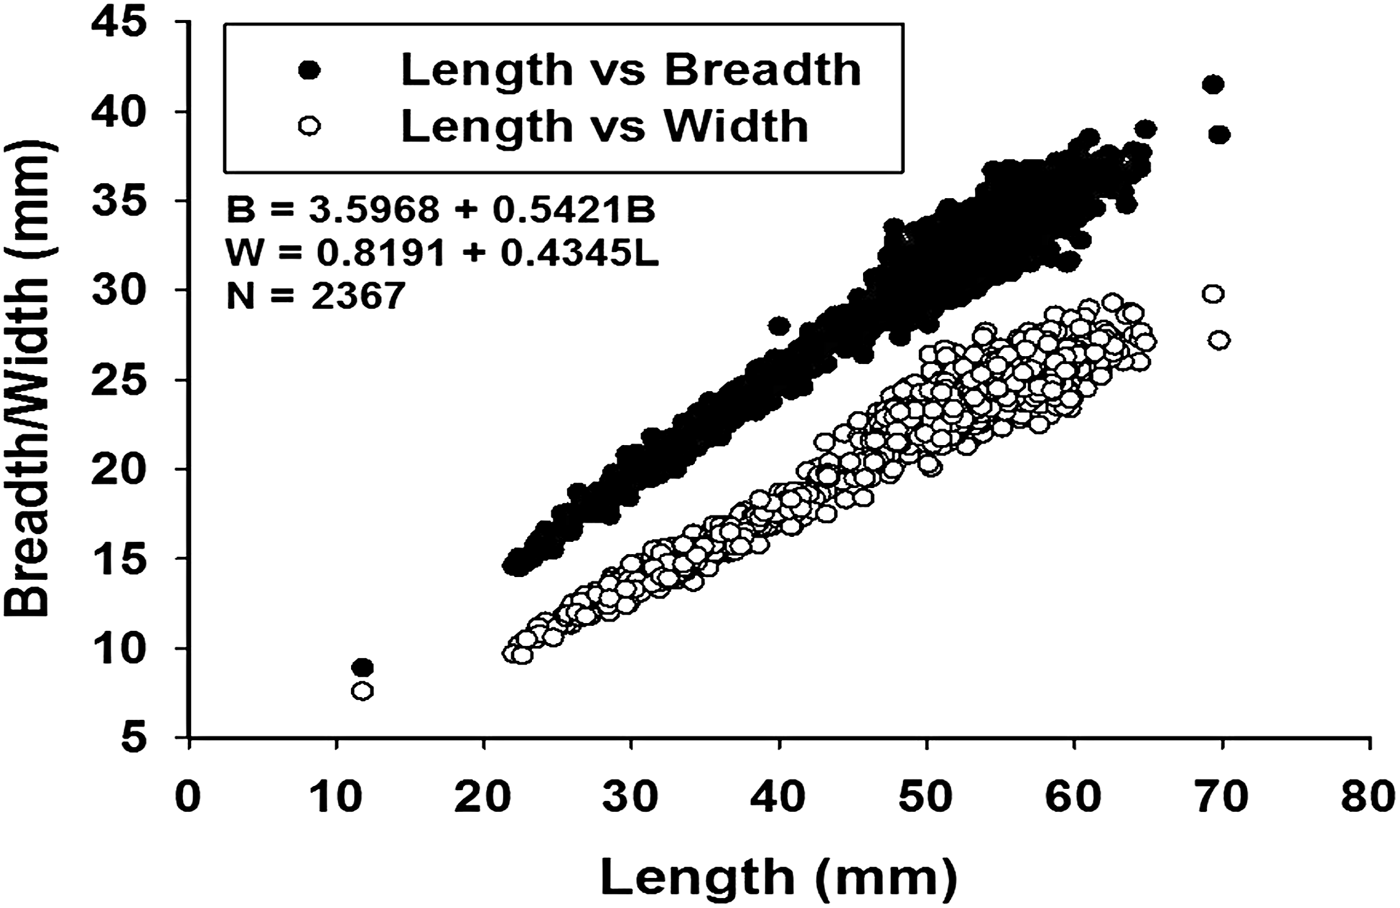
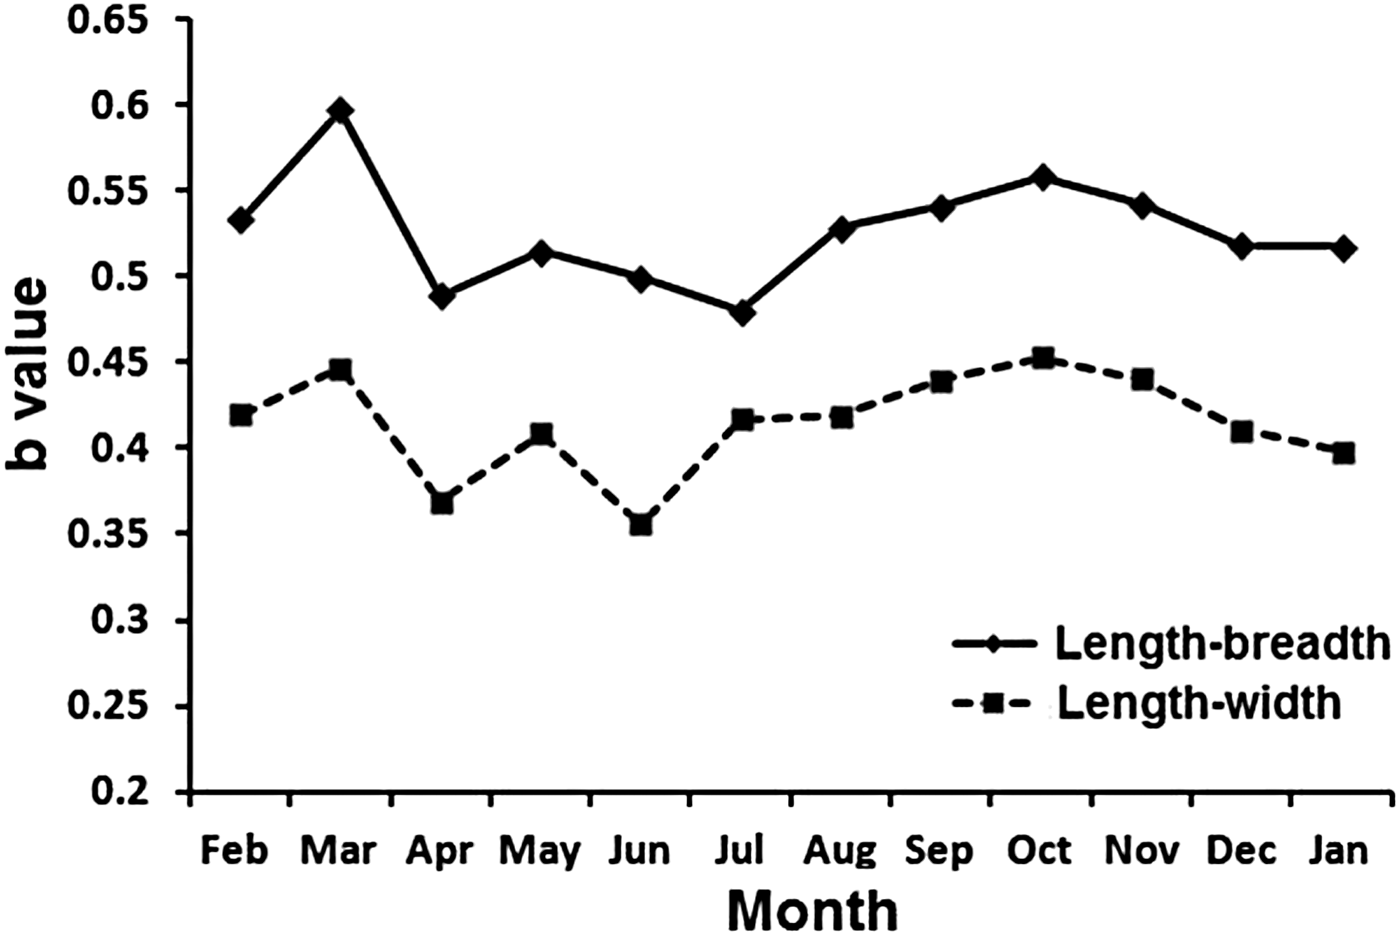
The length-breadth and length-width relationships of Donax scortum are presented in Figure 2. The data revealed that the calculated values presented a best fit to the actual observed measurements of thickness and breadth. The relationships was linearly related and showed that longer individuals were wider and thicker. Likewise, shorter individuals were narrower and less thick. The calculated linear equation of length-breadth and length-width relationships were B = 3.5968 + 0.5421L and W = 0.8191 + 0.4345L respectively. Fluctuation of the b values is shown in Figure 3. The monthly b values of the length-breadth relationship ranged from 0.4798 (July) to 0.5968 (March), whereas the b values for the length-width relationship varied from 0.3560 (June) to 0.4528 (October) (Table 3). The ratio of morphometric measurements of length, breadth and width was 4.8:3.0:2.2.
Bivariate scatter diagram of length-breadth (dark circles) and length-width (open circles) relationships of Donax scortum.

Monthly variability in the b values of length-breadth and length-width relationships of Donax scortum.

Allometric length-weight relationship of Donax scortum
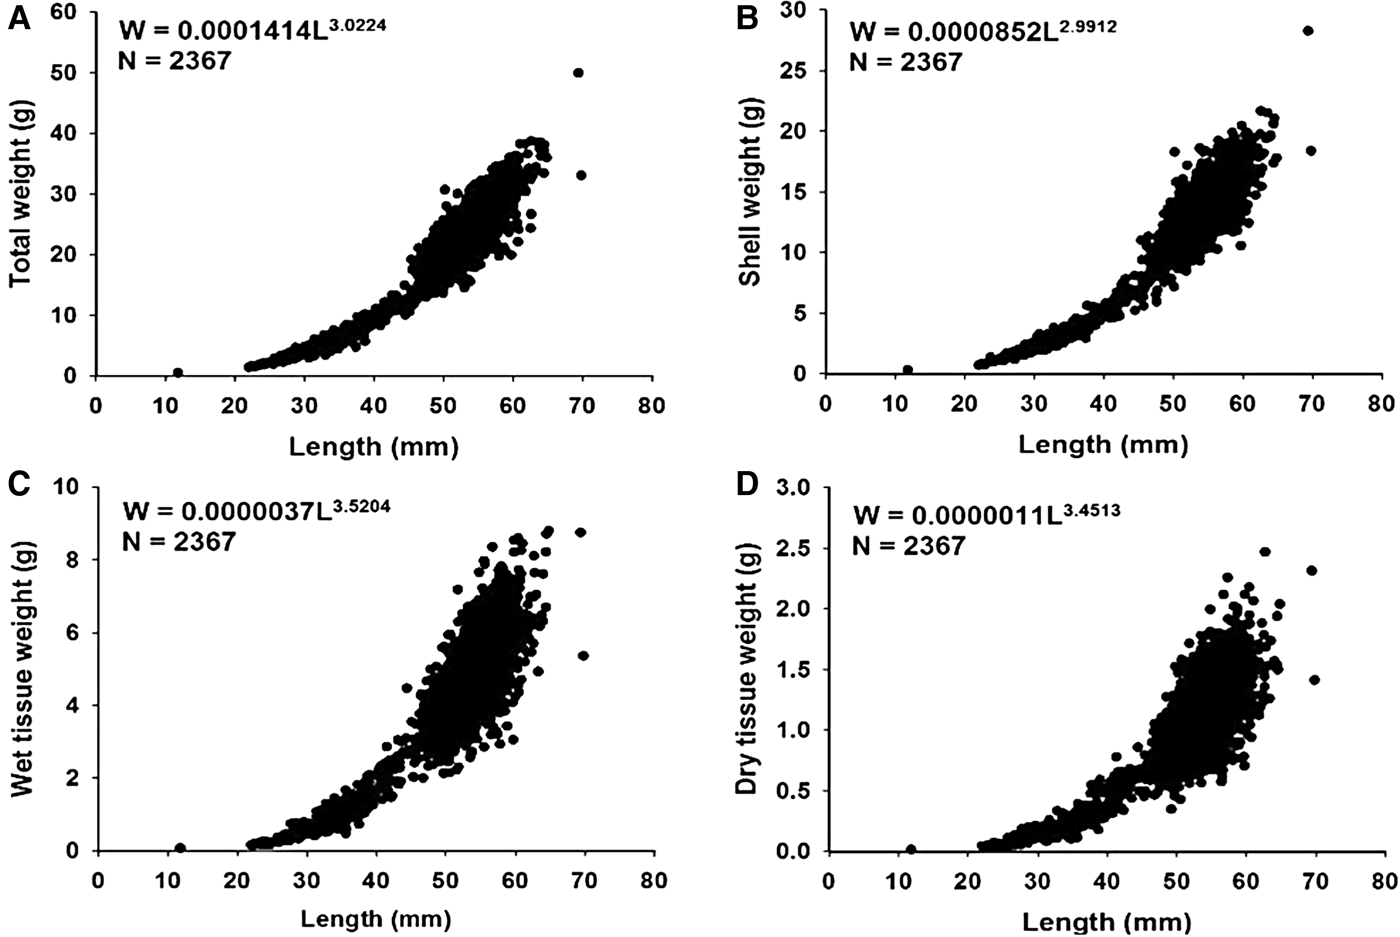
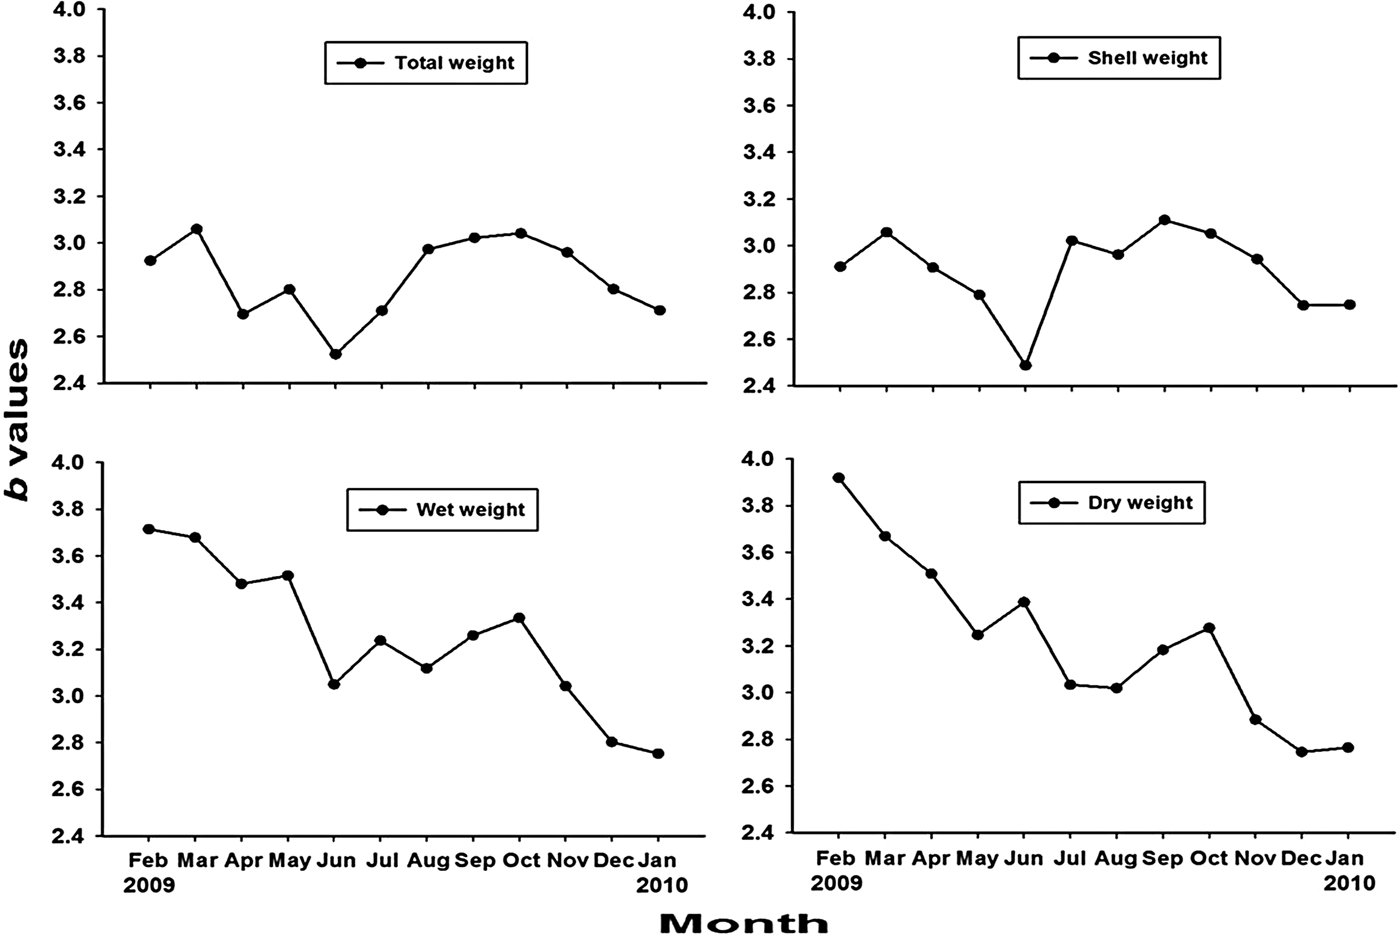
The length-weight relationship of wedge clam is presented in Figure 4 and the relationship was a non-linear pattern. The length-total weight, length-wet meat weight, length-dry meat weight and length-shell weight relationships were 0.0001414L3.0224, W = 0.0000037L3.5204, W = 0.0000011L3.4513 and 0.0000852L2.9912 respectively. The data on monthly b values of length-weight relationships are shown in Figure 5. The b values ranged from 2.5237 (June) to 3.0596 (March) for the length-total weight relationship, whereas the values varied between 2.4876 (June) and 3.1100 (September) for the length-shell weight relationship. The numerical values of total weights of clams obtained are affected slightly by the residual water retained within the shells. For the length-wet meat weight relationship, the b values fluctuated between 2.7529 (January) and 3.7142 (February). In the case of the length-dry meat weight relationship, the b values ranged from 2.7459 (December) to 3.9200 (February). The ratio of total weight, shell weight, wet meat weight and dry meat weight of Donax scortum was 5.6:3.0:1.1:0.3.
Non-linear length-weight relationship of Donax scortum. (A) Length-total weight; (B) Length-shell weight; (C) Length-wet meat weight; (D) Length-dry meat weight relationships.

Monthly variability in b values of length-total weight, length-wet meat weight, length-shell weight and length-dry meat weight relationships in Donax scortum.

Condition index
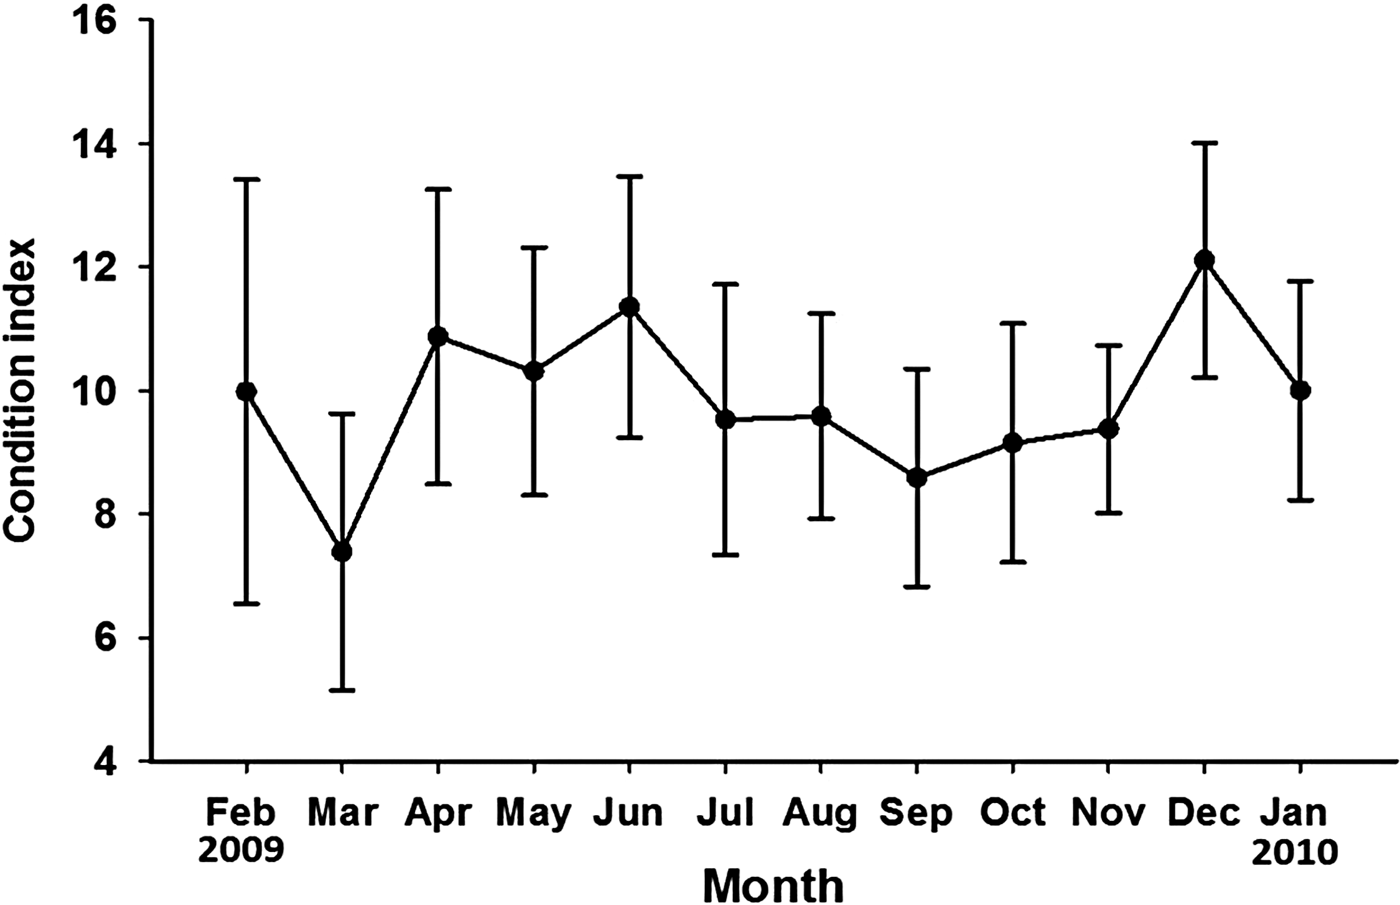
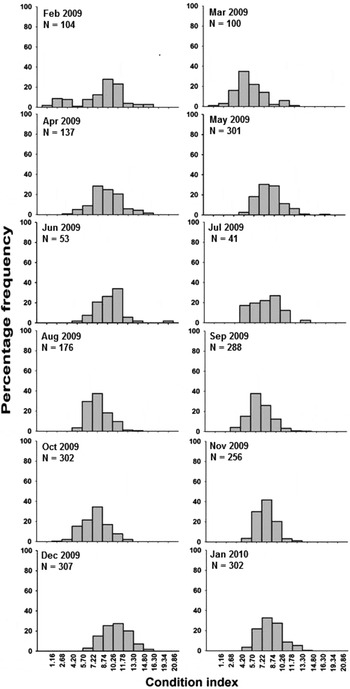
Monthly mean variability of condition index of Donax scortum is presented in Figure 6. The values ranged from 7.39 (March) to 12.11 (December). Primary and secondary peaks were observed in the monsoon season (June) and the post-monsoon (December) in the present study. Figure 7 shows the percentage distribution of condition index in each month and revealed that no tertiary modes of percentage of condition index were seen in all the months, whereas secondary peaks occurred in February and June. It is evident that the mode at class interval 10.26–11.78 in February shifted back to class interval 5.70–7.22 in March. From April, the mode increased gradually up to June at class group 11.78–13.30 and decreased uniformly from July up to September. Thereafter, the mode increased to class interval of 8.74–10.26 in October. In October–November, the modes belonged to the same class group. From this class group onwards, the mode percentage value of condition index shifted to 11.78–13.30 class intervals in December. Then, the later mode shifted back to class group 8.74–10.26 in January finally. The maximum (19.34–20.86) condition index was represented by only one largest-sized individual in June.
Monthly variation in mean condition indices in Donax scortum in Padukere beach. Vertical bars represent the standard deviation.

Temporal variations in condition indices in Donax scortum.

Pearson correlation and principal component analysis
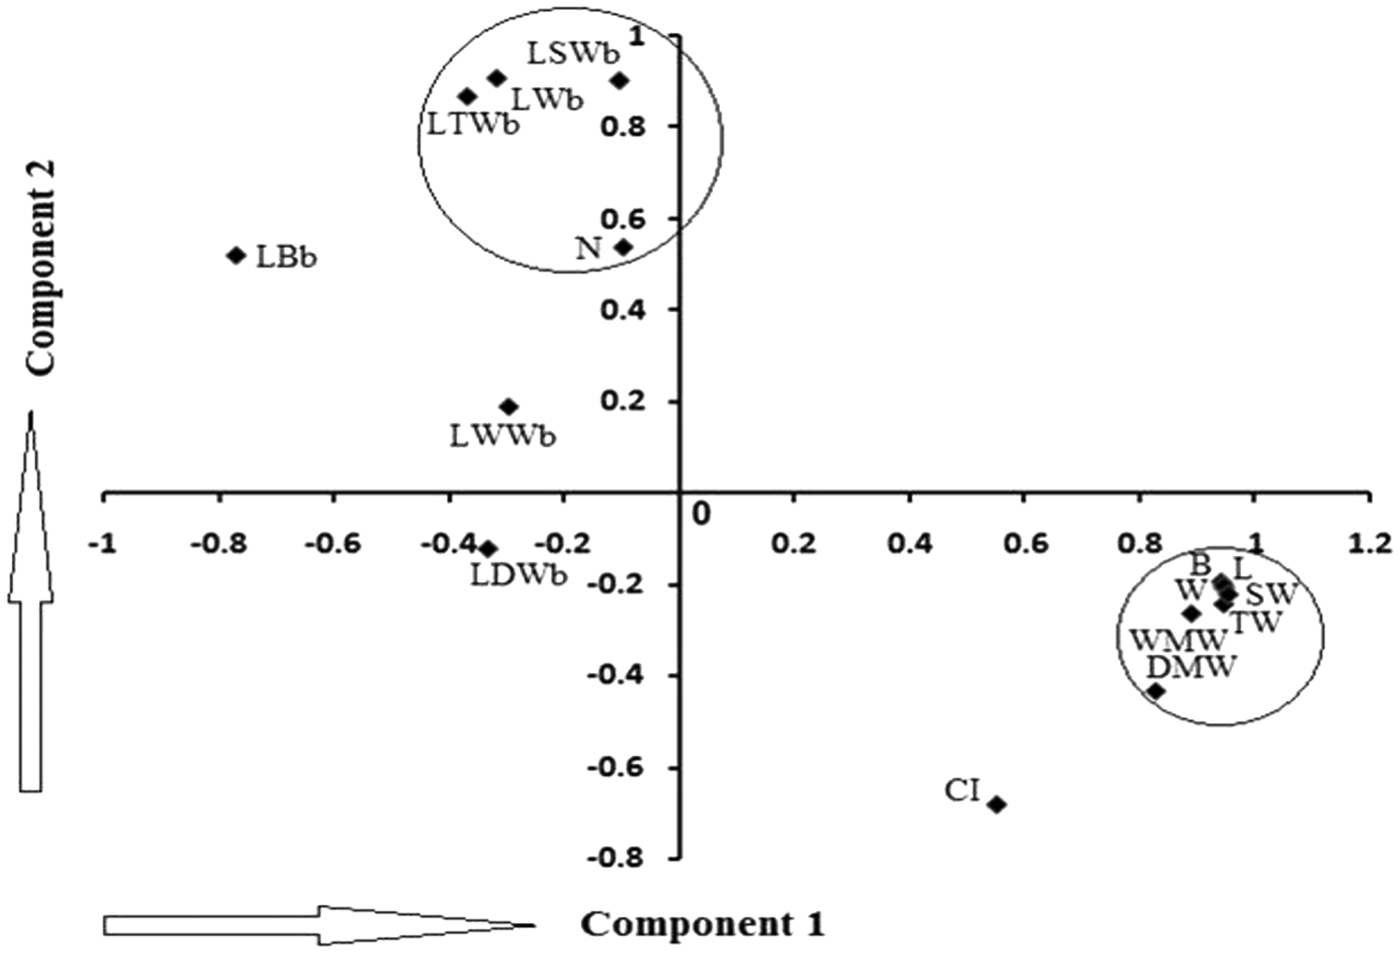
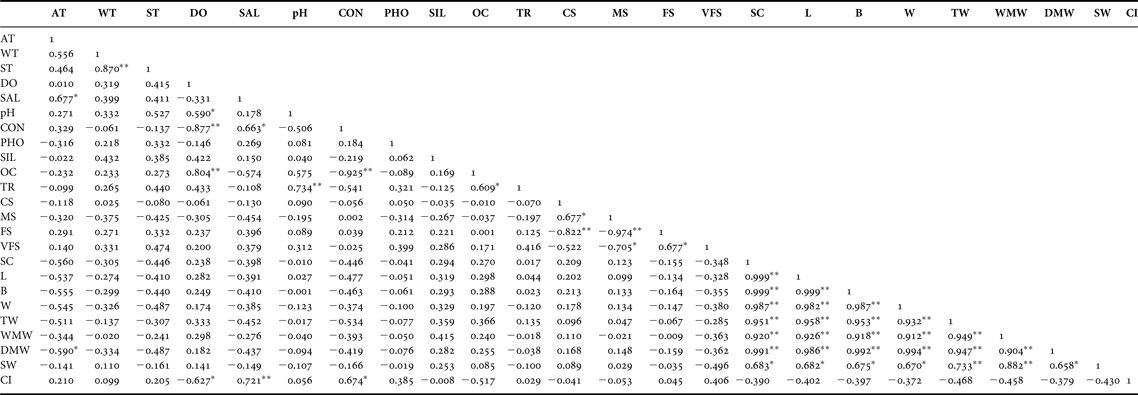
Pearson correlation was conducted between the environmental and biological parameters and revealed the possible correlations among the measured variables (Table 2). Principal component analysis (PCA) was performed for biological parameters to understand the relationship within biotic parameters. The eigenvalues and their contribution to the total variance indicated a small number of components (3) that could adequately explain the observed correlations among the large number of observed variables (15). A total of three components showed more than one eigenvalue. The plots of principal component axis 1 and axis 2 showed two major different groupings of biological parameters (Figure 8).
Principal component plots of Component 1 and Component 2 of biological variables of Donax scortum. L, Length; B, Breadth; W, Width; TW, Total weight; WMW, Wet meat weight; DMW, Dry meat weight; SW, Shell weight; CI, Condition index, LBb, length-breadth b value; LWb, length-width b value; LTWb, length-total weight b value; LWWb, length-wet weight b value; LDWb, length-dry weight b value; LSWb, length-shell weight b value; N, sample size.

Distribution of environmental parameters in Padukere beach.
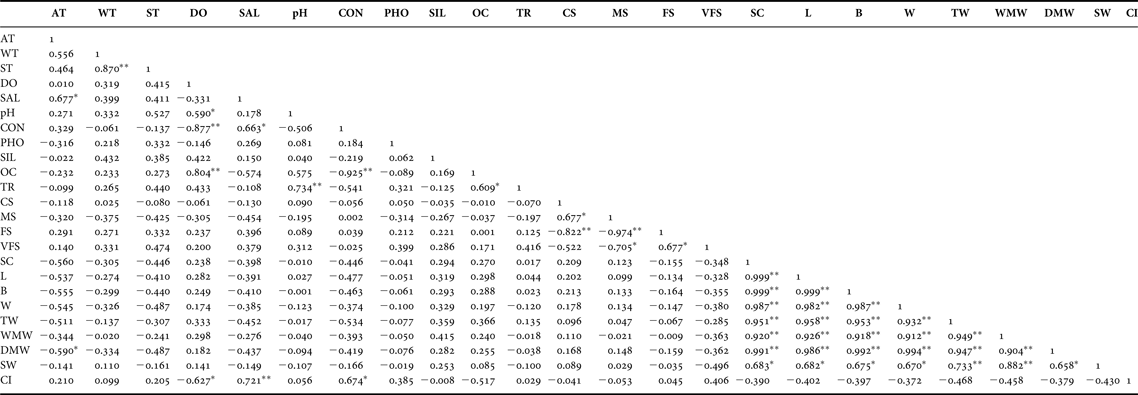
AT, Air temperature; WT, Water temperature; ST, Sediment temperature; DO. Dissolved oxygen; SAL, Salinity; CON, Conductivity; PHO, Phosphate; SIL, Silicate; OC, Organic carbon; TR, Total rainfall; CS, Coarse sand; MS, Medium sand; FS, Fine sand; VFS, Very fine sand; SC, Silt and Clay, L, Length; B, Breadth; W, Width; TW, Total weight; WMW, Wet meat weight; DMW, Dry meat weight; SW, Shell weight; CI, Condition index.
*Correlation is significant at the 0.05 level.
**Correlation is significant at the 0.01 level.
DISCUSSION
Size of shell is more affected than shape by fluctuation of the ambient environment (Wilbur & Owen, Reference Wilbur, Owen, Wilbur and Yonge1964; Seed, Reference Seed1968). From Table 2, ST is strongly correlated with WT when SAL is correlated with AT. pH is positively correlated with DO. A similar result was obtained by Krishnakumar & Bhat (Reference Krishnakumar and Bhat2008) from the coastal waters of Karnataka. CON is strongly negatively correlated with DO, but it is positively correlated with SAL. There is a strong positive correlation between OC and DO when there is a strong negative correlation between OC and CON. In general, TR is strongly positively correlated with pH. In opposite, TR is strongly negatively correlated with pH according to Krishnakumar & Bhat (Reference Krishnakumar and Bhat2008). It is observed that TR is correlated with OC. Nutrients (phosphate and silicate), CS and SC do not show any valid relationship with other variables. In the findings of Shirodkar et al. (Reference Shirodkar, Mesquita, Pradhan, Verlekar, Babu and Vethamony2009), phosphate and silicate correlated significantly with each other suggesting a common source along Karnataka coast. It is due to discharge from the industrial area. MS shows positive significant correlation with CS. FS is strongly negatively correlated with CS and MS to indicate a common source. When VFS shows negative correlation with MS VFS is strongly positively correlated with FS. L shows a strong correlation with SC, B, W, TW, WTW and DMW. DMW is negatively correlated with AT, but it is strongly correlated with SC, L, B, W, TW and WMW. SW shows positive correlation with biotic parameters, L, B, W and DMW, and abiotic parameter, SC. However, it shows a strong positive correlation with TW and WMW. CI is positively correlated with CON, whereas it is negatively correlated with DO. On the other hand, it shows a strong correlation with SAL.
In molluscs, as in other animals, the growth rate of the various parts of the body may not be uniform, with the result that the relative proportions of different parts of the body change, with increase in size. The size relation between two parts of the growing animal can be described by the general equation Y = bX∝ where Y is some measure of a part, X is a measure of another part, and b and ∝ are constants (Wilbur & Owen, Reference Wilbur, Owen, Wilbur and Yonge1964). If the equilibrium constant ∝ has a value other than 1, the relation between the two parts could be considered allometric. During the early period, the alternation in the growth pattern occurred at different stages of growth and was well illustrated by the change in ratio of shell dimensions in the clam Mya arenaria (Swan, Reference Swan1952), Tapes japonica (Ohba, Reference Ohba1959), Meretrix meretrix (Hamai, Reference Hamai1937) and Cardium edule (Kristensen, Reference Kristensen1957).
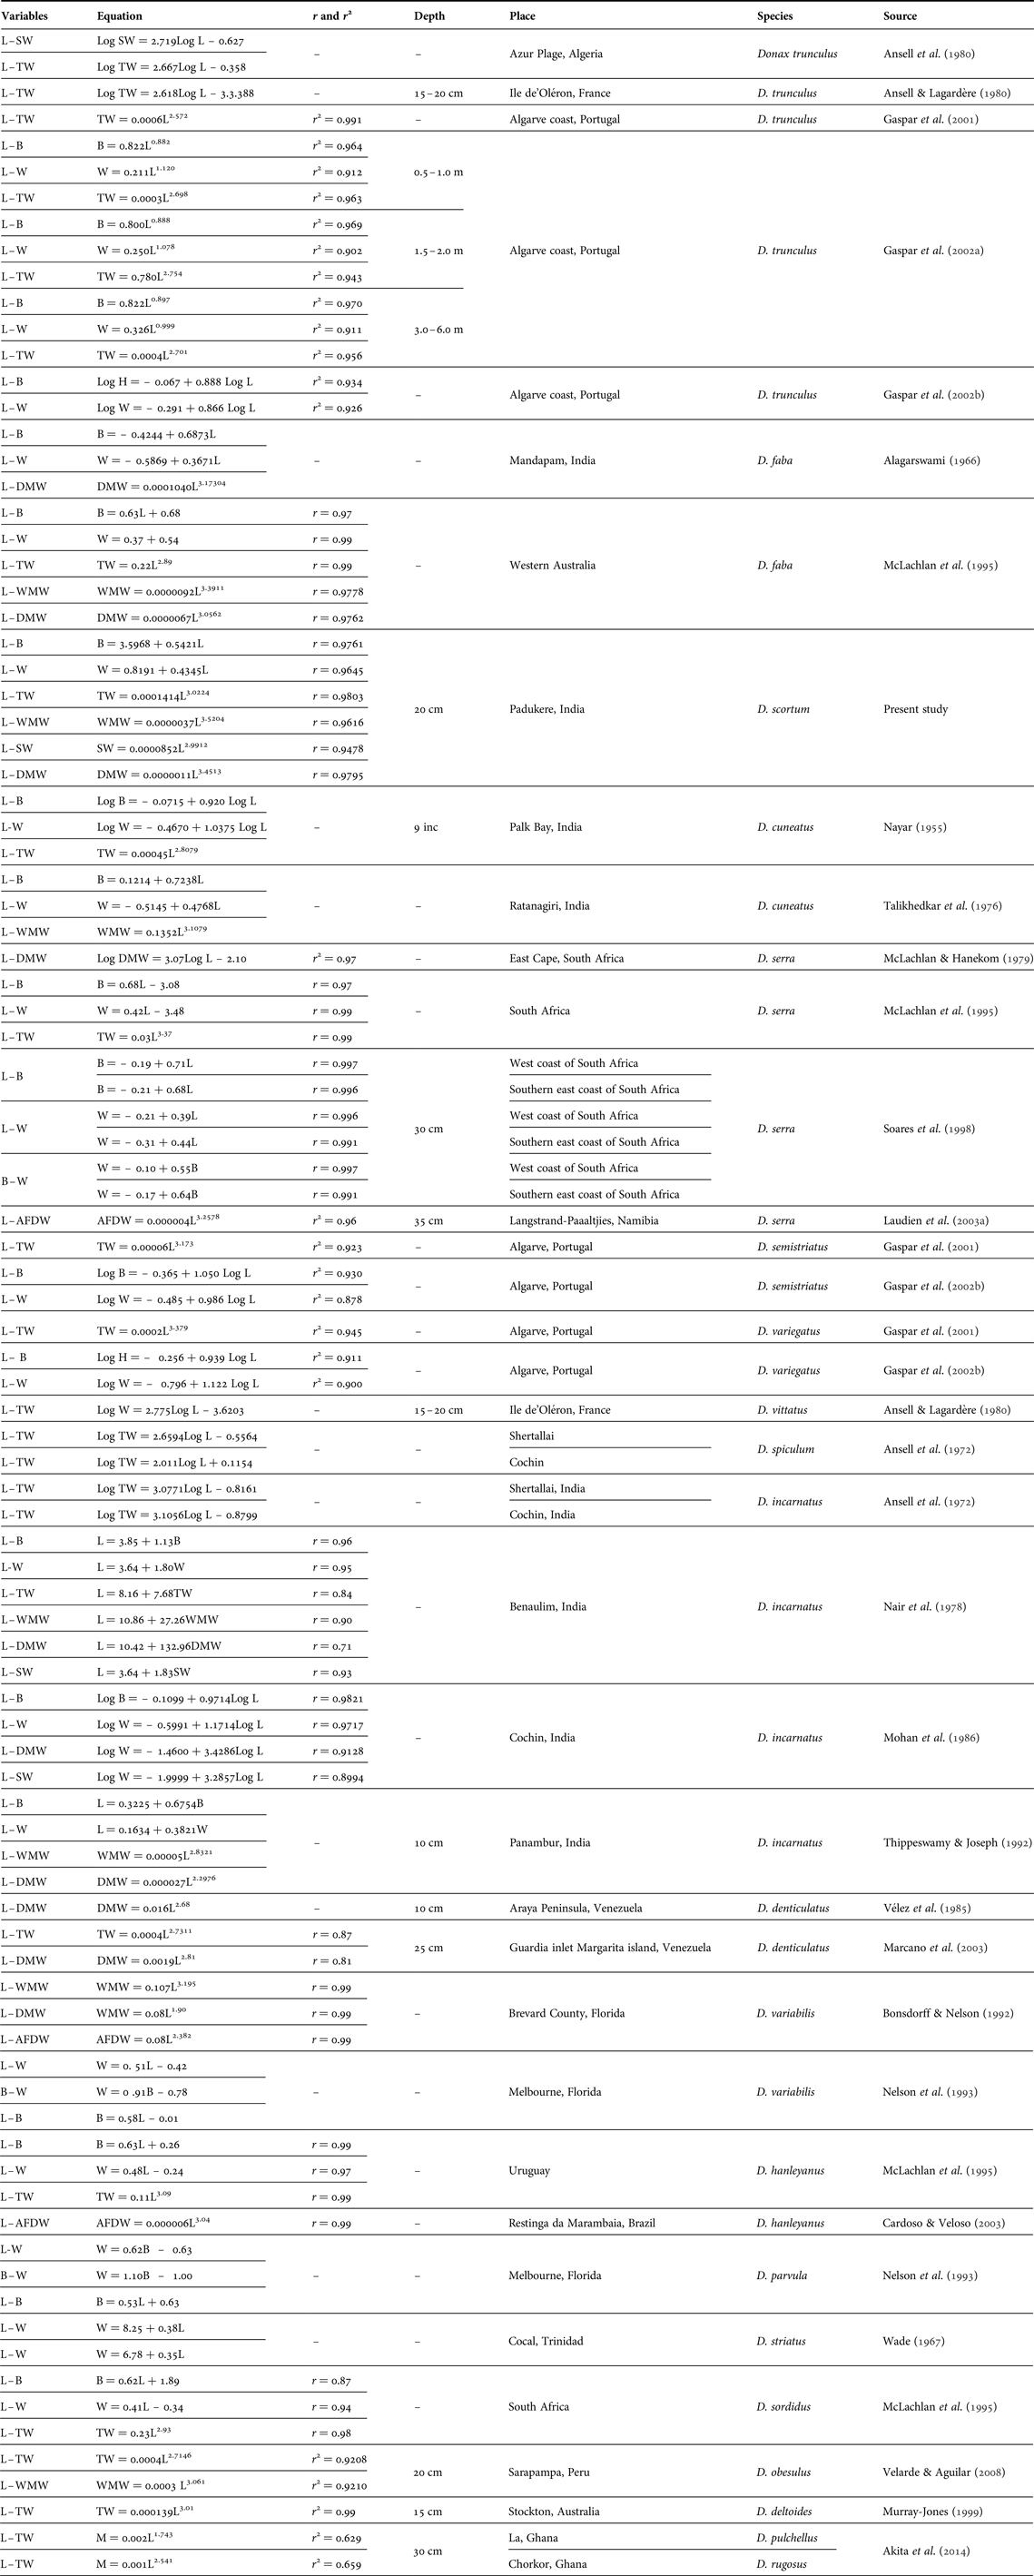
From the Indian coast (Table 3), Alagarswami (Reference Alagarswami1966) recorded the length-height relationship of D. faba collected from the Gulf of Mannar with Y = −0.4244 + 0.6837X, where Y is the height and X is the length. Nayar (Reference Nayar1955) established the logarithmic length-breadth equation of D. cuneatus in Palk Bay. The equation was Log B = −0.0715 + 0.9200 LogL. In Miriya Bay, the length-breadth equation, B = 0.1214 + 0.7238L was recorded by Talikhedkar et al. (Reference Talikhedkar, Mane and Nagabhushanam1976) for D. cuneatus. Nair et al. (Reference Nair, Dalal and Ansari1978) and Thippeswamy & Joseph (Reference Thippeswamy and Joseph1992) recorded L = 3.85 + 1.13 B and L = 0.3225 + 0.6754B from Benaulim and Panambur beaches respectively for D. incarnatus. The length-breadth relationship in D. scortum in Padukere beach was B = 3.5968 + 0.5421L. The equation of the length-width relationships of D. scortum was W = 0.8191 + 0.4345L. The relationships (length-breadth and length-width) shows linear patterns in the present study. Nayar (Reference Nayar1955) established the length-width relationship of D. cuneatus in the Palk Bay. The equation reported by Nayar was Log W = 0.4670 + 1.0375 LogL. Alagarswami (Reference Alagarswami1966) reported that the length-thickness relationship of D. faba followed a linear pattern and established the value, Y = −0.5867 + 0.3671X where Y is the thickness and X is the length. Talikhedkar et al. (Reference Talikhedkar, Mane and Nagabhushanam1976) also reported the length-thickness relationship and the equation was W = −0.5145 + 0.4768L. Apart from this, Nair et al. (Reference Nair, Dalal and Ansari1978) and Thippeswamy & Joseph (Reference Thippeswamy and Joseph1992) recorded L = 3.64 + 1.80W and L = 0.1634 + 0.3821W from Benaulim and Panambur for D. incarnatus respectively. The length-breadth and length-width relationships in D. scortum showed linear patterns. It is in agreement with the findings of earlier reports. Nielsen & Sand-Jensen (Reference Nielsen and Sand-Jensen1990) reported that allometric relationships vary for a wide range of metabolic process with different species. The length-breadth and length-width relationships are also linearly related in other geographic regions (Table 3) indicating that long individuals are wider and thicker and inversely, short individuals are narrow and less thick. This clearly reflects the fact that length, breadth and width are influenced by one general attribute, that is variation in size. However, some individuals of the same length show different breadth and width, and these differences constitute shape variation. Thus, proportionate change in the shell dimensions resulted in retaining the wedge shape.
Morphometric and length-weight relationships of Donax species from different geographical regions.

L, Length; B, Breadth; W, Width; TW, Total weight; WMT, Wet meat weight; SW, Shell weight; DMW, Dry meat weight; AFDW, Ash free dry weight; r, correlation coefficient; r 2, coefficient determination.
Bivalve shell growth and shape are influenced by biotic (endogenous/physiological) and abiotic (exogenous/environmental) factors. A variety of environmental factors are known to influence shell morphology and relative proportions of many bivalve species such as latitude (Beukema & Meehan, Reference Beukema and Meehan1985), shore level (Franz, Reference Franz1993), depth (Claxton et al., Reference Claxton, Wilson, Mackie and Boulding1998), currents (Fuiman et al., Reference Fuiman, Gage and Lamont1999), tidal level (Dame, Reference Dame1972), type of bottom (Claxton et al., Reference Claxton, Wilson, Mackie and Boulding1998), water turbulence (Hinch & Bailey, Reference Hinch and Bailey1988), type of sediment (Newell & Hidu, Reference Newell and Hidu1982; Thippeswamy, Reference Thippeswamy1985), genetics (Laudien et al., Reference Laudien, Flint, van der Bank and Brey2003b; Carstensen et al., Reference Carstensen, Laudien, Leese, Arntz and Held2009) and wave exposure (Akester & Martel, Reference Akester and Martel2000). Burrowing behaviour, ability and efficiency also affect the relative growth of bivalve species (Eagar, Reference Eagar1978; Seed, Reference Seed, Rhoads and Lutz1980). The possibility that allometric relationships describe the rates for a wide range of metabolic processes and over different size of the organism and different species have important ecological implications (Nielsen & Sand-Jensen, Reference Nielsen and Sand-Jensen1990).
The proportionate change in shell dimensions resulted in retaining the shape. The b values of morphometric relationships are used to compare between dimensional growth of related species or same species in varied habitats. Size of wedge clams is more affected by their shell shape and also by fluctuations of ambient environmental parameters. Thus shape rather than size generally provides more precise information on the three dimensional relationships. Probably, shape is controlled by its genetics, whereas size of organisms by ambient environment coupled with the population selection strategies. The values of correlation coefficient (r) for Donax species recorded in the present study was more than 0.9 throughout the study period indicating a highly significant relationship in morphometry (length-breadth and length-width) and length-weight (length-total weight, length-wet meat weight, length-shell weight and length-dry meat weight) relationships. These agree with findings of several authors who recorded correlation coefficient (r) and coefficient determination (r2 ) more than 0.9 or nearly 0.9 for different species of Donax from different geographic areas (Table 3).
Wilbur & Owen (Reference Wilbur, Owen, Wilbur and Yonge1964) suggested that the equilibrium constant b lies between 2.5–4.5 in the case of bivalves with exception of the worm-like Teredo (Isham et al., Reference Isham, Moore and Smith1951) in which a more nearly linear relation (b = 1) was reported, and the relation is said to be isometric when it is equal to 3 (Carlander, Reference Carlander1977). In the case of fish, the relation is said to be isometric when it is equal to 3, reported for most fish (Quinn & Deriso, Reference Quinn and Deriso1989). In the present study, the b values for the length-weight relationships of the wedge clams are within this limit. All the b values lie between 2.5–4.5. Ansell et al. (Reference Ansell, Sivadas, Narayanan and Trevallion1972) reported that the b values of Donax incarnatus inhabiting two localities at Shertallai and Cochin were 3.0771 and 3.1056 respectively for the length-total weight relationship. These values are comparable with the present values recorded for D. scortum species studied from Padukere (Table 3). They further noticed that the equilibrium constant b values of the smallest wedge clam, D. spiculum inhabiting two localities at Shertallai and Cochin were 2.6594 and 2.0118 respectively for the length-total weight, i.e. less than 3. On the other hand, the b value (3.4286) reported by Mohan et al. (Reference Mohan, Damodaran and Salih1986) for D. incarnatus from Cochin is close to the present b value (3.4513) of D. scortum for the length-dry weight relationship. Thippeswamy & Joseph (Reference Thippeswamy and Joseph1991) found that the b values of the length-wet meat weight and length-dry meat weight relationships were 2.8321 and 2.2976 respectively. These values are lower than that of D. scortum reported from Padukere.
The length-weight relationship provides a mathematical expression between two variables, length and weight, and also provides a measure of deviation between the two variables, indicating the state of general well-being of the organism. The maximum b values of length-total weight and length-wet meat weight relationships were 3.0411 and 3.7142 in October and February respectively. Similarly, the peak values of b for the length-wet meat weight (3.7142) and length-dry meat weight (3.9200) relationships occurred in the same month (February) (Figure 5) for D. scortum. For the length-shell weight relationship analysed, the highest b value (3.0574) was found in March. The skewed relationship in D. scortum (Figure 4) indicated that short individuals were light and long individuals were heavy. Similar observations on donacids have been reported by Thippeswamy & Joseph (Reference Thippeswamy and Joseph1992) for D. incarnatus from Karnataka coast. This clearly indicated that as age increased, the weight of clams also increased. However, some individuals of the same age showed different weights and these differences could be due to physiological condition, reproductive strategies and environmental variables (Bauer, Reference Bauer1987; Ravera et al., Reference Ravera, Frediani and Riccardi2007).
The bivalves display marked seasonal variations in weight and biochemical content of the soft tissue (Ansell et al., Reference Ansell, Frenkiel and Mouëza1980; Williams & McMahon, Reference Williams and McMahon1989). In allometric length-weight relationship, the most interesting component is the equilibrium constant b, the variations of which from hypothetical unity suggest physiological changes in condition. In bivalves, when gonadal growth and maturation occur, it results in bulkiness of soft body and consequent high body weights. Such sudden shift in the b values indicated the onset of maturation and gonadal growth in bivalves. Monthly analyses (Figure 5) show that wedge clams maintain their non-linear pattern from spat stage onwards. However b values are different indicating the variations in condition index and reproductive biology (Thippeswamy & Joseph, Reference Thippeswamy and Joseph1988; Tirado & Salas, Reference Tirado and Salas1999).
An interesting aspect of length-weight relationships in bivalves is the allometry exhibited during the gonadal development. In the allometric length-weight relationship, the variation in equilibrium constant (b) represents the growth in weight rather than that of length. Relatively large variations in flesh content occur in bivalve molluscs depending upon the physiological condition and variation in environmental parameters (Wilbur & Owen, Reference Wilbur, Owen, Wilbur and Yonge1964). A value less than b = 3.0 shows that the organism becomes heavier as it grows. Length-weight relationship allows prediction of weight from length in yield assessment (Pauly, Reference Pauly1983). The weight reflects the general condition of clams. However, the b values were different which could be related to reproductive cycle. Similar observations were made by Thippeswamy (Reference Thippeswamy1985), and Tirado & Salas (Reference Tirado and Salas1999) for donacids (Donax incarnatus, D. venustus, D. semistriatus), Hemachandra (Reference Hemachandra2011) for green mussel (Perna viridis) from Karnataka. In allometric length-weight relationship, the most interesting component is the equilibrium constant b, the variations of which from hypothetical unity suggested physiological changes in condition.
Several workers have studied the condition index of bivalves. Baird (Reference Baird1958) measured the index of condition in both mussels and oysters and expressed the index of condition as percentage of shell cavity by meat. In marine bivalves, there are a few important factors which contribute to increase the condition indices. Condition index and cycles of gonadal development follow each other closely. Gametogenesis and release of gametes appears to have a direct impact on the condition of wedge clam. Spawning process depends on a complex interaction of several endogenous and exogenous factors, whereas the duration of maximum values of condition index correspond to the pre-spawning peak of gonad index.
In bivalves, there are important factors which contribute to increase in condition indices; they are gonadal growth, somatic growth, parasitic castration and tissue irrigation (Joseph, Reference Joseph1979; Thippeswamy, Reference Thippeswamy1985). The shell volume enlargement during growth allows the individuals to generate more visceral mass, which increases considerably during the maturation and reproduction phases of the donacid life cycle (Mouëza & Frenkiel-Renault, Reference Mouëza and Frenkiel-Renault1973; Bayed, Reference Bayed1990). In most bivalves, gonadal growth during the pre-spawning period results in increasing the bulk of the gonad as a result of which the gonad forms the bulk of the visceral mass. In such bivalves, variation in condition index reflects the reproductive status. Thus accumulation of gametes in follicles and resultant bulkiness of the gonad as well as release of gametes from the follicles and emptying and shrinking of the gonad result in corresponding fluctuations in condition indices as seen in most bivalve species (Joseph, Reference Joseph1979; Hemachandra & Thippeswamy, Reference Hemachandra and Thippeswamy2008). Whether the variation in condition index truly reflects the breeding periodicity and gonadal status of the bivalves or not can be examined only from a study of the histological characteristics of the gonad during the breeding cycles. In the absence of such conclusive evidence, an indirect method of checking whether condition indices are related to breeding cycles is to examine the spat settlement of the species at the site of study. Although bivalve larvae are planktonic and may settle elsewhere, most breeding activities result in high settlement of spat in or near the same habitat or nearby place.
Based on the present data for Donax scortum, there are two major peaks (June 2009 and December 2010) of condition index. The appearance of spat of this clam is observed in February in the beginning of the first pre-monsoon period when the values of salinity, phosphate and silicate are very high (Table 1). It is suggested that the ideal periods of exploitation of D. scortum from the study area, Padukere beach are April, June and December. During the monsoon season, the very young clams could not be collected. Probably the larvae would have been washed off or died because of adverse conditions such as low salinity and high wave action. These would have resulted in no settlement. Donax scortum has a specific shell cavity and the shell is very heavy compared with other donacids found in Asia. During the present study, a few specimens of D. scortum exhibited either thinning or thickening of shell in the same length group. Thickening of the shell is due to old age of clam. Therefore, shell weights showed fluctuations and the shell cavities reflected the variations of the condition index. The condition index is an important basic measurement of the physiological status of mussels, clams and oysters, and the relative allocation of resources for tissue or shell growth. In bivalves, it is influenced by many factors such as population density, size, gonad development, salinity, temperature, food supply and environmental contaminants (Lucas & Beninger, Reference Lucas and Beninger1985; Loesch & Evans, Reference Loesch and Evans1994; Iglesias et al., Reference Iglesias, Camacho, Navarro, Labarta, Beiras, Hawkins and Widdows1996). In the current study, the condition index is also influenced by salinity, i.e. there is a strong positive correlation between them (Table 2). The condition index response to environmental change is often species specific, differs within bivalve groups and varies between and within geographic locations (Rainer & Mann, Reference Rainer and Mann1992; Marsden & Pilkington, Reference Marsden and Pilkington1995).
The application of PCA has shown the possible correlation between biological parameters of D. scortum. PCA applied to biological variables of D. scortum revealed a total of three components, which accounted for a total variance of 92.63%. Component 1 (length, breadth, width, total weight, wet meat weight, dry meat weight, shell weight and b value of length-breadth) accounted for as much variance as possible (48.59%) followed by Component 2 (condition index, b values of length-width, length-total weight and length-shell weight). Component 3 (b values of length-wet meat weight and length-dry meat weight) accounted for total variance. The variables of all three components have positive values except the b values of length-breadth in Component 1 and CI in Component 2.
The plots of Component 1 and Component 2 of biological variables are shown in Figure 8. From this, two major groups were obtained. Group 1 consists of biological variables such as sample size, and b values of length-width, length-total weight and length-shell weight. Group 2 consists of length, breadth, width, total meat weight, wet meat weight, dry meat weight and shell weight. The b values of length-breadth, length-wet meat weight and length-dry meat weight and CI are far away from these major groups. Based on the above results, dimensional variables and allometric length-weight relationships are influenced by the ambient environment and the physiology of the organisms.
ACKNOWLEDGEMENTS
The author is grateful to the authorities of Mangalore University (Karnataka) for providing research facilities during research work.
FINANCIAL SUPPORT
The research work was supported by BSR-UGC Meritorious Fellowship (UGC No.4-1/2008(BSR)) from University Grant Commission, New Delhi, India.