The causes of most mental disorders and complex behaviors are likely caused by the joint effects of genetic and environmental factors (Hernandez & Blazer, Reference Hernandez and Blazer2006; Rutter, Moffitt, & Caspi, Reference Rutter, Moffitt and Caspi2006). A gene–environment interaction (G × E) refers to genotypic differences in susceptibility to an environmental exposure (Kendler & Eaves, Reference Kendler and Eaves1986; Moffitt, Caspi, & Rutter, Reference Moffitt, Caspi and Rutter2005). G × E findings have already been identified for a wide spectrum of human diseases including colorectal cancer, HIV, and obesity, as well as psychiatric disorders (see Hunter, Reference Hunter2005; Rutter et al., Reference Rutter, Moffitt and Caspi2006). Further investigation of G × E will provide an important method for extending our understanding of both normal and pathological development in humans, particularly as measures of phenotype and environment move toward more proximal or process conceptualizations. G × E effects may play a role in explaining why genetic main effects have a high level of variability across studies (Ioannidis, Trikalinos, & Khoury, Reference Ioannidis, Trikalinos and Khoury2006), and may help explain the heterogeneity of findings across randomized controlled trials of the same treatment (Kraemer, Frank, & Kupfer, Reference Kraemer, Frank and Kupfer2006). Interactions are also important methodologically, as ignoring their effects can lead to erroneous conclusions regarding the magnitude of genetic effects (Guo, Reference Guo2000).
Studies of G × E are likely to show a highly variable pattern of findings across studies similar to those found for association studies of genetic main effects. The variability of G × E findings may be partly explained by the fact that the power to detect interaction effects can be small and is affected by a number of methodological artifacts (Aguinis & Stone-Romero, Reference Aguinis and Stone-Romero1997; Aiken & West, Reference Aiken and West1991) such as measurement error and measurement range restriction. It is therefore important to have G × E findings replicated so that an overall estimate of the statistical and theoretical significance of any given G × E can be based on cumulative and systematically combined knowledge.
Although meta-analytic methods for the combination of study findings based on single effect measures, such as odds ratios and mean differences, are well established (Egger, Smith, & Altman, Reference Egger, Smith and Altman2001), equivalent methods for the meta-analysis of studies investigating interactions are not well developed. Thus, the objective of this methodological report is to describe one simple approach to the meta-analysis of G × E effects using, as an up to date example, the interaction of the monoamine oxidase A (MAOA) gene and the impact of childhood maltreatment on risk for developing antisocial behavior (Caspi et al., Reference Caspi, McClay, Moffitt, Mill, Martin and Craig2002).
Meta-analysis Methods Applied to G × E
The methods of meta-analysis (Egger et al., Reference Egger, Smith and Altman2001; Egger, Smith, & Phillips, Reference Egger, Smith and Phillips1997; Hunter & Schmidt, Reference Hunter and Schmidt2004; Lipsey & Wilson, Reference Lipsey and Wilson2001) are now well developed, and have been extensively used across both biomedical and social sciences to assist researchers in the systematic evaluation of research evidence. The goal of meta-analysis is to provide formal statistical methods to synthesize findings across studies of the same treatment or phenomena. A meta-analysis consists of the following seven broad steps: (a) define the research question to be analyzed, such as the effectiveness of a drug treatment or the existence and magnitude of a G × E; (b) identify relevant research reports, including unpublished manuscripts where applicable; (c) extract measures of effect size and a description of salient study characteristics from each report based on a predefined protocol; (d) select the studies that are to be included in the final meta-analysis (these should meet defined inclusion criteria, such as having comparable definitions of the study outcome); (e) convert all effect measures to a common metric, for example, translating all measures to odds ratios or correlations; (f) combine the individual study estimates using standard meta-analytic techniques that weight effect measures by an estimate of their precision to obtain an overall or combined effect size and confidence interval (CI); and (g) carry out sensitivity analyses of the results to study specific confounders and investigate publication bias.
Meta-analysis has become particularly well developed in the assessment of clinical trials, which provides a “gold standard” of methods and procedures for the application of meta-analytic methods. At the initial stage of trial publication, the Consolidated Standards for Reporting Trials Checklist (Moher et al., Reference Moher, Cook, Eastwood, Olkin, Rennie and Stroup1999; Plint et al., Reference Plint, Moher, Morrison, Schulz, Altman and Hill2006) guidelines for clinical trials ensures that study analyses are reported with sufficient detail to provide the necessary building blocks for systematic reviews based on meta-analytic methods. The Cochran Collaboration (Higgins & Green, Reference Higgins and Green2006) provides guidelines for the appropriate conduct of a meta-analysis and the Quality of Reporting of Meta-Analysis Statement (Moher et al., Reference Moher, Cook, Eastwood, Olkin, Rennie and Stroup1999) recommendations set out best practice reporting standards for the completed analysis.
G × E studies often use epidemiological cohort studies where reporting standards are not well developed and where the quality of study reporting can be highly variable (von Elm & Egger, Reference von, Elm and Egger2004). Inconsistency in reporting is partly because of the complexity of the phenomena under study and the variety of study designs and analysis techniques used. This influences the quality and ease of carrying out a meta-analysis as variable reporting impacts the ability to extract and validly combine results across studies. There are now some recommendations on the reporting of meta-analyses based on epidemiological studies (Stroup et al., Reference Stroup, Berlin, Morton, Olkin, Williamson and Rennie2000), which should help these analyses attain the standards set by the meta-analysis of clinical trials. A further development toward high-quality meta-analyses is taking place in the field of genetic epidemiology where the Human Genome Epidemiology Network is providing recommendations for the reporting of genetic epidemiology studies, and the conduct and reporting of meta-analyses of these studies (Little & Higgins, Reference Little and Higgins2006). In time, these guidelines will be extended to provide recommendations for the initial reporting and conduct of meta-analyses of G × E studies. It is also important to realize that meta-analysis is not without its critics and the meta-analysis of observational studies, as are often used in G × E research, is particularly controversial (Egger, Schneider, & Smith, Reference Egger, Schneider and Smith1998). Therefore, the meta-analysis of observational studies should be carried out with additional caution, compared to the analysis of randomized controlled trials, because the effects of confounding, selection effects, and publication bias are likely to be more important (Egger et al., Reference Egger, Schneider and Smith1998).
The method described in this report for the meta-analysis of G × E findings is based on using differences in correlations as the effect measure. As a first step, the association between the environmental risk and the phenotype of interest is converted to a correlation for each genotype group. These correlations can then be included in a meta-analysis by genotype group to investigate the consistency of the association across studies by genotype.
Two broad approaches are available for the meta-analysis of correlations, particularly if one focuses on the generally more conservative random effects methods used here (Field, Reference Field2005). First, there is the Hunter–Schmidt method, which is based on combining untransformed correlations and which also allows for the adjustment for study artifacts, such as range restriction, measurement error, and dichotomization of study variables. Second, there is the Hedges–Olkin method based on the Fisher z transformation of correlations and associated standard error, which is more easily applied using currently available meta-analytic software such as that available in the package STATA (StataCorp, 2005). Recent simulation research (Field, Reference Field2005) provides a useful introduction to these methods and compares the bias and efficiency of the two methods. The simulations showed that neither method was necessarily superior in all situations, especially if correlations were below .5. We have therefore chosen to use the Hedges–Olkin approach because it is the easier to estimate using available software. Given the controversial nature of G × E, we also did not want to apply potentially contentious adjustments for study artifacts, such as measurement error and range restriction, which is a particular strength of the Hunter–Schmidt approach.
The conversion of effect measures to a common metric is an inexact science. Although there are a few good sign posts along the way, of particular assistance are the formulae and discussion in appendix B of Lipsey and Wilson (Reference Lipsey and Wilson2001) and the associated Excel Worksheet. The optimal procedure is to obtain correlations directly from a published report or to approach the authors for these effect measures.
To apply the method of differences in correlations across genotype groups, it may be necessary to collapse across multiple genotype groups. For example, with a biallelic locus with alleles A and a, there are three possible genotypes: AA, Aa, and aa. If we assume a dominant model for the A allele, this will result in two genotype groups A (AA and Aa) and aa; a recessive model will result in two different groups AA and a (Aa and aa), whereas an additive model assumes that each of the three genotype groups has a unique effect. Choice of genetic model is particularly problematic for the meta-analysis of G × E as correlations are required for two genotype groupings only (either the dominant or recessive model above), defined equivalently over all studies. If reports vary in the type of model they assume, as is likely to be the case, it may be very difficult to convert effect measures using a common genetic model without assistance from the study authors. Once the two groups have been defined, the difference in correlations for each study is calculated using the z-transformed correlations for each genotype group and its associated standard error. Formulae for this transformation and the calculation of standard errors, for both correlations and their differences, are widely available (see, e.g., Ferguson, Reference Ferguson1981, pp. 193–195).
A crucial component of any meta-analysis, but particularly for those based on observational data, is to investigate the level of heterogeneity of effect sizes across studies and the impact of publication bias. Heterogeneity across studies can be assessed using the chi-square based Q statistic, as well as the I 2 measure of the percentage of across-study variation attributable to heterogeneity (Egger et al., Reference Egger, Smith and Altman2001; Higgins, Thompson, Deeks, & Altman, Reference Higgins, Thompson, Deeks and Altman2003; Higgins & Thompson, Reference Higgins and Thompson2002). Given that the first published finding is generally larger than subsequent replications (Ioannidis, Reference Ioannidis2005), a simple sensitivity analysis should be carried out by reestimating the pooled effect size excluding the first published study. To determine if any given study is having an excessively large effect on the pooled estimate, it is also useful to reestimate the pooled effect excluding each study in turn, using a type of “jack-knife” procedure. This procedure is implemented in STATA in the metaninf command. Regression-like methods that investigate how study-specific confounders, such as average age at assessment, explain effect size heterogeneity can also be useful. These are implemented in STATA through the metareg procedure. As this method is not appropriate with a small number of studies (Thompson & Higgins, Reference Thompson and Higgins2002), we do not present results in our example using this procedure because there are only eight MAOA by maltreatment G × E studies currently available for meta-analysis. Publication bias occurs when studies that show negative or nonsignificant findings are less likely than positive studies to be published. This will result in the combined effect estimate being biased toward finding a significant effect. Publication bias can be detected using funnel plots and formal statistical tests, and these are implemented in STATA in the metabias command (Begg & Mazumdar, Reference Begg and Mazumdar1994; Egger, Smith, Schneider & Minder, Reference Egger, Smith, Schneider and Minder1997). It should be noted that all of the procedures for detecting across-study heterogeneity and publication bias have low power.
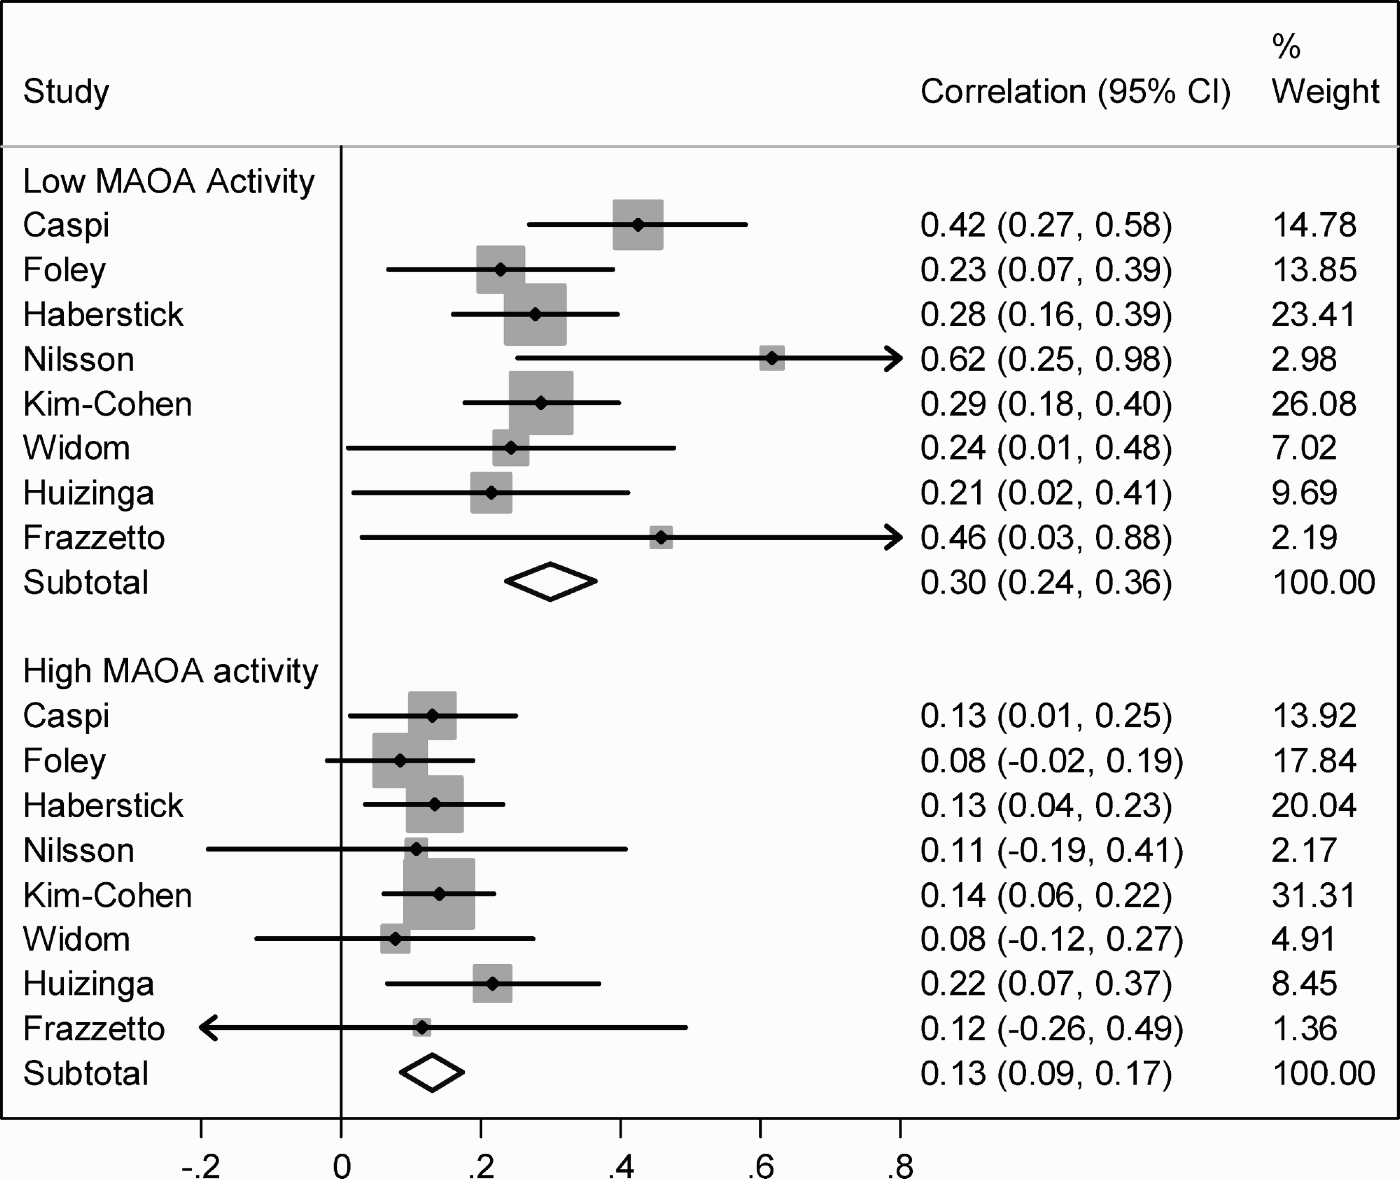
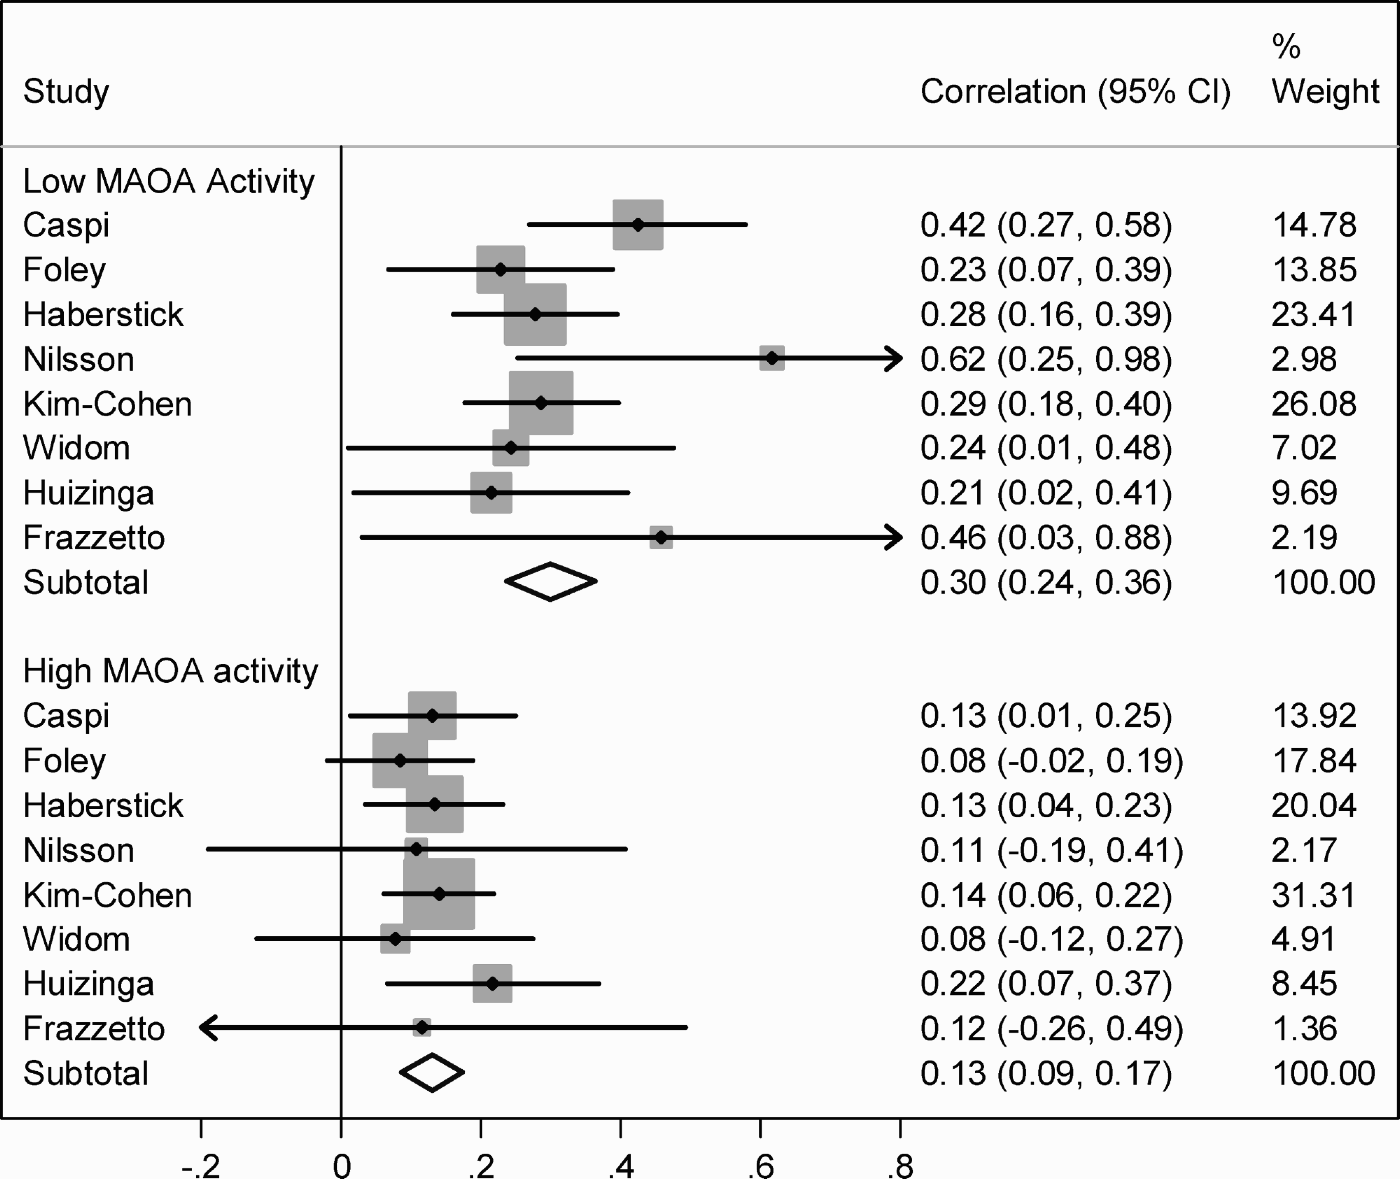
The visual presentation of results in a forest plot should be standard practice and provides a convenient method of visually assessing the results of a meta-analysis. For example, Figure 1 displays each study's effect size, together with CIs and the weight given to each study in the combined estimate. Squares are used to denote the size or importance of each study in the overall estimate. The overall combined estimate, together with its CI, is also plotted.
A forest plot of the meta-analysis of the correlations between antisocial behavior and childhood maltreatment for each monoamine oxidase A (MAOA) genotype group. Weights are from random effects analysis.
A number of software programs are available to carry out meta-analysis including RevMan (Cochran Collaboration, 2002), a freely available meta-analysis suite from the Cochran Collaboration and commercial software such as Comprehensive Meta-Analysis (see Sterne, Bradburn, & Egger, Reference Sterne, Bradburn, Egger, Egger, Smith and Altman2001, for a review). As noted above, the general statistical package STATA (StataCorp, 2005) also provides a large suite of user-provided meta-analysis commands (Sterne et al., Reference Sterne, Bradburn, Egger, Egger, Smith and Altman2001). We used the STATA metan command here.
Example: Maltreatment, MAOA, and Antisocial Behavior
As an example, we will describe a meta-analysis of the interaction between the MAOA gene and childhood maltreatment on the risk of later conduct problems and criminality, a finding initially identified by Caspi and colleagues (2002). This was the first study in behavioral science to document a G × E. This cohort study, using data from the Dunedin Multidisciplinary Health and Development Study has many qualities that give weight to this finding. In particular, it is a longitudinal cohort study from birth to age 26 years with very good retention rates and rigorous, well-validated measurement protocols over the multiple waves of data collection. The G × E identified in this study involves a functional polymorphism in the promoter region of the MAOA gene, where maltreated children with the MAOA genotype conferring low levels of the MAOA enzyme more often developed conduct disorder, antisocial personality, and violent criminality in adulthood than maltreated children with a high activity MAOA genotype. A number of attempted replications of this finding have been published and a preliminary meta-analysis was published in 2006, which reported a significant pooled interaction effect size of .18 (Kim-Cohen et al., Reference Kim-Cohen, Caspi, Taylor, Williams, Newcombe and Craig2006). Since then, three additional studies, two positive (Frazzetto et al., Reference Frazzetto, Di Lorenzo, Carola, Proietti, Sokolowska and Siracusano2007; Widom & Brzustowicz, Reference Widom and Brzustowicz2006) and one negative (Huizinga et al., Reference Huizinga, Haberstick, Smolen, Menard, Young and Corley2006) replication, have been published and a reevaluation of this G × E hypothesis is warranted.
In this meta-analysis update, studies were included if they fulfilled four criteria. First, the study had to be published in a peer-reviewed journal. Second, the study had to include genotypic information on the variable number tandem repeat polymorphism in the promoter region of the MAOA gene. Third, the study had to include a measure of serious familial adversity in childhood that was significantly associated in a main effect fashion with the outcome measure. Fourth, the sample had to include males drawn from a nonclinical population. There are now eight studies that meet all of these inclusion criteria (Caspi et al., Reference Caspi, McClay, Moffitt, Mill, Martin and Craig2002; Foley et al., Reference Foley, Eaves, Wormley, Silberg, Maes and Kuhn2004; Frazzetto et al., Reference Frazzetto, Di Lorenzo, Carola, Proietti, Sokolowska and Siracusano2007; Haberstick et al., Reference Haberstick, Lessem, Hopfer, Smolen, Ehringer and Timberlake2005; Huizinga et al., Reference Huizinga, Haberstick, Smolen, Menard, Young and Corley2006; Kim-Cohen et al., Reference Kim-Cohen, Caspi, Taylor, Williams, Newcombe and Craig2006; Nilsson et al., Reference Nilsson, Sjoberg, Damberg, Leppert, Ohrvik and Alm2006; Widom & Brzustowicz, Reference Widom and Brzustowicz2006). A study by Young and colleagues (Reference Young, Smolen, Hewitt, Haberstick, Stallings and Corley2006) was excluded because their entire sample consisted of adolescents in clinical treatment for serious conduct problems, no matched control group was included, and their measure of lifetime conduct disorder symptoms placed the temporal ordering of the risk and outcome variables in question.
The correlations of interest were those reported between maltreatment and antisocial behavior within each MAOA genotype group. If papers reported more than one outcome measure, the most general measure of antisocial behavior (e.g., composite measures) was chosen for inclusion in the meta-analysis. If papers reported separate correlations for Whites and non-Whites or for clinical and nonclinical samples, we chose effect measures for Whites and nonclinical subgroups only to enhance consistency across studies. For two studies (Caspi et al., Reference Caspi, McClay, Moffitt, Mill, Martin and Craig2002; Kim-Cohen et al., Reference Kim-Cohen, Caspi, Taylor, Williams, Newcombe and Craig2006), we had direct access to the data and could easily obtain the appropriate summary information. The authors of a further five studies provided us with the appropriate summary information, as this could not be easily extracted from their published reports (Frazzetto et al., Reference Frazzetto, Di Lorenzo, Carola, Proietti, Sokolowska and Siracusano2007; Haberstick et al., Reference Haberstick, Lessem, Hopfer, Smolen, Ehringer and Timberlake2005; Huizinga et al., Reference Huizinga, Haberstick, Smolen, Menard, Young and Corley2006; Nilsson et al., Reference Nilsson, Sjoberg, Damberg, Leppert, Ohrvik and Alm2006; Widom & Brzustowicz, Reference Widom and Brzustowicz2006). The remaining study (Foley et al., Reference Foley, Eaves, Wormley, Silberg, Maes and Kuhn2004) reported findings based on a binary phenotype and a categorical environmental risk and presented a table containing a full tabulation of results that could be used to recreate the data and apply standard methods of conversion from odds ratios to correlations (Chinn, Reference Chinn2000; Lipsey & Wilson, Reference Lipsey and Wilson2001). All correlations were z transformed and their standard errors calculated. As noted above, the meta-analysis was carried out using the most up to date version of the metan command available in STATA 9.2 (StataCorp, 2005; Sterne et al., Reference Sterne, Bradburn, Egger, Egger, Smith and Altman2001). Fixed- and random-effects estimates and results were consistent across all analyses; only results from the more conservative random-effects model are reported here. The meta-analysis of the interaction effect was carried out using the difference in the transformed correlations across the MAOA groups and the associated standard errors for each study.
The forest plot and results in Figure 1 show the meta-analysis of the correlations between maltreatment and antisocial behavior by MAOA activity group for all studies. This gives an overview of the interaction effect as it shows the across-study effect size within each MAOA genotype group, although it does not provide a formal test of the significance of the interaction effect. Within the high MAOA activity group, there was no evidence of significant heterogeneity across studies, χ2 (7) = 2.40, p = .935, I 2 = 0.0%, but there was mild to moderate heterogeneity across studies in the low MAOA group as indicated by the I 2 measure, χ2 (7) = 7.84, p = .347, I 2 = 10.7%. The random-effects pooled estimates within MAOA activity groups were as follows: low MAOA activity, .30 (95% CI = .24 and .36, p < .001); high MAOA activity, .13 (95% CI = .09 and .17, p < .001). Transformation from z-transformed values back to correlations, as expected, gives almost identical results because of the small size of the correlations: low MAOA activity, .29 (95% CI = .23 and .35, p < .001); high MAOA activity, .13 (95% CI = .09 and .17, p < .001).
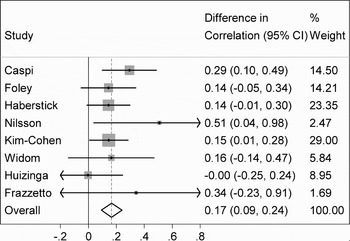
The results for the meta-analysis of the interaction effect, using the differences in correlations by MAOA activity group, are shown in Figure 2. No significant heterogeneity was detected across the studies, χ2 (7) = 6.07, p = .532, I 2 = 0.0%. The pooled random effects estimate of the difference in correlations across the low versus high MAOA groups indicated a significant difference in correlations of .17 (95% CI = .09 and .24, p < .001). Again, transformation back to correlations produced little change to these estimates: .17 (95% CI = .09 and .23).
A forest plot of the differences in the correlations between antisocial behavior and childhood maltreatment across monoamine oxidase A (MAOA) genotype groups. Weights are from random effects analysis.

Two additional sensitivity analyses of the meta-analysis results were conducted. First, the initial published study by Caspi and colleagues (2002) was removed and the results reestimated to rule out any potential bias contributed by the first published study of this interaction (Ioannidis, Ntzani, Trikalinos, & Contropoulos-Ioannidis, 2001; Trikalinos, Ntzani, Contopoulos-Ioannidis, & Ioannidis, Reference Trikalinos, Ntzani, Contopoulos-Ioannidis and Ioannidis2004). This resulted in a significant but reduced pooled difference in effect of .15 (95% CI = .07 and .23, p < .001). Second, the two studies that reported an effect size larger in magnitude (Frazzetto et al., Reference Frazzetto, Di Lorenzo, Carola, Proietti, Sokolowska and Siracusano2007; Nilsson et al., Reference Nilsson, Sjoberg, Damberg, Leppert, Ohrvik and Alm2006) than the original study were also removed, resulting in a pooled effect of .13 (95% CI = .05, .21, p < .002). Transformation back to correlations had little effect on these estimates.
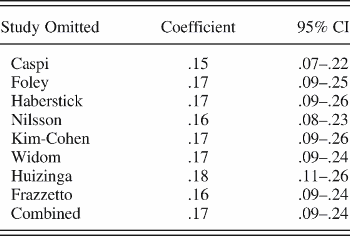
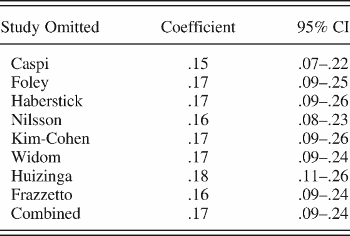
A full sensitivity analysis, where each study is excluded from the calculation of the overall effect size in turn, is presented in Table 1 based on the output of the metaninf command. No publication bias was detected using graphical methods or statistical tests. The cumulative evidence across studies shows a small but significant combined effect of .17, and indicates that the effect of the interaction between MAOA and childhood maltreatment on conduct problems and aggression is robust. It should be noted that the halving in effect size from the initial published study is a common finding in genetic epidemiology (Ioannidis et al., Reference Ioannidis, Ntzani, Trikalinos and Contopoulos-Ioannidis2001) and indicates heterogeneity across study protocols and in the phenomena under study. Confirmation by meta-analysis, albeit still preliminary at this point, indicates that this G × E is a finding worthy of further investigation and replication.
STATA meta-analysis output of differences in correlations between antisocial behavior and childhood maltreatment across MAOA genotype groups if each study is excluded from the meta-analysis
Conclusion
The investigation of the combined effects of genes and environments is set to become increasingly important (Caspi & Moffitt, Reference Caspi and Moffitt2006; Cicchetti & Blender, Reference Cicchetti and Blender2006; Rutter, Reference Rutter2007), with a resurgence of interest being assisted by new funding initiatives (Hernandez & Blazer, Reference Hernandez and Blazer2006). Thus, the synthesis of G × E findings will also become increasingly more necessary and will enhance the value of carefully executed and systematic reviews that utilize the methods of meta-analysis (Foley & Riley, Reference Foley and Riley2007; Kim-Cohen et al., Reference Kim-Cohen, Caspi, Taylor, Williams, Newcombe and Craig2006; Thapar et al., Reference Thapar, Harold, Holmans, Rice, Langley and Fowler2007). In this report, we have described a simple approach to the meta-analysis of G × E and illustrated the method using an example involving the maltreatment and antisocial behavior link.
Meta-analysis of G × E studies has implications for advancing developmental theory. Initially, meta-analysis can determine whether G × E findings are robust across developmental periods by combining results from studies that differ on age of participants or developmental timing of exposure to the environmental pathogen. Our analysis demonstrates that, thus far, the MAOA by maltreatment G × E predicting antisocial behavior holds up across eight different studies with samples that range in mean age from 7 to 32 years. As the number of studies investigating a specific G × E hypothesis grows and as meta-analysis methods for G × E advance, it may then become possible to use meta-analysis to investigate whether effect sizes are significantly different across age-related variables using meta-regression techniques. For example, age at first onset and developmental timing of maltreatment experiences help explain variability in mental health outcomes (Kaplow & Widom, Reference Kaplow and Widom2007; Manly, Kim, Rogosch, & Cicchetti, Reference Manly, Kim, Rogosch and Cicchetti2001). Will the moderating effect of the MAOA genotype on the association between childhood maltreatment and antisocial behavior differ, depending on the age at which maltreatment occurred or the duration of exposure? Related to this, do G × E effect sizes differ, depending on the age at which antisocial outcomes are assessed? Are failures to replicate systematically related to developmental factors? Eventually, answers to such questions will aid in refining the identification of developmental mechanisms by which genes and environmental pathogens contribute to psychopathology and resilience.
As the use of differences in correlations as an effect measure for G × E is a relatively new application of meta-analysis, and given the complexity of the phenomena under study, further methodological work remains to be done. Differences in correlations can also be applied to findings based on more than two genotype groups by collapsing across genotype groups. For a biallelic locus with analyses based on the three genotype groups of AA, Aa, and aa, this method can be applied by collapsing the three groups into two. For example, the combined AA and Aa groups can be compared to the aa group. As the power to detect interactions is relatively low, it will be important to investigate the impact of the loss of information because of collapsing across genotype groups. It will also be important to investigate methods that can be used to combine the results of analyses based on the full three genotype groups; for example, it may be possible to develop meta-analytic methods based on combining the p values of interaction tests. Additional work also needs to be carried out to determine how much information is lost because of effect size conversion and on the value of applying the corrections available in the Hunter–Schmidt approach to the analysis of correlations.
There is also a need to increase the quality of initial study reporting to assist the process of meta-analysis. The minimum data requirements are (a) the total sample size, (b) the proportion of the sample in each group, and (c) the correlations between the environmental risk and mental health outcome for each genotype group. In the absence of correlations, investigators should provide statistics that can be easily translated into correlations or at the very least, standardized regression coefficients that can be used as a proxy for correlations (Peterson & Brown, Reference Peterson and Brown2005) for each genotype group. The increasing use of supplementary on-line material by journals should make it more practical to report the necessary details. Thorough reporting of methods and results is particularly relevant to the study of G × E effects, as the assumed genetic model will have a major impact on the comparability of findings. One crucial reason that the MAOA, maltreatment, and antisocial behavior meta-analysis example used above was relatively easy to execute was that the authors of the replication studies provided the supplementary data that we requested.
This is an exciting time for developmental psychopathology as it wrestles with the complexities of nature–nurture interplay to generate empirical findings and theories that will deepen our understanding of the causes of psychopathology over development. The appropriate application of the meta-analytic method for G × E described here will hopefully help to generate further advances in this evolving field.