Introduction
Wheat is the basic food for a majority of the world's population and contributes significantly to the food security of a growing world population. As wheat is a major constituent of the human diet, enhancing the nutritional quality of wheat especially for increased micronutrient content is an important breeding objective. Micronutrient deficiency is of increasing global concern with over 30 and 60% of the world population estimated to suffer from the deficiency of Zn and Fe, respectively (White and Broadly, Reference White and Broadley2009). This result in overall poor heath, anaemia, increased morbidity and mortality rates, and reduced worker productivity (Welch and Graham, Reference Welch and Graham2004; Bouis, Reference Bouis2007; Peleg et al., Reference Peleg, Saranga, Yazici, Fahima, Ozturk and Cakmak2008; Rehman et al., Reference Rehman, Huma, Tarar and Shah2010). According to WHO (2011), 43% of the world children, 38% of pregnant women, 29% of non-pregnant women and 29% of all women of reproductive age are anaemic. Several approaches such as diverse diet, mineral supplements, and food fortification applied to provide sufficient minerals for the peoples; however, these means cannot solve the problem when we come to the greatest need of the improved mineral nutrition (Rawat et al., Reference Rawat, Neelam, Tiwari and Dhaliwal2013; Guttieri et al., Reference Guttieri, Baenziger, Frels, Carver, Arnall and Waters2015). Bio-fortification of wheat for increased mineral content through breeding can serve as an effective strategy to combat micronutrient deficiency especially in the developing countries where dietary supplementation for micronutrients is low. However, genotypic variation in Fe and Zn contents in grains among wheat cultivars is relatively narrow and limits options for breeding wheat with high contents and bioavailability of Fe and Zn (Cakmak et al., Reference Cakmak, Torun, Millet, Feldman, Fahima, Korol, Nevo, Braun and Özkan2004; Wang et al., Reference Wang, Yin, Tanaka, Tanaka and Tsujimoto2011). Introgression of alien genes from wild wheat relatives into bread wheat have been reported to improve grain mineral contents (Tiwari et al., Reference Tiwari, Rawat, Neelam, Kumar, Randhawa and Dhaliwal2010; Neelam et al., Reference Neelam, Rawat, Tiwari, Kumar, Chhuneja, Singh, Randhawa and Dhaliwal2011, Reference Neelam, Rawat, Tiwari, Prasad, Tripathi, Randhawa and Dhaliwal2012; Rawat et al., Reference Rawat, Neelam, Tiwari, Randhawa, Friebe, Gill and Dhaliwal2011; Wang et al., Reference Wang, Yin, Tanaka, Tanaka and Tsujimoto2011). The utilization of these genetic stocks in breeding programmes is difficult and time-consuming; in addition, the effect of the wild introgression in grain yield of the improved germplasm is not well understood (Guttieri et al., Reference Guttieri, Baenziger, Frels, Carver, Arnall and Waters2015). On the other hand, synthetic wheat, resynthesized from the two wheat progenitor species, the tetraploid wheat, Triticum turgidum (2n = 4x = 28, AABB) and its wild diploid relative, Aegilops tauschii (2n = 2x = 14, DD), can be easily utilized in the breeding programmes by direct crossing and backcrossing to the elite germplasm of bread wheat, T. aestivum L. Synthetic hexaploids are, thus, a great genetic source of new genes for bread wheat improvement as it harbours genes for many important traits (Ogbonnaya et al., Reference Ogbonnaya, Abdalla, Mujeeb-Kazi, Kazi, Xu, Gosman, Lagudah, Bonnett, Sorrells, Tsujimoto and Janick2013). The objectives of our study were: (1) to estimate the genetic variation of Fe and Zn contents in grains of 47 synthetic wheat lines developed from crosses between the tetraploid wheat cultivar ‘Langdon’ and 47 Ae. tauschii accessions collected from different geographical locations; and (2) to identify quantitative trait loci (QTLs) associated with Fe and Zn contents. The results showed considerable genetic variation for these mineral elements. We identified three lines with high Fe and Zn contents and six QTLs in synthetic wheat lines, three each of which associated with Fe and Zn contents.
Materials and methods
Plant materials and growing conditions
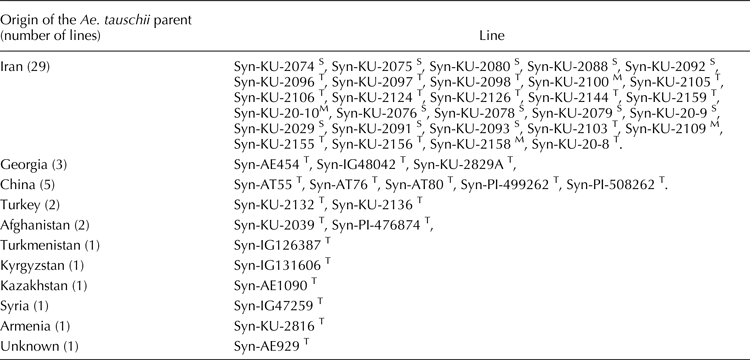
In this study, we used 47 synthetic wheat lines derived from crosses between tetraploid wheat cultivar ‘Langdon’ and 47 Ae. tauschii lines collected from different geographical areas (Table 1). These lines were produced and kindly donated by Dr. Y. Matsuoka, Fukui Prefectural University (Matsuoka and Nasuda, Reference Matsuoka and Nasuda2004; Matsuoka et al., Reference Matsuoka, Takumi and Kawahara2007). We also used four hexaploid wheat cultivars: ‘Chinese Spring’ (CS, Chinese landrace), ‘Cham 6’ (variety bred in ICARDA), ‘Norin 61’ (N61, a variety bred in Japan) and ‘Safedak Ishkashim’ (SI, Tajikistan/Afghanistan landrace) as checks. All genotypes were grown in the field of the Arid Land Research Center (Tottori, Japan; 35°32′N, 134°13′E) during the 2010/2011 and 2011/2012 wheat-growing seasons following the standard agronomic practices. At physiological maturity, we harvested the spikes of each plant separately and dried in a glass house. For grain evaluation and mineral content analysis, we pooled the seeds of the inner plants of each line and randomly took three samples.
List of the synthetic wheat lines used in the study. All lines derived from crosses between the tetraploid wheat cultivar ‘Langdon’ and different Aegilops tauschii accessions

S, Superscripts denote; T, ssp. strangulata; ssp. tauschii; M ssp. tauschii var. meyeri.
Grain evaluation and mineral content analysis
We performed mineral analysis as described by Wang et al. (Reference Wang, Yin, Tanaka, Tanaka and Tsujimoto2011). Whole grains (about 0.3 g or 10 grains) were washed in 0.1 M HCl for 3–5 s and dried to constant weight in the oven with hot air (>50°C). The grain samples were then digested in nitric acid in a glass tube at 200°C on a hot stove, and H2O2 (20 µl) was added 2–3 times during the digestion. When digestion was finished, only dry white residue remained in the tubes. This residue resolved in 10% nitric acid (v/v). Fe and Zn contents were measured in three replications by inductively coupled plasma atomic emission spectroscopy (ICP-AES; Ciros CCD, Rigaku, Japan).
Analysis of relationship between synthetic lines
The genetic relationship among the synthetic lines was assessed using 70 D-genome-specific SSR markers selected from the wheat consensus map (Somers et al., Reference Somers, Isaac and Edwards2004). We extracted genomic DNA from the leaves of three-week-old seedlings using the CTAB method. The PCR program was set at 95°C for 5 min for initial denaturation, followed by 30 s at 95°C; 30 s for primer annealing and 30 s at 72°C for an extension. A final extension was allowed for 5 min followed by a hold time at 4°C until the samples are collected. Amplified PCR fragments were separated on a 2% agarose gel stained with Gel Green (Biotium, Hayward, CA, USA). The bands were scored as 0 or 1 for the absence or presence of each allele at the SSR loci in each accession.
We also performed cluster analysis based on the contents of Fe and Zn to understand the genetic relationship in these minerals among the lines and identify the relationship between the mineral content and the geographical location.
Association mapping
We applied structured association mapping to identify the QTLs/marker loci associated with Fe and Zn contents. The genotypic data generated with 70 SSR markers used to estimate the population structure using the software structure (v 2.3.4). Population structure matrix generated, phenotypic data and genotypic data were analysed by software TASSEL (v 5.0) using General Linear Model (GLM) to identify the QTLs/marker loci associated with Fe and Zn contents in the grains of the 47 synthetic wheat lines. As these lines had the same AB genome, we were able to detect only those QTLs/markers on the D-genome.
Statistical analysis
We performed ANOVA with a statistical software STAR (2014), version 2.0.1 and compared the means by the least significant difference (LSD) test. We calculated heritability and phenotypic and genotypic variances by software PBTools (2014), version 1.4 considering the genotypes as a random effect. Correlations coefficients among the three minerals were calculated using the STAR software. The genetic relationship and cluster analysis were performed using the (hclustc) function of the R software (version 3.2.2).
Results
Genetic variation
The effect of the genotypes (G), environments (E) and their interaction (G × E) was highly significant (P < 0.001) for kernel weight (KWT) and contents of Fe and Zn (Table 2). Due to the significant G × E interaction, the results of the two seasons were discussed separately. The mineral concentration in the first season was lower than that in the second season, whereas the KWT had the opposite trend where it was higher in the first season (Table 2).
Mean, range, genotype × environment interaction analysis and broad sense heritability of the kernel weight (KWT), iron (Fe) and zinc (Zn) in 47 synthetic wheat lines grown in seasons 2010/11 and 2011/12.

ns, not significant.
*, ***Significant at 0.05 and 0.001 probability levels, respectively.
In the first season, the mean Fe concentration was 41.2 mg/kg (Table 2), with a range of 26.6 mg/kg (in Cham 6) to 57.6 mg/kg (in Syn-AE929). Six genotypes had higher Fe concentration than the average of all genotypes and the checks (Table S1). In the second season, the mean Fe concentration was greater than that in the first season (49.6 mg/kg) (Table 2); four genotypes had higher Fe concentration than the checks and the average of all genotypes. Genotypes Syn-AE929, Syn-KU-20-8, Syn-KU-2126 and Syn-KU-2144, had consistently higher Fe concentration in the two seasons (Table S1). The Zn concentration ranged from 27.0 to 65.8 mg/kg and from 25.7 to 65.8 mg/kg in the first and second seasons, respectively (Table 2). Six genotypes had higher Zn concentration than the checks and the average of all genotypes in the first season, whereas five genotypes had higher Zn concentration in the second season. Among these genotypes, Syn-AE929, Syn-KU-20-8 and Syn-KU-2144 had a consistently higher Zn concentration in the two seasons (Table S1).
The KWT ranged from 161.3 g in CS and KU-2075 to 324.7 g in Syn-KU-2105, and from 139.3 in Syn-KU-2144 to 274.0 g in Syn-KU-2076 in the first and second seasons, respectively. Eighteen synthetic wheat lines in the first season and 17 synthetic wheat lines in addition to the check cultivar SI had higher KWT (Table S1).
Synthetic wheat lines Syn-AE929, Syn-KU-20-8 and Syn-KU-2144 consistently had high Fe and Zn across the two seasons. However, they had low KWT compared with the check cultivars and some other synthetic wheat lines. This result may limit their direct utilization for breeding for high mineral content wheat.
The genotypic variance (σ 2 g), environmental variance (σ 2 e) and genotype × environment interaction variance (σ 2 g×e) were significant for all traits except for the σ 2 e of the Zn content (Table 2). The ratio of the σ 2 g to the σ 2 g×e was ≥1, and the heritability were 0.8 and 0.74 for Fe and Zn contents, indicating that breeding for increasing mineral concentration within the synthetic lines is possible. The correlation between Fe concentrations Zn concentrations and KWT concentrations in the two seasons was positive and significant (0.7***, 0.6*** and 0.5***, respectively). This finding supports the results of the heritability estimates and indicates the consistency of our mineral analysis.
Phenotypic and genotypic correlations
The phenotypic correlation considers the interaction of the genes and the environment that influence the phenotypes, whereas the genotypic correlation estimates the relationship between the genes influencing the traits irrespective to the environment.
In both seasons, the phenotypic correlation showed that Fe and Zn contents correlated negatively with the KWT (Table 3) and the correlation in Zn were higher than Fe. There was strong and positive correlation between Fe and Zn contents in both seasons, indicating that the two mineral contents could be increased simultaneously by breeding.
Phenotypic and genotypic correlation between kernel weight (KWT) and iron (Fe) and zinc (Zn) concentrations in 47 synthetic wheat lines grown in seasons 2010/11 and 2011/12.

**, ***Significant at 0.01 and 0.001 probability levels, respectively.
The genotypic correlation had the same trend as the phenotypic correlation; the KWT correlated negatively with the two minerals in the two seasons (Table 3). This result suggests that breeding for increased mineral contents in the grain will be associated with decreased KWT. The two mineral contents correlated positively indicating that improvement in the level of either mineral element will concomitantly lead to an increase in the level of the other.
Cluster analysis of mineral contents and SSR markers
To elucidate the phenotypic and genotypic factors influencing the mineral contents, we performed cluster analysis based on the data of mineral contents and SSR markers genotyping.
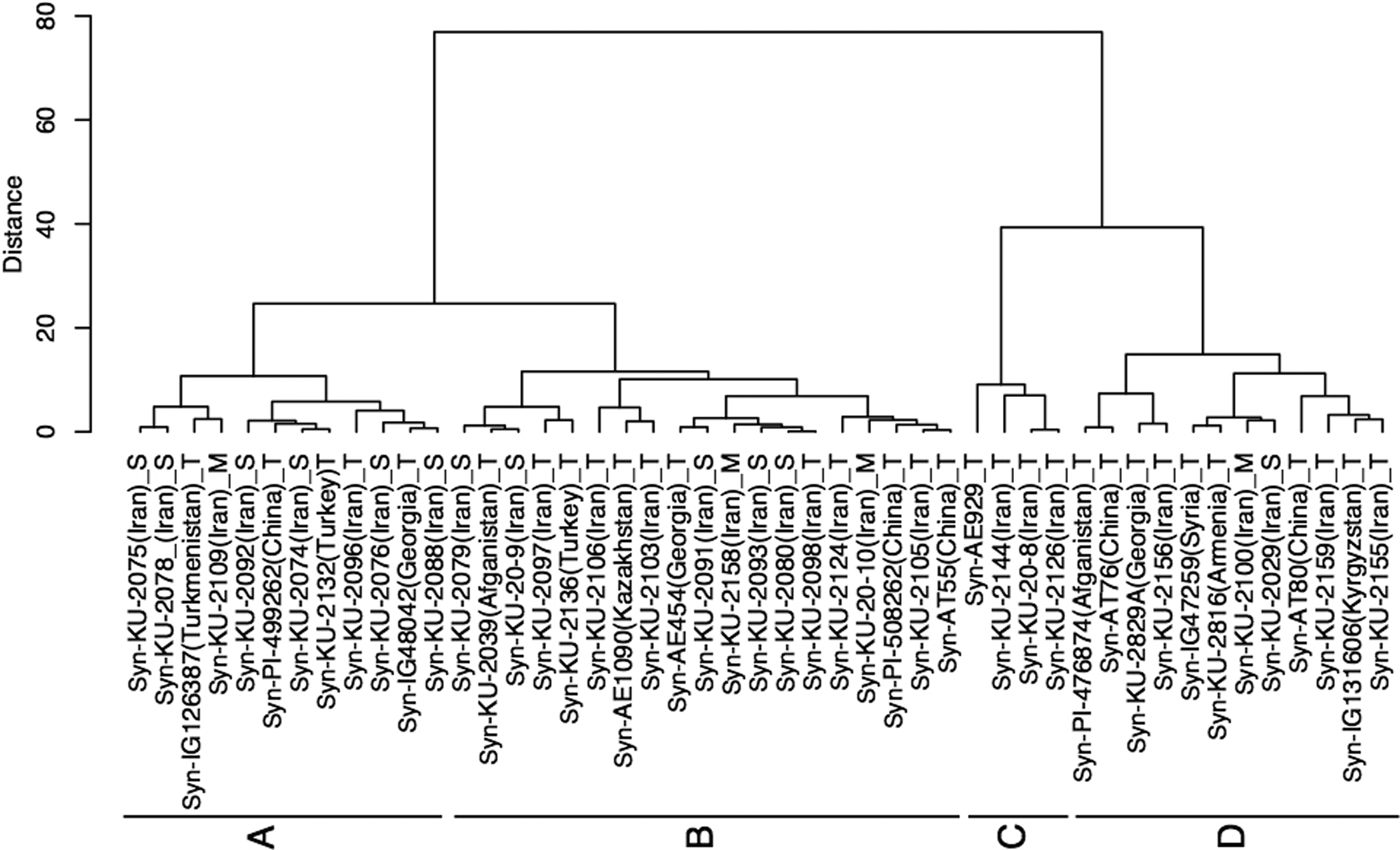
First, based on the two mineral contents, the 47 synthetic wheat lines divided into four groups or clusters including 12, 19, 4 and 12 lines, respectively (Fig. 1). The first group included lines from Georgia (one line), Turkey (one line), Iran (eight lines), China (one line) and Turkmenistan (one line). The second group included lines from Iran (13 lines), Afghanistan (one line), Kazakhstan (one line), Turkey (one line), Georgia (one line) and China (two lines). The third group included KU-20-8, KU-2126 and KU-2144 from Iran and AE929 from unknown origin. These lines are those had the highest Fe and Zn in the two seasons (Table S1). These lines belong to ssp. tauschii. The fourth group included one line from Kyrgyzstan, five lines from Iran, one line from Georgia, one line from Afghanistan, two lines from China, one line from Syria and one line from Armenia.
Clustering of the 47 synthetic lines based on their Fe and Zn contents.

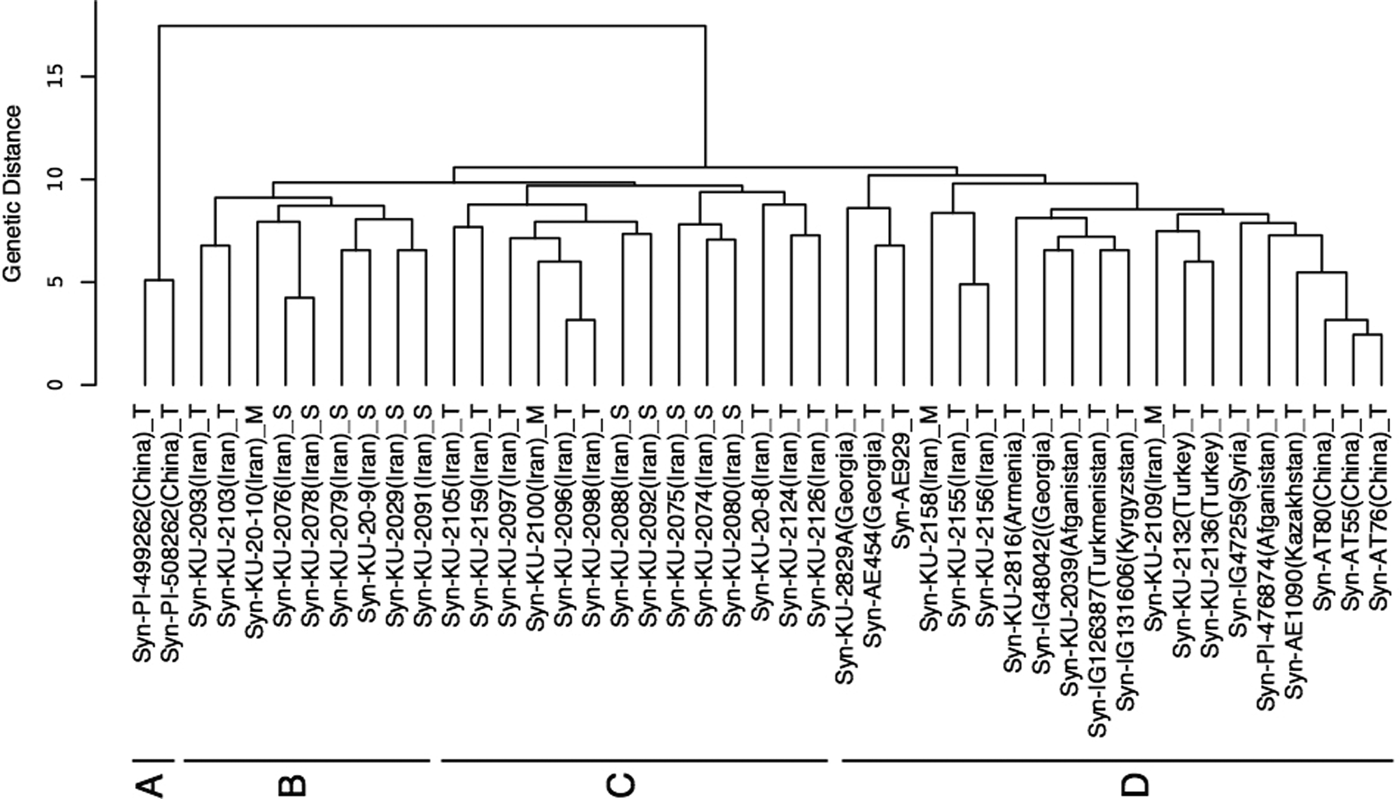
Secondly, the cluster analysis based on SSR markers partitioned the synthetic lines into four main groups (Fig. 2). The first group included two lines from China both belonging to ssp. tauschii. The second group included nine lines all of which originated from Iran. This group included six lines belonging to ssp. strangulata, two lines ssp. tasuchii and one line var. meyeri. No specific pattern of clustering of the lines was observed within this group. For example, the ssp. strangulata lines separated into different clades. The third group included 14 lines from Iran and comprised ssp. strangulata (five lines), ssp. tasuchii (eight lines) and a line from var. meyeri. The fourth group included 20 lines of diverse geographical origin, viz: Georgia (three lines), Iran (four lines), China (three lines), Afghanistan (two lines), Turkey (two lines) and with one line each from Syria, Armenia, Kyrgyzstan, Turkmenistan and Kazakhstan. The geographical origin of one of the lines included in this fourth group is yet unknown. Most of the lines in this group belong to ssp. tauschii though lines KU-2158 and KU-2109 from Iran are of the var. meyeri of the ssp. tauschii. However, these two lines separated into two different clades. Lines KU-20-8 and KU-2126 that had the highest Fe and Zn in the two seasons were both clustered in the third group.
Phylogenetic tree of the 47 synthetic lines constructed using 70 D-genome SSR markers.

QTLs/markers associated with grain Fe and Zn contents
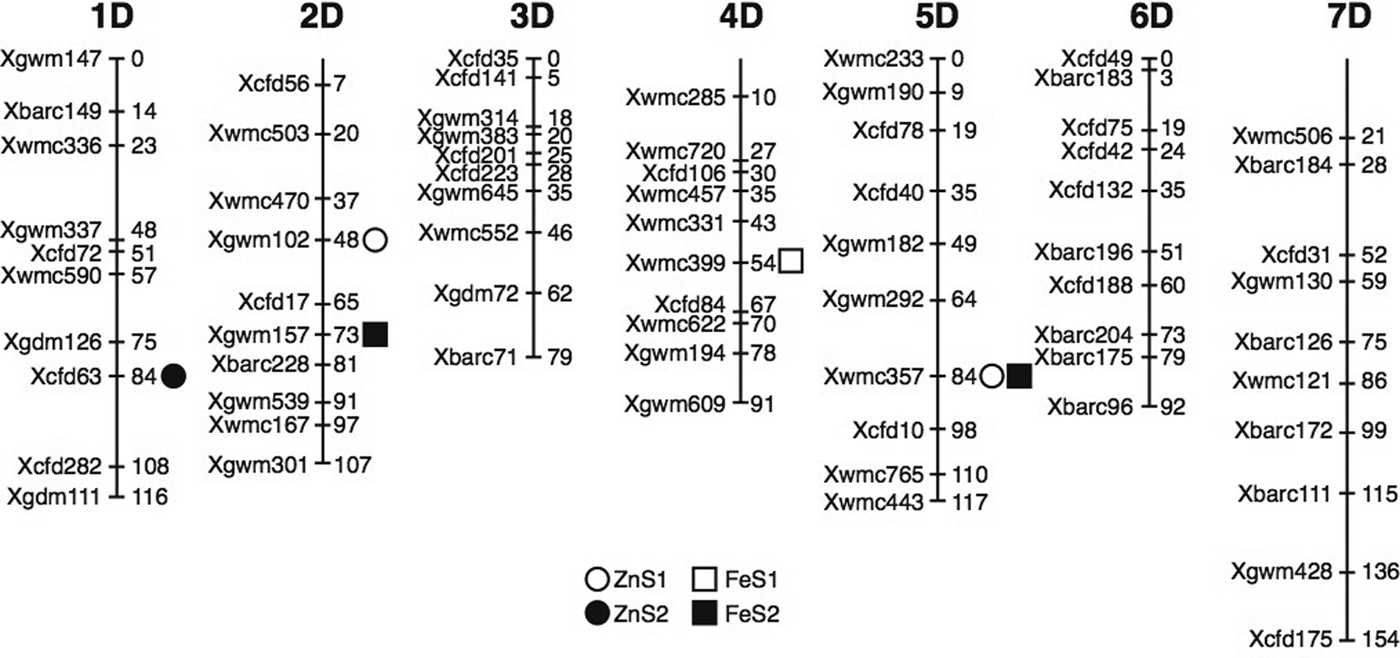
We identified six QTLs (three each in the first and second seasons) with a significant effect on grain Fe and Zn contents (Fig. 3). Fe content was significantly associated with three markers (Xgwm157, Xwmc399 and Xwmc357), one marker (Xwmc399) in the first season and two markers (Xgwm157 and Xwmc357) in the second season, whereas Zn content was significantly associated with two markers (Xgwm102 and Xwmc357) in the first season and one marker (Xcfd63) in the second season. Markers Xwmc399 on chromosome 4D in the first season and markers Xgwm157 on chromosome 2D and Xwmc357 on chromosome 5D associated with Fe content. These markers individually explained 14, 29 and 21% of the phenotypic variation observed, respectively. In the first season, markers Xgwm102 on chromosome 2D and Xwmc357 on chromosome 5D associated with Zn content, whereas in the second season only marker Xcfd63 on chromosome 1D found to be associated with the high Zn content. They explained 36, 45 and 48% of the phenotypic variation, respectively (Fig. 3).
Genetic map of SSR markers associated with grain Fe and Zn contents in different chromosomes. Chromosome number indicated above; horizontal bars represent loci with associated marker name labelled to the left. The location information of these markers downloaded from Komugi (http://www.shigen.nig.ac.jp/wheat/komugi/). S1 and S2 denote the first and second seasons, respectively.

Discussion
The reduced mineral contents in the grains of the modern wheat cultivars are a result of many factors including: (1) one-third of the world's cereal growing area is deficient in Fe, and nearly half is deficient in Zn (Cakmak Reference Cakmak2002; Peleg et al., Reference Peleg, Saranga, Yazici, Fahima, Ozturk and Cakmak2008). (2) The plant breeding process, especially after the green revolution and the selection of high-yielding wheat cultivars with reduced mineral content (dilution effect) (Murphy et al., Reference Murphy, Reevers and Jones2008; Cakmak et al., Reference Cakmak, Pfeiffer and McClafferty2010; Guttieri et al., Reference Guttieri, Baenziger, Frels, Carver, Arnall and Waters2015). Plant breeding has contributed to the current critical situation, but can still effectively ameliorate this constraint by breeding wheat cultivars with high mineral content. We observed high genetic variation for the Zn and Fe concentrations among the 47 synthetic wheat lines. The heritability for Fe and Zn contents was high in the two seasons (0.8 and 0.74, respectively). The σ 2 g to σ 2 g×e ratio was ≥1 for the two minerals indicated that they are favourable for selection, especially Fe. The G × E interactions for the grain mineral concentrations was high indicating that the selection environment would influence the success of the breeding for improved mineral content. Previous studies also reported significant G × E interactions (Peterson et al., Reference Peterson, Johnson and Mattern1986; Oury et al., Reference Oury, Leenhardt, Rémésy, Chanliaud, Duperrier, Balfourier and Charmet2006; Morgounov et al., Reference Morgounov, Gomez-Becerra, Abugalieva, Dzhunusova, Yessimbekova, Muminjanov, Zelenskiy, Ozturk and Cakmak2007, Guttieri et al., Reference Guttieri, Baenziger, Frels, Carver, Arnall and Waters2015). Peterson et al. (Reference Peterson, Johnson and Mattern1986) reported that grain Mg, P, Ca, Mn and Zn had σ 2 g to σ 2 g×e ratio <1, whereas grain S, Cl, K, Fe and Cu had σ 2 g to σ 2 g×e ratio of ≥1. Oury et al. (Reference Oury, Leenhardt, Rémésy, Chanliaud, Duperrier, Balfourier and Charmet2006) described the G × E interactions for Fe and Zn as ‘rendering selection nearly impossible.’
Fe and Zn contents were strongly correlated in the two test seasons (r = 0.75 and 0.78, respectively, Table 3). Our results are consistent with strong positive correlations of Fe and Zn (r = 0.79) in a survey of 42 winter wheat genotypes grown across central Asia (Morgounov et al., Reference Morgounov, Gomez-Becerra, Abugalieva, Dzhunusova, Yessimbekova, Muminjanov, Zelenskiy, Ozturk and Cakmak2007), and r ≥ 0.72 in Great Plains hard winter wheat (Guttieri et al., Reference Guttieri, Baenziger, Frels, Carver, Arnall and Waters2015). This strong correlation between the two minerals indicates that they can be improved simultaneously through plant breeding.
Fe and Zn contents showed negative phenotypic and genotypic correlations with KWT in the two seasons (Table 3). The correlation in the first season was weaker than the correlation in the second season. Similarly, the correlation between Fe and KWT was weaker than that between Zn and KWT. Guttieri et al. (Reference Guttieri, Baenziger, Frels, Carver, Arnall and Waters2015) reported a negative correlation between Fe and Zn in a diversity panel of Great Plains hard winter wheat. No correlation observed between grain Fe and Zn contents and KWT among Central Asian spring wheats (Morgounov et al., Reference Morgounov, Gomez-Becerra, Abugalieva, Dzhunusova, Yessimbekova, Muminjanov, Zelenskiy, Ozturk and Cakmak2007). In the health grains diversity screen, Fe and Zn were weakly but positively correlated or uncorrelated with kernel size (Zhao et al., Reference Zhao, Su, Dunham, Rakszegi, Bedo, McGrath and Shewry2009). Among Australian wheats, KWT was uncorrelated with Zn concentration (McDonald et al., Reference McDonald, Genc and Graham2008). Murphy et al. (Reference Murphy, Reevers and Jones2008) reported that Fe and Zn are the minerals most likely to increase simultaneously with yield. These contradicting results show clearly the influence of the environment on these traits and could be attributed to the differences in the germplasm used in each study and the influence of the environment.
The cluster analysis based on the two mineral contents divided the synthetic lines into four groups (Fig. 1). The three high mineral content lines originate from Iran and belong to ssp. tauschii placed in the same group (group C). The analysis did not provide clear evidence for a relation between the geographical origin and the mineral content. When we compare the mineral-based cluster and the SSR cluster, we can see some similarity especially the second group of the SSR cluster included lines almost all placed in the second group of the mineral-based cluster. This result suggests the presence of an association between some of the SSR markers and the Fe and Zn contents.
This association further supported when we applied association mapping and identified an association between some of the markers and Fe and Zn contents. We identified three marker loci associated with Zn content on chromosomes 1D, 2D and 5D. Shi et al. (Reference Shi, Li, Tong, Jing, Zhang and Zou2008) identified two QTLs associated with Zn content on chromosomes 2D and 4D and one QTL associated with Zn concentration on chromosome 4D out of 11 QTLs associated with Zn content and concentration. We identified marker loci associated with Fe content on chromosomes 2D, 4D and 5D. Roshanzamir et al. (Reference Roshanzamir, Kordenaeej and Bostani2013) identified six QTLs for grain Fe on chromosomes 2A, 3D, 4D, 7B and 7D. They identified the QTL on chromosome 4D at position 72.5 CM, but we identified the QTL on chromosome 4D at position 54 CM. Marker wmc357F on chromosome 5D was associated with Zn content in the first season and with Fe content in the second season. This may reflect the strong correlation between the two elements. The QTLs identified in this study are different from the QTLs reported previously. This finding suggests that those QTLs are new. However, we did not identify consistent markers associated with Zn and Fe across the two seasons, which could be due to the significant G × E interactions observed for these traits. Perretant et al. (Reference Perretant, Cadalen, Charmet, Sourdille, Nicolas, Boeuf, Tixier, Branlard, Bernard and Bernard2000) and Blanco et al. (Reference Blanco, Pasqualone, Troccoli, Di Fonzo and Simeone2002) reported variable responses of QTLs across environments and concluded that the data must be collected over a range of locations to identify putative QTLs.
Prospects for breeding
The genetic variation for mineral content in bread wheat is limited (Cakmak et al., Reference Cakmak, Torun, Millet, Feldman, Fahima, Korol, Nevo, Braun and Özkan2004; Wang et al., Reference Wang, Yin, Tanaka, Tanaka and Tsujimoto2011), therefore expanding the genetic variation and identification of new germplasm is necessary for breeding of wheat cultivars with high mineral content. Wheat–Aegilops chromosome addition lines showed high Fe and Zn contents in the grains (Wang et al., Reference Wang, Yin, Tanaka, Tanaka and Tsujimoto2011). Rawat et al. (Reference Rawat, Tiwari, Singh, Randhawa, Singh, Chhuneja and Dhaliwal2009) identified wild Triticum and Aegilops accessions with up to 3–4-folds higher Fe and Zn contents in their grains compared with bread and durum wheat. The traits of the identified lines introduced and expressed in bread and durum wheat (Rawat et al., Reference Rawat, Tiwari, Singh, Randhawa, Singh, Chhuneja and Dhaliwal2009, Reference Rawat, Neelam, Tiwari, Randhawa, Friebe, Gill and Dhaliwal2011; Tiwari et al., Reference Tiwari, Rawat, Neelam, Kumar, Randhawa and Dhaliwal2010; Neelam et al., Reference Neelam, Rawat, Tiwari, Kumar, Chhuneja, Singh, Randhawa and Dhaliwal2011). However, utilization of these amphipolids for improvement of grain mineral content in the cultivated wheat is difficult, time-consuming and need special cytological tools and skills. Also, the effect of the wild introgression in grain yield of the improved germplasm is not well-understood (Guttieri et al., Reference Guttieri, Baenziger, Frels, Carver, Arnall and Waters2015).
The Fe and Zn contents in the synthetic lines investigated ranged from 22.2 to 78.5 and 20.6 to 65.8 mg/kg, respectively (Table 2). This range is higher than those reported by Morgounov et al., Reference Morgounov, Gomez-Becerra, Abugalieva, Dzhunusova, Yessimbekova, Muminjanov, Zelenskiy, Ozturk and Cakmak2007) in common wheat grown in Central Asia (25–56 and 20–39 mg/kg, respectively), Murphy et al., Reference Murphy, Reevers and Jones2008) in historical and modern spring wheat cultivars (29.1–52.2 and 24–43 mg/kg, respectively), Guttieri et al. (Reference Guttieri, Baenziger, Frels, Carver, Arnall and Waters2015) in current and historical Great Plains hard winter wheat germplasm (19.8–59.9 and 18.9–56.1 mg/kg, respectively). On the other hand, this range was lower than that found by Wang et al. (Reference Wang, Yin, Tanaka, Tanaka and Tsujimoto2011) in wheat–Aegilops chromosome addition lines (17.6–71.9 and 13.1–71.3 mg/kg, respectively). This finding suggests that the synthetic lines investigated in this study are valuable genetic resources to improve wheat mineral content. Moreover, the desirable genes in the synthetic wheat can be easily transferred to the cultivated wheat by crossing and backcrossing. Therefore, synthetic hexaploids are more practicable for wheat improvement with features that are more attractive for wheat breeders.
Ogbonnaya et al. (Reference Ogbonnaya, Abdalla, Mujeeb-Kazi, Kazi, Xu, Gosman, Lagudah, Bonnett, Sorrells, Tsujimoto and Janick2013) stated that the desired traits of synthetic lines might not always appear in the synthetic derivatives produced by backcrosses with elite wheat cultivars because the genetic backgrounds of synthetic lines are largely different from that of elite cultivars. Therefore, he recommended the evaluation of the genes of Ae. tauschii in the genetic background of elite wheat cultivars by developing populations including a large diversity of Ae. tauschii in the genetic background of the elite cultivars. Interestingly, multiple synthetic derivatives population (MSD) proposed by Tsujimoto (Reference Tsujimoto2010) have been recently created by backcrossing an elite Japanese cultivar Norin 61 and 43 synthetic lines (Tsujimoto et al., Reference Tsujimoto, Sohail, Matsuoka, Ogihara, Takumi and Handa2015). The 43 synthetic lines used for the creating of the MSD population are among the 47 lines studied here. This MSD population can serve as a valuable resource for selection of superior genotypes with high mineral contents.
In conclusion, our study showed substantial genetic variability for grain Fe and Zn in synthetic hexaploid wheat. Three lines (Syn-AE929, Syn-KU-20-8 and Syn-KU-2144) showed consistent and stable high mineral contents across the seasons. Some other lines showed a high content of one of the two minerals investigated. Some synthetic lines showed high Fe or Zn coupled with high KWT. The synthetic lines identified in this study could serve as a valuable source of germplasm for enhancing grain Fe and Zn contents in the cultivated wheat.
Supplementary material
The supplementary material for this article can be found at http://dx.doi.org/10.1017/S1479262116000265.
Acknowledgements
This work partly supported by SATRPES-Afghanistan from JICA and JST, Grant-in-Aid (KAKENHI) from Japan Society for the Promotion of Science, Japan, and MRA Project from Ministry of Education, Culture, Sports, Science and Technology. We thank Professor Benjamin Ubi, Ebonyi State University, Nigeria, for reading and editing the manuscript.