Introduction
Deception Island, one of the few active volcanoes in Antarctica, is located in Bransfield Strait between the South Shetland Islands and the Antarctic Peninsula (Fig. 1). The backarc Bransfield Basin is underlain by continental crust (Grad et al. Reference Grad, Guterch and Janik1993, Reference Grad, Shiobara, Janik, Guterch and Shimamura1997, Christeson et al. Reference Christeson, Barker, Austin and Dalziel2003) and is extending in a NW–SE direction as a result either of slowly continuing subduction and/or rollback of the Phoenix Plate beneath the South Shetland island arc or of simple shear between the Scotia and Antarctic plates (Lawver et al. Reference Lawver, Sloan, Barker, Ghidella, Von Herzen, Keller, Klinkhammer and Chin1996, Barker & Austin Reference Barker and Austin1998, González-Casado et al. Reference González-Casado, Giner-Robles and López-Martínez2000, Robertson Maurice et al. Reference Robertson Maurice, Wiens, Shore, Vera and Dorman2003, Maestro et al. Reference Maestro, Somoza, Rey, Martínez-Frías and López-Martínez2007). The horseshoe-shaped island is the emerged top of a submerged shield volcano that is ~30 km in basal diameter and up to 1500 m in height above the surrounding seafloor. Most of the historical volcanic activity at Deception Island, including at least eight eruptions since 1838, has occurred around the < 170 m deep, ~6 km diameter flooded caldera bay called Port Foster (Smellie et al. Reference Smellie, López-Martínez, Headland, Hernández Cifuentes, Maestro, Millar, Rey, Serrano, Somoza and Thomson2002). Although Deception Island is heavily studied and visited (Smellie Reference Smellie, Smellie and López-Martínez2002), its tectonic development is poorly understood.
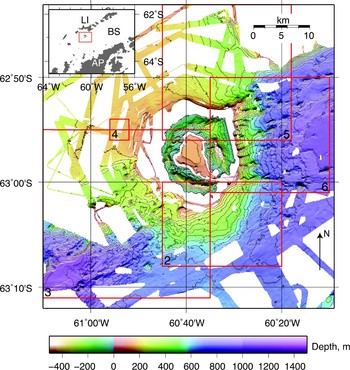
Multibeam bathymetry in the vicinity of Deception Island showing data from this study and the Antarctic Multibeam Bathymetry Synthesis (http://www.marine-geo.org/antarctic). The numbered red boxes show the areas of Figs 2–6. Illumination is from the south and the contour interval is 50 m. The inset map shows the location of the main figure (red box) in relation to Bransfield Strait (BS), Livingston Island (LI) and the Antarctic Peninsula (AP). Other labels are: PF = Port Foster, SR = Sail Rock, CBB = Central Bransfield Basin, WBB = Western Bransfield Basin.

Deception Island lies between the Central and Western Bransfield sub-basins (CBB and WBB). The CBB, which has been extensively studied, has a crustal thickness of at least 9 km (Grad et al. Reference Grad, Shiobara, Janik, Guterch and Shimamura1997, Christeson et al. Reference Christeson, Barker, Austin and Dalziel2003) and although it has a broad axial zone of recently or currently active seamounts and volcanic ridges (Lawver et al. Reference Lawver, Sloan, Barker, Ghidella, Von Herzen, Keller, Klinkhammer and Chin1996, Gràcia et al. Reference Gràcia, Canals, Farràn, Sorribas and Pallàs1997), does not show evidence for organized oceanic spreading. Its north-western South Shetland Islands margin comprises a narrow fault zone and a well-defined bathymetric slope whereas the Antarctica Peninsula margin is a gentler slope of broader, distributed extension (Barker & Austin Reference Barker and Austin1998). The CBB deepens along-axis toward the north-east, primarily as a series of bathymetric steps that are spatially associated with major volcanic constructions within the basin (Gràcia et al. Reference Gràcia, Canals, Farràn, Sorribas and Pallàs1997). Other NW–SE-trending structures have been identified in the CBB, primarily from seismic data, including normal faults that cross the entire basin (Barker & Austin Reference Barker and Austin1998, Christeson et al. Reference Christeson, Barker, Austin and Dalziel2003), offsets in the volcanic axis (Grad et al. Reference Grad, Shiobara, Janik, Guterch and Shimamura1997) and similarly-oriented structures postulated on the South Shetland Islands (Birkenmajer Reference Birkenmajer, Yoshida, Kaminuma and Shiraishi1992). The along-axis bathymetric deepening, basin morphology, form of volcanic extrusion and progressive crustal thinning have been attributed to rift propagation from north-east to south-west along the basin axis (Barker & Austin Reference Barker and Austin1998, Barker et al. Reference Barker, Christeson, Austin and Dalziel2003, Christeson et al. Reference Christeson, Barker, Austin and Dalziel2003).
The WBB is less well studied than the CBB. It is the shallowest basin of the three, and shows evidence for tectonic extension, but no known magmatism (Barker et al. Reference Barker, Christeson, Austin and Dalziel2003) except for a large submarine centre south-west of Deception Island exposed at Sail Rock, which might have been active in recent centuries (Fretzdorff & Smellie Reference Fretzdorff and Smellie2002). Ice flow has also modified the bathymetry of the CBB and WBB, with major erosional and depositional features (bundle structures) associated with past flow from the Antarctic Peninsula during the Last Glacial Maximum identified in the WBB (Canals et al. Reference Canals, Casamor, Urgeles, Calafat, Domack, Baraza, Farran and De Batist2002) and along the south-east margin of the CBB (Canals et al. Reference Canals, Urgeles and Calafat2000). The grounding line in the CBB during the last glacial maximum has been estimated at 400 m (Banfield & Anderson Reference Banfield and Anderson1995).
Deception Island was originally interpreted as a classic eruptive collapse caldera based on the distribution of post-caldera vents along arcuate lines, believed to be faults (Baker et al. Reference Baker, McReath, Harvey, Roobol and Davies1975). Owing to the absence of exposed ring or radial faults or dikes and the lack of a lithostratigraphic unit that could be associated with a formative eruption, Martí (1996) proposed an alternative model in which a central depression defined by a set of linear faults forms as a result of extension in multiple directions. More recently Smellie (Reference Smellie2001, Reference Smellie, Smellie and López-Martínez2002) has reinterpreted the lithostratigraphy in favour of the eruptive model.
Although the dominant fault orientation is approximately NE–SW and is parallel to the trend of Bransfield Strait, up to five other orientations have been identified from fault populations and other geophysical and geological lineations on the island and within Port Foster (Rey et al. Reference Rey, Somoza and Martínez-Frías1995, Reference Rey, Somoza, Martínez-Frías, Benito, Martín-Alfageme, Nicholson, Hein, Bühn and Dasgupta1997, Reference Rey, Maestro, Somoza, Smellie, Smellie and López-Martínez2002, Martí et al. Reference Martí, Vila, Rey, Mcguire, Jones and Neuberg1996, Muñoz-Martín et al. Reference Muñoz-Martín, Catalán, Martín-Dávila and Carbó2005, Paredes et al. Reference Paredes, Pérez-López, Giner-Robles, de la Vega, García-García and Gumiel2006, Maestro et al. Reference Maestro, Somoza, Rey, Martínez-Frías and López-Martínez2007, Pérez-López et al. Reference Pérez-López, Giner-Robles, Martínez-Díaz, Rodríguez-Pascua, Bejar, Paredes, González-Casado and Cooper2007). Rey et al. (Reference Rey, Somoza and Martínez-Frías1995, Reference Rey, Somoza, Martínez-Frías, Benito, Martín-Alfageme, Nicholson, Hein, Bühn and Dasgupta1997, Reference Rey, Maestro, Somoza, Smellie, Smellie and López-Martínez2002) argue that extensional strain on Deception Island is the result of a pair of right- and left-lateral strike-slip faults associated with the complex tectonics at the intersection of the Bransfield rift and the extension of the Hero fracture zone from the former Phoenix Plate to the north. Maestro et al. (Reference Maestro, Somoza, Rey, Martínez-Frías and López-Martínez2007) interpreted palaeostress determinations on the island in terms of a complex Riedel shear model in response to oblique convergence between the Antarctic and Pacific plates. Alternatively, Pérez-López et al. (Reference Pérez-López, Giner-Robles, Martínez-Díaz, Rodríguez-Pascua, Bejar, Paredes, González-Casado and Cooper2007) used structural and fractal analyses to determine stress and strain fields that are similar to other studies but interpreted them in terms of NW–SE extensional strain with a left lateral component associated with rifting of Bransfield Strait and a secondary uniaxial extension in an orthogonal direction related to caldera collapse.
Most of the work at Deception Island is based on observations from the island itself or within Port Foster. However, the combined area of the bay and island comprises about 20% of the volcano's entire surface, and the two-fifths of the island that is not ice-covered is heavily sedimented with poor exposure. At the same time, owing to the volcanic activity at Deception Island, it is difficult to separate the effects of regional stresses from local volcanic deformation. Any tectonic models for Deception Island volcano in a regional context must therefore include its submerged flanks and surrounding seafloor. Except for gravity and magnetic studies (Navarro et al. Reference Navarro, Vélez, Camacho, Vieira, Gamble, Skinner and Henrys2002, Muñoz-Martín et al. Reference Muñoz-Martín, Catalán, Martín-Dávila and Carbó2005) and some seismic reflection and refraction lines (Grad et al. Reference Grad, Guterch and Środa1992, Barker & Austin Reference Barker and Austin1998), little work has been done around Deception Island.
Multibeam bathymetry studies are an essential tool for understanding volcanic and tectonic processes in submarine settings, particularly in extensional environments where the ongoing development of such features outpaces the blanketing effects of sedimentation. The availability of the first academic multibeam mapping tools in the 1980s led to an era of extensive exploration of the global mid-ocean ridge systems and has facilitated investigations of the nature of crustal accretion and deformation, and of volcanic segmentation (Macdonald et al. Reference Macdonald, Fox, Perram, Eisen, Haymon, Miller, Carbotte, Cormier and Shor1988, Sempere et al. Reference Sempere, Purdy and Schouten1990). Multibeam maps have also played a critical role in studies to investigate the transition from continental rifting to seafloor spreading in backarc basins (Taylor et al. Reference Taylor, Goodliffe, Martinez and Hey1995). Within Bransfield Strait, the mapping of the CBB to the east of Deception Island (Lawver et al. Reference Lawver, Sloan, Barker, Ghidella, Von Herzen, Keller, Klinkhammer and Chin1996) showed that extension was distributed across the basin with volcanic activity concentrated along at least four nearly parallel zones of linear intrusions that were interpreted as extensional ‘cracks’ leaking basalt onto the seafloor.
With the exception of the Lawver et al. (Reference Lawver, Sloan, Barker, Ghidella, Von Herzen, Keller, Klinkhammer and Chin1996) data and some widely-spaced tracks collected during seismic profiling, there are no published high-resolution bathymetry data from the vicinity of Deception Island. In this paper, we present recently collected swath data for the seas within and around Deception Island. We use these data to assess the effects of ongoing volcanic activity in the caldera and to evaluate recent models for the tectonic evolution of the island.
Data collection and analysis
The multibeam bathymetry data were collected during January 2005 around Deception Island and within Port Foster along transits between ocean-bottom seismometer drop locations and along the seismic airgun shot lines of the TOMODEC seismic tomography experiment (Zandomeneghi et al. Reference Zandomeneghi, Barclay, Almendros, Ibáñez, Ben-Zvi, Wilcock and Cooper2007). Most of the ~800 km of non-repeated tracks formed six concentric rings that were located between 1 km and 18 km from the coast of Deception Island and a grid with 500 m spacing within Port Foster (Fig. 1). Swath coverage was complete within Port Foster and outside the island except for the shallow near-shore regions and between the outermost lines. Although the survey design was secondary to the seismic experiment, the data are of high quality owing to the ship's speed of < 6 knots during most of the seismic shooting. The dataset was supplemented with lower-resolution swath bathymetry data from the Marine Geoscience Data System (http://www.marine-geo.org), including the NBP9507 survey of the Central Bransfield Basin that overlapped our data to the north-east (Lawver et al. Reference Lawver, Sloan, Barker, Ghidella, Von Herzen, Keller, Klinkhammer and Chin1996).
The multibeam bathymetry data were collected using the Kongsberg-Simrad EM120 and EM1002 systems on the RV Hespérides. Both systems collect 150-degree-wide swaths; the EM120 system (which uses 191 beams at 13 kHz) is used for depths greater than 700 m while the EM1002 (111 beams at 95 kHz) has higher resolution and is used for depths shallower than 700 m. The data were processed using the CARIS HIPS software package. Tracks that had poor navigation, tight turns, and duplicate tracks were removed, and tidal corrections were applied using the United Kingdom Hydrographic Office Easytide predictions for Deception Island (http://easytide.ukho.gov.uk). A secondary roll-bias correction of -0.13° was determined for the EM1002 data using the overlapping swaths that were collected along opposite headings within the flat northern subbasin of Port Foster. There was insufficient swath overlap to allow verification of the roll bias correction in the EM120 data.
Initial sound speed corrections were applied using an expendable bathythermograph profile that was collected ~10 km to the east of Deception Island. No sound speed profiles were collected within Port Foster, however, and there was poor depth agreement between overlapping outer beams (< 2 m in a water depth of 160 m and a cross-track distance from nadir of 400 m) within the northern subbasin of Port Foster. We attributed this to a difference in the sound velocity profile between Bransfield Strait and Port Foster, where the semi-enclosed bay has a strong seasonal temperature variation (Sturz et al. Reference Sturz, Gray, Dykes, King and Radtke2003). The Port Foster swaths were then corrected using a sound speed profile that was derived from February 2000 salinity and temperature measurements (Sturz et al. Reference Sturz, Gray, Dykes, King and Radtke2003) but because this did not significantly reduce the overlap misfit, we instead removed the outermost beams having > 320 m offset and applied an empirical correction to the sound-speed profile (a reduction of 30 m s-1 at 50 m depth) that reduced the maximum overlap misfit to ~50 cm. Although this value is similar to the ~40 cm precision of the EM1002 system, the absence of a measured sound speed profile means that absolute depths we obtain within the caldera may be systematically in error by up to 2 m.
The data were beam-edited using a combination of manual and automatic despiking and filtering, and were gridded and merged. We created a 5 m weighted grid for the EM1002 data, 10 m for the combined EM1002 and EM120 data, and 50 m for the grids that included data from the Antarctic multibeam bathymetry database. Sidescan data were also collected and processed, but showed few features owing to considerable beam noise and a largely sedimented bottom.
The seafloor around Deception Island
The submerged flanks of Deception Island volcano do not form a simple radially symmetric edifice, and instead can be classified into several sectors that have different characteristics and are associated with different regional tectonic structures (Fig. 1). The seafloor within the north/north-western sector is shallow (< 200 m), relatively smooth, featureless, and with low gradients, corresponding to the unextended continental crust of the South Shetland block that underlies Livingston Island. Elsewhere the island is surrounded by a shallow (< 200 m) shelf that varies in width from 1–5 km. Multibeam coverage of this shelf is poor, but in most places coverage improves as the seafloor deepens sharply outward from the shelf edge. The eastern flank slopes steeply into the CBB, reaching 800 m depth at ~8 km from the outer eastern coast of the island. The seafloor here includes scarps, ridges, gullies and seamounts, many of which are oriented NE–SW and parallel to the trend of the Bransfield Basin. The southern flank, which is more regular and devoid of any large features, deepens to an apparent saddle at ~600 m depth that separates the CBB and WBB. If the base of the edifice is defined by the 600 m contour within this quadrant, then the radius of the volcano from the centre of the island is ~15 km. A fourth sector lies between the western coast of Deception Island and the WBB. This region is characterized by a shallow platform or ridge that extends 20 km out from the island's western coast to Sail Rock, and then deepens into the WBB. In the following description, we describe the features of each of the sectors in a clockwise direction beginning at the south of Deception Island.
South of Deception Island
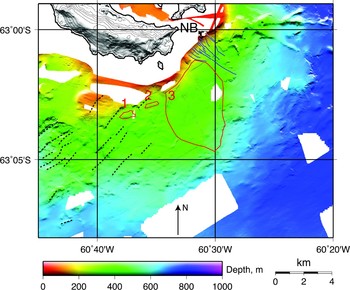
The bathymetry of the southern flank (Fig. 2) is relatively regular and many of its features are consistent with sediment deposition and transport over the slopes of the original, possibly radially-symmetric, shield volcano that are probably composed of pillow lavas and hyaloclastic breccias (Smellie et al. Reference Smellie, López-Martínez, Headland, Hernández Cifuentes, Maestro, Millar, Rey, Serrano, Somoza and Thomson2002). In this region, the coastal shelf varies in width from 2–5 km. From the shelf edge the seafloor deepens sharply and away from the island to 250 m depth, less steeply to the base of the volcanic edifice at 600 m depth, and then gently into the CBB and WBB at 750 m depth. Most of the volcano's flank is characterized by undulations that extend south-eastward across the slope up to 13 km from the coast. We interpret these features as slump deposits. The shelf is especially narrow near Neptunes Bellows, the entrance to Port Foster, where a drainage system of small gullies coalesces into two major channels that can be traced to at least 500 m depth. We attribute this system to turbidity, or density, flows that are probably caused by a high sediment flux being flushed from Port Foster. The axes of many of these gullies and channels are noticeably terraced with step heights of < 10 m which is probably the result of channels cutting through layered volcanic sequences with differing erodablity.
Bathymetry to the south of Deception Island. Broken black and solid blue lines are lineations (small scarps and ridges) and the Neptunes Bellows (NB) drainage system, respectively. The two small red regions are below scarps (labelled 1 and 2) mentioned in the text. The larger red-bounded region (labelled 3) is the area interpreted to have had no recent slumping. Illumination is from the north.

The shape of the shelf to the south/south-west of Deception Island appears to be controlled by a system of faults. The seafloor in this region has a strong NE–SW fabric that is caused by small (10–40 m high) SE-facing scarps. Many of these lineations can be traced for > 2 km and have a mean orientation of 042°. Although there are many slump scars on this slope, we attribute the scarps to normal faulting associated with the regional NW–SE extension because of their linearity and oblique orientation that cuts across the slope. In two places (1 and 2 in Fig. 2) the shelf boundary is defined by steep en echelon scarps that are colinear with these lineations and are likely to be fault planes. These scarps have slump deposits at their base and slump-related undulations that continue downslope. By contrast, the shelf edge immediately to the north-east, which shows neither scarp nor downslope undulations (region 3 in Fig. 2), either slumped much earlier, or not at all.
South-west and west of Deception Island
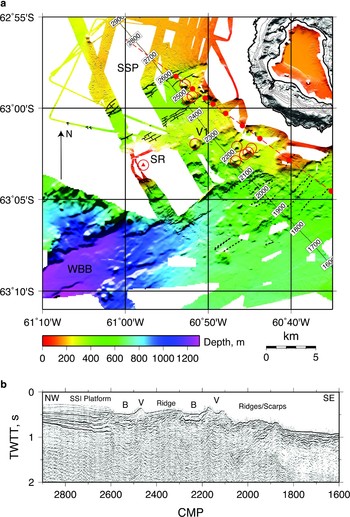
The bathymetry to the west and south-west of Deception Island is shown in Fig. 3. In addition to the radial deepening away from Deception Island, the seafloor also deepens in a south-east direction from the 200 m deep South Shetland platform toward the north-eastern end of the WBB at > 700 m depth. A NW–SE seismic reflection profile (Fig. 3b) from the EW9101 survey (Barker & Austin Reference Barker and Austin1998) follows this slope, and is approximately parallel to a magnetic/gravity profile closer to the island (Muñoz-Martín et al. Reference Muñoz-Martín, Catalán, Martín-Dávila and Carbó2005). Bathymetry, seismic profiles, gravity and magnetics can be used to give a combined interpretation of the structure from north-west to south-east.
a. Bathymetry to the south-west/west of Deception Island. Open red circles indicate volcanoes including Sail Rock which is shown by a red triangle; the broken yellow line shows an inferred volcanic ridge. Broken black lines show lineations and solid black lines show clearly-identifiable fault scarps, with ticks on the downthrow sides. The thin broken red line is the location of the gravity/magnetic profile 49 of Muñoz-Martín et al. (Reference Muñoz-Martín, Catalán, Martín-Dávila and Carbó2005); red circles along the line are their modelled locations of shallow volcanic bodies. Labels are as follows: SR = Sail Rock, SSP = South Shetland Platform, WBB = Western Bransfield Basin, V1 = volcano along south-central margin of SR-DI ridge. Illumination is from the north and the contour interval for Deception Island is 50 m. b. Part of migrated seismic reflection section AP-14 from the EW9101 cruise (Barker & Austin Reference Barker and Austin1998) located along the numbered profile in (a). B = basin, V = volcano.

The shallow seafloor and thick flat-lying sediments of the South Shetland Islands platform are bounded by a closely-spaced series of SE-facing fault scarps, with an average strike of 061° and a total vertical offset of ~100 m, that appears to be colinear with the northern margin of the CBB and can be traced out to the westernmost swaths at 18 km from the coast of Deception Island. To the south-east of the fault zone is a 4 km wide and 400 m deep, flat-bottomed basin. This basin is bounded to the south-east by a series of small (1–3 m) scarps also with average strike of 061° that dip to the south-east and not the north-west as would be expected in symmetrical graben. The north-east margin of the basin is formed by three small volcanoes while the south-west margin is not imaged by our data. Many of these scarps can be traced continuously for 4 km or more. The basin abuts a broad ridge, 4 km wide and 100 m high with respect to the adjacent seafloor, that connects Sail Rock and Deception Island. Sail Rock is a 30 m high sea stack that is andesitic and has a similar, but not identical composition to some of the dacites found on Deception Island (Keller et al. Reference Keller, Fisk, White and Birkenmajer1991). Although sparse, the swath coverage around Sail Rock suggests a conical edifice with a basal diameter of 5 km and height > 300 m above the surrounding seafloor. To the south-east of the ridge, the seafloor deepens into the WBB along a relatively steep slope that includes probable volcanoes, a volcanic ridge, faults and lineations (Fig. 3a).
Explanations for the ridge include a rotated fault block or a volcanic construction. The top of the ridge is at 300 m depth and is relatively smooth and flat but extensively ice-scoured. The ridge shows no evidence on its surface for either faulting or volcanism except for a probable seamount at its south-central margin (V1 in Fig. 3), and a series of scarps along its north-western margin. The seismic reflection profile (Fig. 3b) appears to show the ridge as a chaotic reflection structure overlain by a thin layer of flat-lying reflectors that dips toward the north-west, and is bounded to the north-west by a volcano and to the south-east by a SE-dipping fault and a small basin. The model of a rotated fault block is supported by the dip of the surficial reflectors, and inferred fault to its south-east, and the observation that the faults to the north-west of the ridge dip toward the south-east. However, the location and orientation of the ridge along the axis between Deception Island and Sail Rock, as well as the deeper reflection structure beneath the ridge, indicate that the feature is a volcanic ridge, now thinly sediment-covered. In addition, seismic tomography results do not indicate the presence beneath the ridge of the high seismic velocities that are characteristic of the South Shetland Islands platform (Zandomeneghi et al. Reference Zandomeneghi, Barclay, Almendros, Ibáñez, Ben-Zvi, Wilcock and Cooper2007). These two explanations are not mutually exclusive, however and it is possible that the ridge was originally formed volcanically either by linear eruptions and/or supply of volcanic material from Deception Island and Sail Rock, followed by block rotation between bounding faults along its north-west and south-east margins.
All of the known seafloor volcanic features in Fig. 3 are located in a NE–SW oriented band that is similar in width to Deception Island. In addition to the known centre at Sail Rock, we have identified one > 3 km-long volcanic ridge and nine volcanoes, eight of which are situated on the 300 m deep pedestal and within 7 km of the island's coast. Two groups of two and four volcanoes are aligned at ~051°, while the ridge, which extends into the WBB, is oriented at 044°. Magnetic and gravity modelling along a NW–SE profile within this region by Muñoz-Martín et al. (Reference Muñoz-Martín, Catalán, Martín-Dávila and Carbó2005) indicates the presence of additional shallow volcanic bodies, and suggests that many of the seafloor features in this region are caused by intrusive and/or extrusive volcanism.
North-west and north of Deception Island
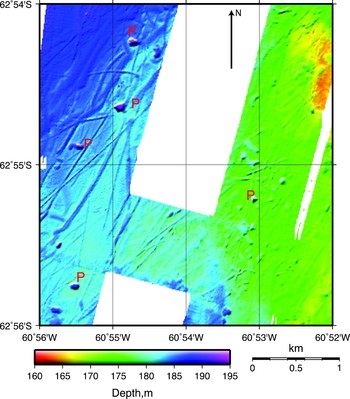
The crust to the north-west of Deception Island has high seismic velocity and density and is interpreted as the South Shetland platform (Grad et al. Reference Grad, Guterch and Środa1992, Muñoz-Martín et al. Reference Muñoz-Martín, Catalán, Martín-Dávila and Carbó2005, Ben-Zvi et al. Reference Ben-Zvi, Wilcock, Barclay, Zandomeneghi, Ibáñez, Almendros and Cooper2007, Zandomeneghi et al. Reference Zandomeneghi, Barclay, Almendros, Ibáñez, Ben-Zvi, Wilcock and Cooper2007). The seafloor is shallow and relatively featureless, except for extensive iceberg scouring (Fig. 4). The most extensive gouge features are furrows that are < 2 m deep, and approximately 10 m wide. The longest furrow is greater than 8 km long, although measurements of maximum length are limited by the gaps in swath coverage. Furrow cross-sections are mostly simple troughs, although in some cases the furrow is bounded on the upslope side by a ridge that is probably a gouge deposit. The high density of seafloor scour features suggests that across much of this area the top ~2 m of the seafloor sediments are extensively reworked ice-keel turbates (Barnes & Lien Reference Barnes and Lien1988).
Typical bathymetry from the west/north-west of Deception Island, showing iceberg furrows and pits (P) that are attributed to iceberg overturn. The location of the map is shown in Fig. 1. Illumination is from the north-west.

The heavily furrowed regions are also marked by circular or elongate depressions that have a diameter of < 100 m and a maximum depth of < 15 m beneath the surrounding seafloor. These depressions cannot be unambiguously associated with any individual furrows, and are several times deeper than the maximum furrow depth. We interpret these features as the pits of overturning icebergs which probably remain grounded until they melt sufficiently to move. In deeper water, only the larger overturning icebergs will impact the seafloor and so the incidence of depressions increases and diameter decreases as the water depth shallows.
Glacial features are abundant in our data at depths shallower than ~300 m, and the deepest identifiable gouge mark is at 350 m although it is unclear whether the absence of gouge at greater depth is real or due to reduced resolution. With the exception of the Sail Rock–Deception Island ridge, there is little evidence in the bathymetry data of glacial scour elsewhere around the margin of Deception Island. This is primarily due to the relatively steep eastern and southern slopes that limit the total area of swath coverage at depths shallower than 300 m, although the local currents may also steer most icebergs around the west of Deception Island; this is supported by a decreasing incidence of gouge features from west to east along the northern coast. High rates of sedimentation and erosion near the island may also limit the preservation of glacial scour features.
The average trend of the furrows is also consistent with drift around the north-west corner of Deception Island. Although within ~7 km of the coast the gouges are short and disorganized, the more distant furrows are linear, longer and impart an overall NE-trending fabric to the seafloor. However, estimates of iceberg drift directions deduced from scour directions will be heavily biased by the bathymetry; the expected furrow direction is slope-perpendicular since icebergs travelling into or out of the slope would ground or float free before scouring extensive furrows. Explanations for the less organized gouge structures closer to Deception Island include more variable currents, steeper or more irregular seafloor slopes, and more iceberg/iceberg collisions in shallower waters.
North-east and east of Deception Island
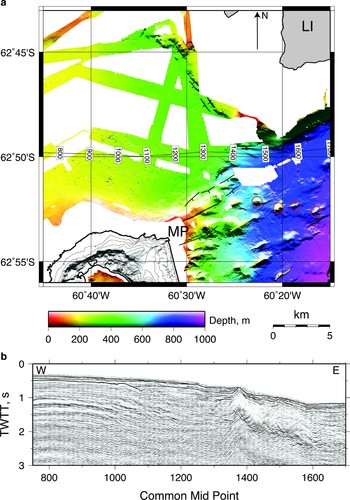
Although the South Shetland platform to the north of Deception Island is flat, shallow, and smooth everywhere within our coverage area, the seafloor north of Macaroni Point (the north-east extremity of Deception Island) deepens toward the east by 200 m over 8 km before shallowing abruptly at a > 200 m-high scarp (Fig. 5). One explanation of this feature is that the scarp and depression were eroded by an ice-stream that drained into Bransfield Strait from Livingston Island. Ice streams from the Antarctic Peninsula that have eroded > 250 m thickness of sediment have been identified elsewhere in the Bransfield Basin (Canals et al. Reference Canals, Casamor, Urgeles, Calafat, Domack, Baraza, Farran and De Batist2002). However, we think this explanation unlikely because the seafloor shows none of the drumlins, flow-parallel lineations, or depositional features that have been associated with ice sheet flow elsewhere (Canals et al. Reference Canals, Urgeles and Calafat2000, Reference Canals, Casamor, Urgeles, Calafat, Domack, Baraza, Farran and De Batist2002). Instead, we interpret this structure as a half-graben with extension in the NE–SW direction, perpendicular to the extension in Bransfield rift. Similar cross-rift extensional structures are observed elsewhere in the CBB (Gràcia et al. Reference Gràcia, Canals, Farràn, Sorribas and Pallàs1997, Barker & Austin Reference Barker and Austin1998, Christeson et al. Reference Christeson, Barker, Austin and Dalziel2003).
a. Bathymetry to the north of Macaroni Point (MP) and south of Livingston Island (LI). Fault scarps are identified as black lines with ticks on the downthrow side; volcanoes as red circles, and volcanic ridges as yellow lines. Illumination is from the north. b. Part of migrated seismic reflection section AP-15 from the EW9101 cruise (Barker & Austin Reference Barker and Austin1998) located along the numbered profile in (a).

A seismic reflection line (Fig. 5b) from the EW9101 survey (Barker & Austin Reference Barker and Austin1998) transects this feature from west to east. The profile shows a strong reflector beneath the shallow seafloor to the north/north-west of Deception Island that begins to deepen north-west of Macaroni Point where it is overlain unconformably by a thick series of relatively flat-lying reflectors that are presumably sediment fill. Close to CMP 1400 these sediments appear to lap onto and be dammed by a sharp feature that we interpret to be a volcanic intrusion or ridge but which is obscured by sediments in the bathymetry data. A similar feature has been observed in line AP4 from the same reflection survey (Barker & Austin Reference Barker and Austin1998). The break in the slope of the strong reflector (CMP 1050 in Fig. 5b) may correspond to the position of a hinge line for a NNW–SSE-oriented half-graben described above.
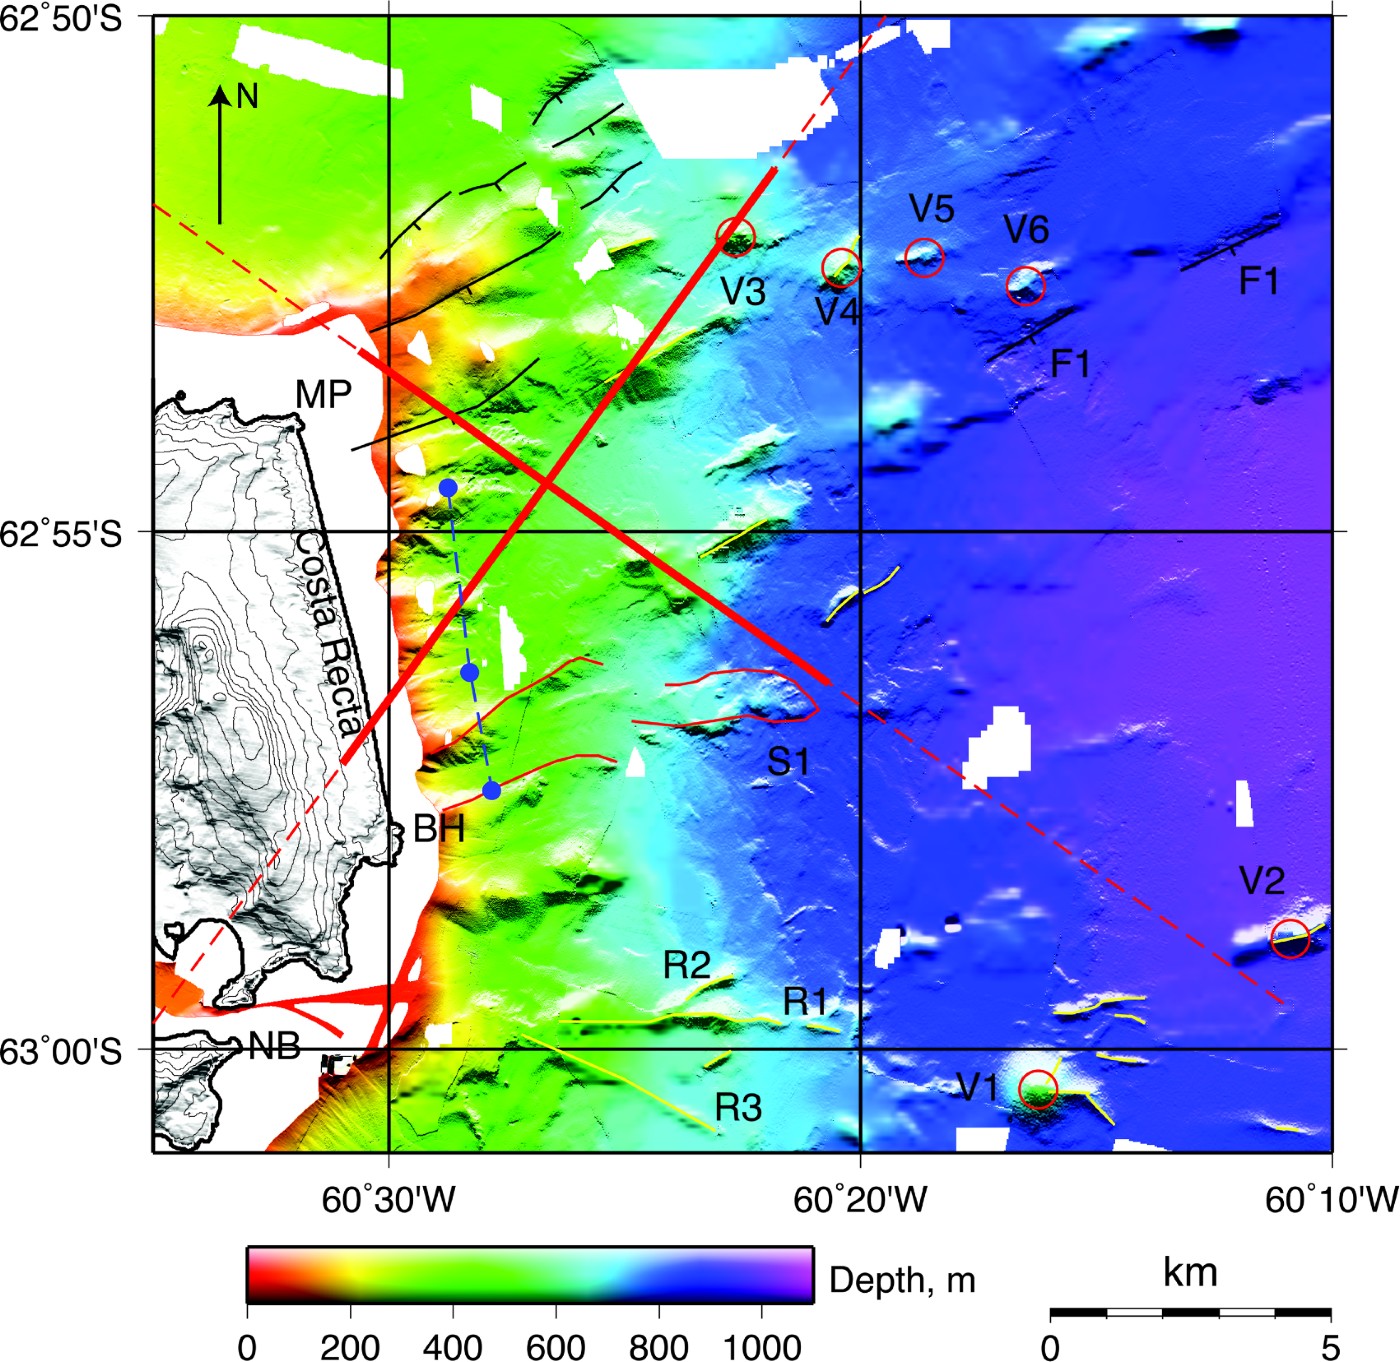
The seafloor to the east of Deception Island deepens over a distance of 10 km from the linear eastern coast (Costa Recta) to the floor of the Central Bransfield Basin at 1100 m depth (Fig. 6). The entire region is characterized by elongated seafloor structures that impart a north-easterly trend to the fabric. This direction is perpendicular to the extension of the Bransfield Rift, or parallel to the axis of the CBB and to many of the linear volcanic ridges observed within the basin farther to the north-east (Gràcia et al. Reference Gràcia, Canals, Farràn, Sorribas and Pallàs1997). The NE-trending seafloor fabric at depths shallower than 500 m is caused by a series of eight parallel ridges and valleys that have a total relief of > 100 m and a ~1 km spacing parallel to the coast. None of these features can be correlated with any of the stream systems that drain the Costa Recta coast (Fernández-Ibáñez et al. Reference Fernández-Ibáñez, Pérez-López, Martínez-Díaz, Paredes, Giner-Robles, Caselli and Ibáñez2005) or with Bailey Head and Macaroni Point that bound Costa Recta to the north and south, respectively, although direct correlation is hampered by the lack of inshore coverage. The morphology of the ridges is smooth except for slump scars that are quite common.
Bathymetry to the east of Deception Island. Fault scarps are identified as black lines with ticks on the downthrow side; volcanoes as red circles, and volcanic ridges as yellow lines. Broken red lines are locations of gravity/magnetic profiles 3 and 60 of Muñoz-Martín et al. (Reference Muñoz-Martín, Catalán, Martín-Dávila and Carbó2005) with thicker red lines showing the modelled locations of shallow volcanic bodies. The broken blue line is the position of the fault scarp inferred by Fernández-Ibáñez et al. (Reference Fernández-Ibáñez, Pérez-López, Martínez-Díaz, Paredes, Giner-Robles, Caselli and Ibáñez2005); the three blue circles are the locations of the slope maxima along their profiles 5, 4 and 2 from south to north. A clearly identifiable slump deposit and channel are outlined with a thin red line and labelled S1. Other labels are as follows: MP = Macaroni Point, BH = Bailey Head, NB = Neptunes Bellows, V1–V6, R1-3 and F1 are volcanic features, ridges and faults referred to in text. Illumination is from the north.
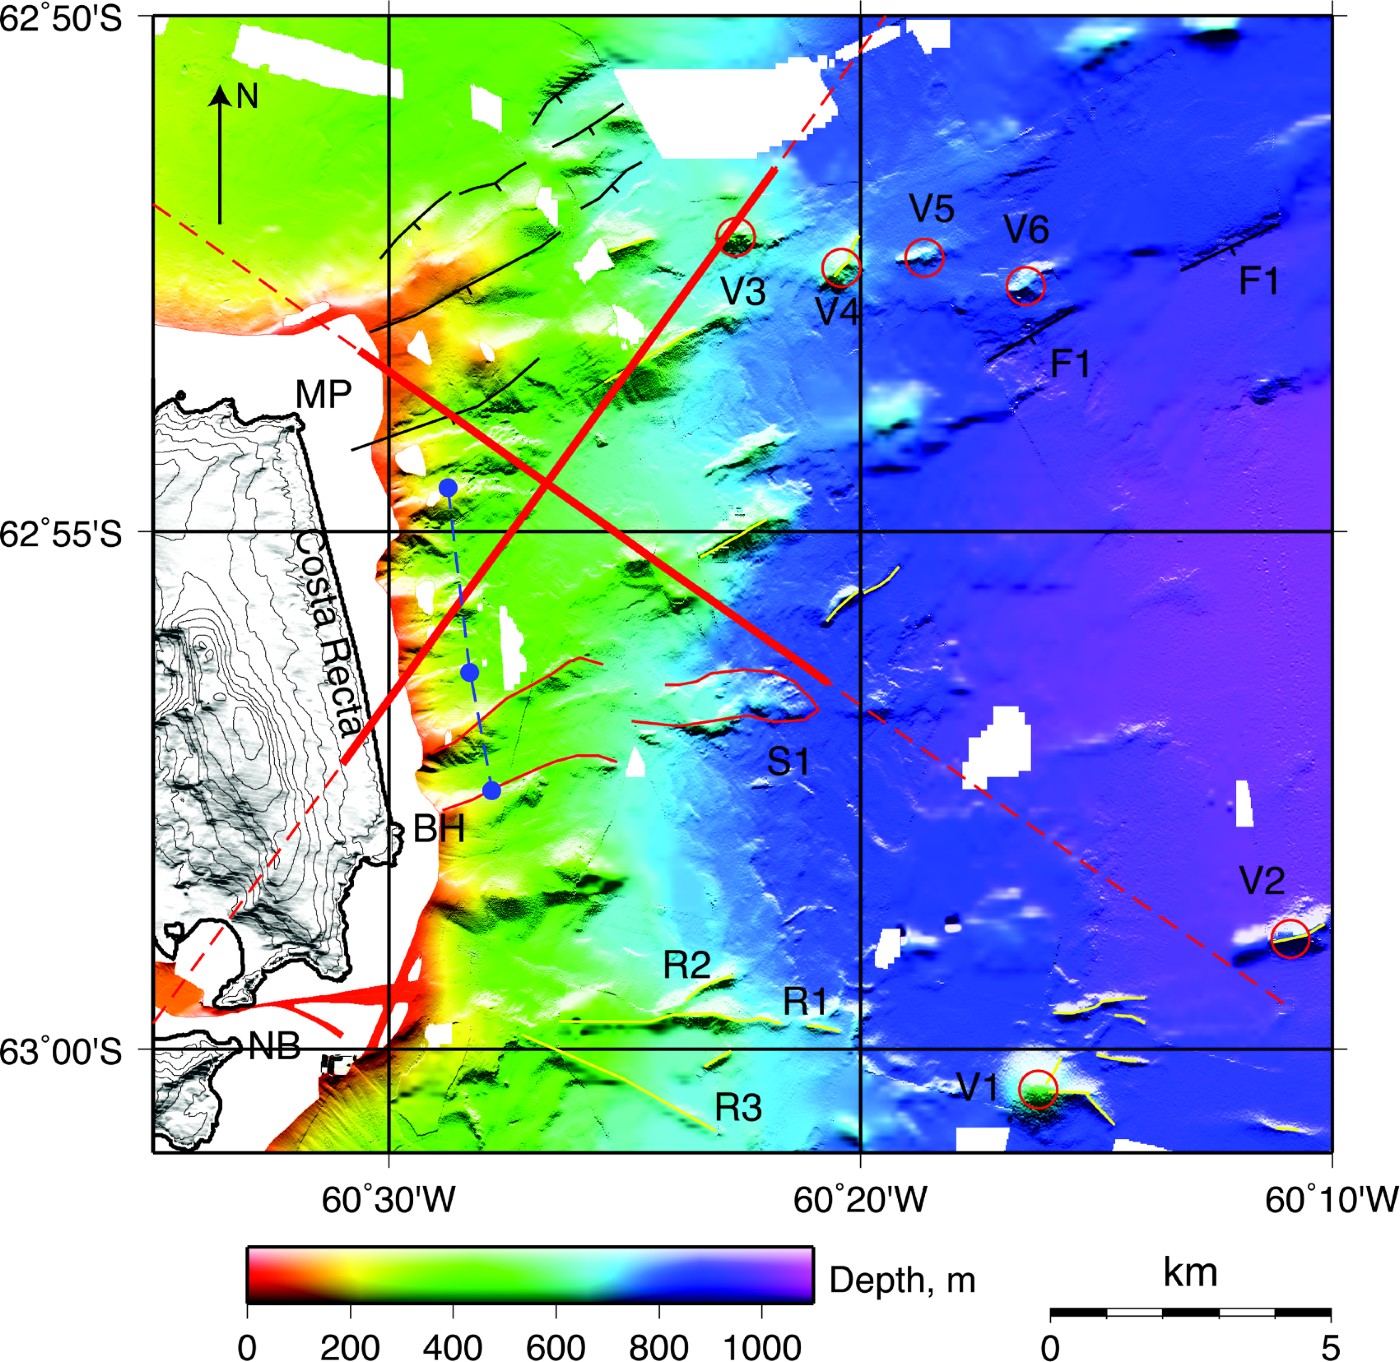
It is probable that many of these features closest to Deception Island have been formed by sediment deposition and slumping. Although their orientation is close to the trend of the CBB axis, and therefore possibly related to the stress field, they are also aligned approximately perpendicular to the island's coast which would be consistent with slumping and debris flows. In addition, a probable slump deposit that extends for < 7 km from the coast just north of Bailey Head (labelled S1 in Fig. 6) appears to originate from one of the southern gullies. Because many of these deposits are shallower than 400 m, the approximate depth of the ice-grounding line elsewhere in Bransfield Strait during the last glacial maximum (Banfield & Anderson Reference Banfield and Anderson1995), they may also have been modified by ice flowing into the Bransfield Basin from Mount Pond glacier on Deception Island. Magnetic and gravity modelling (Muñoz-Martín et al. Reference Muñoz-Martín, Catalán, Martín-Dávila and Carbó2005) shows evidence for extensive shallow volcanic intrusions out to 9 km from Costa Recta (Fig. 6), indicating that many of the features in this region may additionally or alternatively be volcanic in origin.
At depths > 500 m, the average eastward dip of the seafloor lessens as one moves south-east towards the centre of Bransfield Strait and individual features, including seamounts and ridges, become clearly identifiable. In our data there are several near-conical or elongate seamounts that are clearly volcanic in origin, the largest of which is > 300 m high and 1.6 km in basal diameter (V1 in Fig. 6). Another five seamounts (V2-6) are smaller (from 60 m to 150 m tall and 0.5–1 km in basal diameter); four (V3-6) are clustered together. The smallest of these seamounts is similar in size to Stanley Patch, the submerged volcanic cone in Port Foster (Smellie et al. Reference Smellie, López-Martínez, Headland, Hernández Cifuentes, Maestro, Millar, Rey, Serrano, Somoza and Thomson2002). Many of the seamounts are connected to short (< 2 km) volcanic ridges up to 300 m high. These ridges have sharp spines and are generally aligned parallel to the axis of the CBB. The ridge/volcano systems are similar to the larger split volcano/ridge systems farther west along the CBB.
A branching system of ridges runs from the east of Neptunes Bellows into the CBB (R1-3 in Fig. 6). All ridges are at least 30 m high with respect to the surrounding seafloor. The longest ridge (R1) is oriented E–W, is ~5 km long, and is connected to two shorter ridges; one of these (R2) is oriented parallel to the trend of the CBB and another (R3) has an orientation of 116°. We interpret these ridges as volcanic in origin, although two of them have orientations that are not consistent with Bransfield Strait extension.
A system of SE-facing scarps is apparent to the north-east of Macaroni Point, and is colinear with the system of faults cutting the north-east coast west of Macaroni Point (Smellie et al. Reference Smellie, López-Martínez, Headland, Hernández Cifuentes, Maestro, Millar, Rey, Serrano, Somoza and Thomson2002). Whereas the scarps are probably associated with SE-directed extension, some of the scarps dip into the local slope. Other SE-facing scarps are present on the floor of the CBB, including a 5 km long scarp (labelled F1 in Fig. 6) that may be traced across two swaths and when extrapolated across the island is colinear with the inferred Mount Pond fault (Fernández-Ibáñez et al. Reference Fernández-Ibáñez, Pérez-López, Martínez-Díaz, Paredes, Giner-Robles, Caselli and Ibáñez2005). However, the complex bathymetry and extensive sedimentation off the Costa Recta coast makes it difficult to unambiguously link fault scarps in the deeper basin to faults identified on the island.
Port Foster
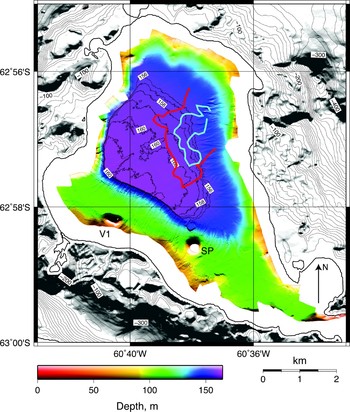
The sedimentary and volcanic features within Port Foster (Fig. 7) have been reported from previous bathymetric and seismic studies (e.g. Cooper et al. Reference Cooper, Smellie and Maylin1998, Somoza et al. Reference Somoza, Martínez-Frías, Smellie, Rey and Maestro2004), although no high-resolution bathymetric data have been published. The small-scale sedimentary structures are described in detail by Smellie et al. (Reference Smellie, López-Martínez, Headland, Hernández Cifuentes, Maestro, Millar, Rey, Serrano, Somoza and Thomson2002) and include slope-perpendicular slump scars and slope-parallel grooves and channels that are primarily located along the margins of the northern sub-basin. Two prominent volcanic cones have also been previously identified at 62°58.3′S, 60°38′W; called Stanley Patch and labelled SP, and at 62°58.1′S, 60°40.5′W; labelled V1.
Bathymetry of the interior of Port Foster. The red and blue lines show the resurgence rate contours of 20 and 30 cm yr-1 respectively taken from Cooper et al. (Reference Cooper, Smellie and Maylin1998). Stanley Patch and a second unnamed volcanic centre are labelled SP and V1, respectively. Illumination is from the south and a contour interval of 1 m is used for depths ≥ 156 m.

However, there are three differences between previous work and our results. First, Somoza et al. (Reference Somoza, Martínez-Frías, Smellie, Rey and Maestro2004) have interpreted and classified seafloor hydrothermal features as mounds and spires on the basis of multibeam bathymetry and shallow-penetrating sonar data along two transects within Port Foster. There is no evidence for these features in Fig. 7, and in particular, the spire-like structures identified by Somoza et al. (Reference Somoza, Martínez-Frías, Smellie, Rey and Maestro2004) along a transect from Stanley Patch to the north-west have the same spacing and amplitude as linear runnels and channels that are aligned perpendicular to the transect. Although hydrothermal structures may be present within Port Foster, they are not as widespread as these previous results imply. A second difference is the absence in Fig. 7 of an outcropping volcanic dome at (62°57.8′S, 60°39′W) that was reported in the bathymetry along a shallow seismic reflection line (Rey et al. Reference Rey, Somoza and Martínez-Frías1995, Reference Rey, Somoza, Martínez-Frías, Benito, Martín-Alfageme, Nicholson, Hein, Bühn and Dasgupta1997, Reference Rey, Maestro, Somoza, Smellie, Smellie and López-Martínez2002). Although it may be buried within the sediments, there is no seafloor expression of this dome, which has been used to propose a NNW-trending volcanic axis within the southern half of Port Foster that has been related to spatial variations in the geochemistry of volcanic sediments (Rey et al. Reference Rey, Somoza, Martínez-Frías, Benito, Martín-Alfageme, Nicholson, Hein, Bühn and Dasgupta1997) and cited in support of a tectonic model for the evolution of Deception Island (Rey et al. Reference Rey, Somoza and Martínez-Frías1995, Reference Rey, Maestro, Somoza, Smellie, Smellie and López-Martínez2002). Finally, Fig. 7 shows a small, previously unreported depression ~500 m north of Stanley Patch that is also visible in the results of an earlier bathymetric survey (Somoza et al. Reference Somoza, Martínez-Frías, Smellie, Rey and Maestro2004). The depression has a sharp rim with an apparent debris mound at its north-western margin, and may be a small volcanic crater or a sedimentary slump feature.
The northern sub-basin deepens to a smooth floor at 160 m depth that has < 1 m of relief for > 4 km2. While the western and southern margins of this basin are sharp, with the flat bottom overstepping the steep margins and truncating the slope channels, the eastern and north-eastern margins are more gently sloping with slumps and runnels that merge smoothly with the basin floor. The floor deepens in a south-west direction by 5 m over ~3 km. By comparing soundings within Port Foster since 1947, Cooper et al. (Reference Cooper, Smellie and Maylin1998) found evidence for enhanced shallowing in three regions in the north-west, north and east. Two of these regions could be explained by enhanced sedimentation but uplift in the central region at > 20–30 cm yr-1 was attributed to volcanic resurgence. There is no evidence in Fig. 7 for localized resurgence within this region, which overlaps the gently sloping basin floor but has no expression in the bathymetry.
Discussion
In this paper we have presented new multibeam bathymetric data for the submerged flanks of Deception Island and its flooded caldera, Port Foster. Within Port Foster, the bathymetry shows that, except for a few volcanic features, the seafloor morphology is dominated by sedimentation. As noted above, the bathymetry shows no evidence for the localized resurgence postulated by Cooper et al. (Reference Cooper, Smellie and Maylin1998). This is perhaps unsurprising given the age and paucity of the data used by these authors compared with a modern swath survey. However, it is consistent with an alternative model of trap door caldera deformation also proposed by Cooper et al. (Reference Cooper, Smellie and Maylin1998) with a broad region of uplift at ~20–30 cm yr-1 along the eastern margin of the caldera. As Cooper et al. (Reference Cooper, Smellie and Maylin1998) noted, a model of ongoing trap-door subsidence is supported by shallow seismic reflection surveys in the caldera which show that sediment layers dip to the west at an angle that increases with depth below the seafloor (Kowalewski et al. Reference Kowalewski, Rudowski and Zalewski1990, Rey et al. Reference Rey, De Andrés and Fernández-López1990).
However, the present-day bathymetric slope of the caldera floor could also be attributed to higher sediment fluxes from the eastern side of the island; this region is largely covered by glaciers which are overlain by ash deposits from recent eruptions (Smellie et al. Reference Smellie, López-Martínez, Headland, Hernández Cifuentes, Maestro, Millar, Rey, Serrano, Somoza and Thomson2002). The gentle slope of the basin floor decreases progressively towards the west, which is consistent with increased sediment supply from the east side, although it could also be attributed to resurgence beneath the east coast coupled with a flexure of the caldera floor. Given the resolution of modern multibeam systems, the precision of GPS navigation, the magnitude of the expected signal, and the high frequency of research vessel visits to Deception Island, repeat surveys of Port Foster conducted every few years as suggested by Cooper et al. (Reference Cooper, Smellie and Maylin1998) could address this issue. Complementary geodetic surveys on land (Berrocoso et al. Reference Berrocoso, Fernández-Ros, Torrecillas, Enriquez de Salamanca, Ramirez, Pérez-Peña, González, Páez, Jiménez, García-García, Tárraga, García-García, Fütterer, Damaske, Kleinschmidt, Miller and Tessensohn2006) could be used to determine the relative contributions of resurgence and sedimentation to the shoaling of Port Foster.
The features in the bathymetry around Deception Island can be explained almost entirely by a combination of tectonism and volcanism aligned with the extensional fabric of Bransfield Strait and sedimentary processes. Sedimentary features include slump scars, gullies, slump deposits, and sediment-filled basins. With the exception of the iceberg gouge features at depths < 300 m, we see no evidence for the influence of ice, such as drumlins or bundle structures, on the seafloor morphology around Deception Island. This is despite the fact that there is considerable evidence for ice streams within the WBB (Canals et al. Reference Canals, Urgeles and Calafat2000) and along the AP margin of the CBB (Canals et al. Reference Canals, Casamor, Urgeles, Calafat, Domack, Baraza, Farran and De Batist2002) and that the grounding line for the CBB during the last glacial maximum was ~400 m (Banfield & Anderson Reference Banfield and Anderson1995). Small-scale glacial features may have been obscured by the high sedimentation rate around Deception Island and it is possible we have wrongly attributed some glacial features to volcanic or sedimentary processes. However, we require no glacial processes to explain the bathymetry data.
Volcanic features to the east and west of Deception Island include isolated volcanic cones, clusters of cones some of which are aligned at ~060°, and volcanic ridges also typically oriented at ~060°, all of which bear a striking resemblance to features seen further east in Bransfield Strait (Lawver et al. Reference Lawver, Sloan, Barker, Ghidella, Von Herzen, Keller, Klinkhammer and Chin1996, Gràcia et al. Reference Gràcia, Canals, Farràn, Sorribas and Pallàs1997). The tectonic features in the bathymetry are dominated by faults that nearly all strike at ~060° degrees and dip south-east towards the centre of Bransfield Strait. In at least two places, the south margin of the basin to the west of Deception Island (Fig. 3) and to the north-east of Marconi Point (Fig. 6), some of these faults dip into the local slope, a feature that suggests that regional patterns of extension are locally decoupled from patterns of volcanic and sedimentary deposition.
There are only a few volcanic and tectonic features that cut the regional fabric. The orientations of fault scarps and ridges to the south-west of Deception Island oriented at 042° and the major volcanic ridge system to the east of Neptunes Bellows with the primary ridge at 090° (solid yellow lines in Fig. 8) are not parallel to the CBB trend at ~060° and may instead indicate the influence of a radial stress component from the volcano. For a volcano in a simple extensional stress field, faults and dikes will be parallel to the maximum compressive stress direction or stress trajectories (e.g. Pollard Reference Pollard, Halls and Fahrig1987), which may be radial in the near field due to magma inflation beneath the volcano and linear in the far field as a result of rifting. Since the anomalous trends are rotated towards the radii drawn from the centre of the volcano, they may indicate the influence of a radial stress component on the deeper flanks of the volcano. The sparsity of observed ridges or faults to the south-east of Deception Island precludes further tests of this hypothesis.
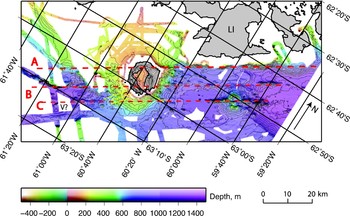
Oblique Mercator projection of Deception Island and Bransfield Strait. Coastline data are from the Antarctic Digital Database (http://www.add.scar.org). Illumination is from the south and the contour interval is 50 m. A, B and C are the alignments of tectonic and volcanic features mentioned in the text. Thin parallel yellow lines at the south and south-east of Deception Island are tectonic and volcanic alignments that are not parallel to the main alignments and appear to have a radial component. LI = Livingston Island, V? = A partially imaged elongated mound that may be volcanic.

The eastern outer coast of Deception Island (Costa Recta) comprises a ~7 km long beach that is backed by glaciers and bounded by two headlands (Macaroni Point and Bailey Head). Two theories have been proposed for the striking linearity of this beach that require a dextral strike-slip fault along the shore (Rey et al. Reference Rey, Somoza and Martínez-Frías1996) or a normal fault offshore (Fernández-Ibáñez et al. Reference Fernández-Ibáñez, Pérez-López, Martínez-Díaz, Paredes, Giner-Robles, Caselli and Ibáñez2005); a third theory attributes the linearity to the interaction of the beach, glacier and ocean along a coast protected by two headlands (López-Martínez & Serrano Reference López-Martínez, Serrano, Smellie and López-Martínez2002). Our data provide very little evidence in support of the faulting explanations. The hinge of the half graben we infer to the north of Marconi Point (where the seafloor deepens and sedimentary layers thicken toward the north-east, near CDP 1050 in Fig. 5a & b) lies near the trend of the Costa Recta and might be consistent with the normal faulting explanation, but this feature demonstrably stops short of Marconi Point and there is no indication of faulting closer to the island (Figs 5a & 6). To the south of Bailey Head (Fig. 6), there is a small east-facing ridge and scarp near 63°01′S, 60°28′W, but it appears to be a slump feature that does not quite parallel the Costa Recta and there is no evidence of faulting on the promontory immediately to the north. Thus, we infer that the non-faulting explanation for the Costa Recta (López-Martínez & Serrano Reference López-Martínez, Serrano, Smellie and López-Martínez2002) is most probably correct (the fault origin was also doubted by Smellie (Reference Smellie, Smellie and López-Martínez2002)).
There is considerable evidence for cross-strike tectonic structures within the CBB, including seismic reflection (Barker & Austin Reference Barker and Austin1998) and refraction (Christeson et al. Reference Christeson, Barker, Austin and Dalziel2003) studies, seafloor morphological steps associated with volcanic edifices (Gràcia et al. Reference Gràcia, Canals, Farràn, Sorribas and Pallàs1997) and faults on Livingston Island (Pallàs et al. Reference Pallàs, Vilaplana and Sàbat1995). The only evidence we see of similar features is the half graben identified to the north of Macaroni Point (Fig. 5), which is bounded by a west-facing scarp striking at 150°. This scarp roughly overlies the inferred position of a fracture zone with a dextral displacement of 10 km that was identified based on high gravity anomaly gradients (Muñoz-Martín et al. Reference Muñoz-Martín, Catalán, Martín-Dávila and Carbó2005), although the inferred strike of the fracture zone (125°) is significantly different from that of the scarp. To the west of Deception Island, the tectonic and volcanic fabric shows no evidence of NW–SE alignments. It is possible that additional structures that trend approximately NW–SE exist around Deception Island but if they do exist they must be largely inactive and buried by recent volcanic and sedimentary deposits.
In the CBB immediately to the east of Deception Island, there are three linear alignments (bold dashed lines labelled A, B and C in Fig. 8), spaced about 7 km apart, along which tectonic deformation and volcanic activity are concentrated (Lawver et al. Reference Lawver, Sloan, Barker, Ghidella, Von Herzen, Keller, Klinkhammer and Chin1996). The northern alignment corresponds to the northern boundary of extension in Bransfield Strait; the central alignment is marked by linear volcanic ridges and locally steeper bathymetric gradients to the south-east; and the southern alignment is marked by a prominent volcanic ridge that splits a seamount. All three of these features, particularly the northern two, appear to coincide with bathymetric features on the south-west side of the island when extrapolated across Deception Island. The northern alignment still marks the boundary between the South Shetland platform and the deeper regions of the WBB, although the bathymetric step is much decreased from the CBB. The largest bathymetric step is instead located along the central alignment while the southern alignment approximately coincides with the south-eastern boundary of the deepest portion of the WBB and with a partially-imaged elongated mound (labelled V in Fig. 8) that may be volcanic in origin. While extrapolations are somewhat speculative, they do suggest that there is very little evidence for large recent lateral displacements across the strike of Bransfield basin near Deception Island. Instead Deception Island may be near a relatively small right-lateral transfer zone at which the main axis of tectonic extension steps about 7 km south-eastward between the CBB and the WBB.
Since the bathymetry on the flanks of the volcano shows little evidence of the multiple fault populations that have been measured on Deception Island (Rey et al. Reference Rey, Somoza and Martínez-Frías1995, Reference Rey, Somoza, Martínez-Frías, Benito, Martín-Alfageme, Nicholson, Hein, Bühn and Dasgupta1997, Reference Rey, Maestro, Somoza, Smellie, Smellie and López-Martínez2002, Martí et al. Reference Martí, Vila, Rey, Mcguire, Jones and Neuberg1996, Muñoz-Martín et al. Reference Muñoz-Martín, Catalán, Martín-Dávila and Carbó2005, Paredes et al. Reference Paredes, Pérez-López, Giner-Robles, de la Vega, García-García and Gumiel2006, Maestro et al. Reference Maestro, Somoza, Rey, Martínez-Frías and López-Martínez2007, Pérez-López et al. Reference Pérez-López, Giner-Robles, Martínez-Díaz, Rodríguez-Pascua, Bejar, Paredes, González-Casado and Cooper2007), we conclude that they are the result of processes that are local to the island. Thus, we infer that a model that explains the deformation observed on Deception Island in terms of basin extension that may be superimposed by caldera collapse (Smellie et al. Reference Smellie, López-Martínez, Headland, Hernández Cifuentes, Maestro, Millar, Rey, Serrano, Somoza and Thomson2002, Pérez-López et al. Reference Pérez-López, Giner-Robles, Martínez-Díaz, Rodríguez-Pascua, Bejar, Paredes, González-Casado and Cooper2007) is more probable. Further local effects may result from the presence of a small right-lateral shear zone between the CBB and WBB discussed above and from a radial stress field on the flanks of the volcano resulting from magma inflation. Whereas models based on the intersection of regional faults or patterns of complex regional stress patterns (Rey et al. Reference Rey, Somoza and Martínez-Frías1995, Reference Rey, Maestro, Somoza, Smellie, Smellie and López-Martínez2002, Martí et al. Reference Martí, Vila, Rey, Mcguire, Jones and Neuberg1996, Maestro et al. Reference Maestro, Somoza, Rey, Martínez-Frías and López-Martínez2007) may provide an explanation for the position of Deception Island and its ability to tap magmas with both arc and backarc affinities (e.g. Keller et al. Reference Keller, Fisk, Smellie, Strelin and Lawver2002), they do not appear to be consistent with the current patterns of deformation on the volcano flanks.
Conclusions
We have presented multibeam bathymetric data from around Deception Island and inside its flooded caldera. The primary conclusions of our study are:
1. The bathymetry of the flooded caldera shows no evidence for localized resurgence as proposed by Cooper et al. (Reference Cooper, Smellie and Maylin1998) but is consistent with their model of trap door caldera deformation driven by broad uplift of the eastern side of the caldera. However, the bathymetry can equally well be explained by high rates of sediment supply from the east side of the island.
2. Around the island the alignments of volcanic and tectonic features are generally consistent with active Bransfield Strait extension at ~060°, although there are some features to the east and south of the volcano that deviate from this orientation and which appear to be affected by a radial stress component on the deeper flanks of the volcano.
3. There is little evidence for a fault controlling the linear outer eastern coast (Costa Recta) as previously proposed (Rey et al. Reference Rey, Somoza and Martínez-Frías1996, Smellie Reference Smellie, Smellie and López-Martínez2002, Fernández-Ibáñez et al. Reference Fernández-Ibáñez, Pérez-López, Martínez-Díaz, Paredes, Giner-Robles, Caselli and Ibáñez2005). The model of López-Martínez & Serrano (Reference López-Martínez, Serrano, Smellie and López-Martínez2002) which attributes the linearity to the interaction of the beach, glacier and ocean along a coast protected by two headlands seems more probable.
4. The only evidence we see for cross-strike tectonic structures is a half graben identified to the north of Macaroni Point bounded by a west-facing scarp striking at 150°. There is no evidence of active across-strike structures beneath or to the west of Deception Island.
5. Since the bathymetry on the flanks of the volcano shows little evidence of the multiple active fault populations observed and inferred on Deception Island (Rey et al. Reference Rey, Somoza and Martínez-Frías1995, Reference Rey, Somoza, Martínez-Frías, Benito, Martín-Alfageme, Nicholson, Hein, Bühn and Dasgupta1997, Reference Rey, Maestro, Somoza, Smellie, Smellie and López-Martínez2002, Martí et al. Reference Martí, Vila, Rey, Mcguire, Jones and Neuberg1996, Muñoz-Martín et al. Reference Muñoz-Martín, Catalán, Martín-Dávila and Carbó2005, Paredes et al. Reference Paredes, Pérez-López, Giner-Robles, de la Vega, García-García and Gumiel2006, Maestro et al. Reference Maestro, Somoza, Rey, Martínez-Frías and López-Martínez2007, Pérez-López et al. Reference Pérez-López, Giner-Robles, Martínez-Díaz, Rodríguez-Pascua, Bejar, Paredes, González-Casado and Cooper2007), we infer that these are features that are local. We infer that the deformation observed on Deception Island and its flanks is best explained in terms of regional extension across the basin, superimposed by local effects such as caldera collapse (Smellie Reference Smellie2001, Smellie et al. Reference Smellie, López-Martínez, Headland, Hernández Cifuentes, Maestro, Millar, Rey, Serrano, Somoza and Thomson2002, Pérez-López et al. Reference Pérez-López, Giner-Robles, Martínez-Díaz, Rodríguez-Pascua, Bejar, Paredes, González-Casado and Cooper2007), magma inflation, and perhaps a small right-lateral offset between the primary axes of extension in the CBB and WBB.
Acknowledgements
We thank the officers and crew of the RV Hespérides, the members of Unidad de Tecnología Marina, and the TOMODEC Working Group. We thank Javier Almendros, Tami Ben-Zvi, and Daria Zandomeneghi for useful discussions, and Jacobus LeRoux, John Smellie and the Editor for constructive reviews. This work was supported by US National Science Foundation grant ANT-0230094 and Spanish Education and Research Ministry grants REN 2001-3833 and CGL2005-05789-C02-02/ANT. Maps are produced using GMT software. Seismic reflection data are from the Marine Seismic Data Centre (http://www.ig.utexas.edu/sdc). Deception Island topography data are from the Geographical Service of the Spanish Army.