Implications
This study has shown that the inclusion level of a phytogenic feed additive in broiler diets has resulted in changes in the gut mucin monosaccharide composition and the intestinal mucosal architecture morphology. Given the fact that animal performance and disease prevention are prerequisites for an improved food chain and food safety, the findings presented here are expected to stimulate further research into the relevance of such changes for overall broiler gut function and health.
Introduction
An adherent mucus gel layer covers the surface of the gastrointestinal mucosa and constitutes the first line of defense against luminal threats. The mucus gel layer acts as a lubricant enhancing the propulsion of chyme, modulates nutrient absorption because of its permeability and protects the underlying epithelium from enteric pathogens. The major mucous component that accounts for its key properties is mucin (Forstner and Forstner, Reference Forstner and Forstner1994).
Mucins are high-molecular-weight glycoproteins that are synthesized, stored and secreted by goblet cells of the enteric epithelium. They are consisted by a protein backbone and a high proportion of O-linked carbohydrates (50% to 80%). Five different monosaccharides are commonly found in mucins, namely N-acetylgalactosamine (GalNac), N-acetylglucosamine (GlcNac), galactose (Gal), fucose (Fuc) and sialic acids (NeuAc). In addition, N-linked mannose (Man) is found in smaller amounts in intestinal glycoproteins (Strous and Dekker, Reference Strous and Dekker1992; Forstner and Forstner, Reference Forstner and Forstner1994).
The importance of mucin monosaccharides in structure and function of gut glycoproteins is recognized. Mucin monosaccharide composition depends on a dynamic interaction between adhesion of intestinal bacteria (Kirjavainen et al., Reference Kirjavainen, Ouwehand, Isolauri and Salminen1998; Ouwehand et al., Reference Ouwehand, Kirjavainen, Grunlund, Isolauri and Salminen1999; Gusils et al., Reference Gusils, Oppezzo, Pizarro and González2003), host intestinal glycosylation (Bry et al., Reference Bry, Falk, Midtvedt and Gordon1996; Gheri Bryk et al., Reference Gheri Bryk, Sgambati and Gheri1999; Freitas et al., Reference Freitas, Axelsson, Cayuela, Midtvedt and Trugnan2005) and microbial degradation by the intestinal microflora (Hoskins et al., Reference Hoskins, Agustines, McKee, Boulding, Kriaris and Niedermeyer1986; Ruas-Madiedo et al., Reference Ruas-Madiedo, Gueimonde, Fernandez-Garcia, de los Reyes-Gavilan and Margolles2008).
Except intestinal microflora, diet has been reported to affect gut mucin composition in broilers (Sharma et al., Reference Sharma, Fernandez, Hinton and Schumacher1997; Fernandez et al., Reference Fernandez, Sharma, Hinton and Bedford2000; Smirnov et al., Reference Smirnov, Perez, Amit-Romach, Sklan and Uni2005 and Reference Smirnov, Tako, Ferket and Uni2006; Jamroz et al., Reference Jamroz, Wertelecki, Houszka and Kamel2006; Chee et al., Reference Chee, Iji, Choct, Mikkelsen and Kocher2010a and Reference Chee, Iji, Choct, Mikkelsen and Kocher2010b). Goblet cell staining (Sharma et al., Reference Sharma, Fernandez, Hinton and Schumacher1997; Fernandez et al., Reference Fernandez, Sharma, Hinton and Bedford2000; Jamroz et al., Reference Jamroz, Wertelecki, Houszka and Kamel2006; Chee et al., Reference Chee, Iji, Choct, Mikkelsen and Kocher2010a and Reference Chee, Iji, Choct, Mikkelsen and Kocher2010b), mucus layer thickness (Smirnov et al., Reference Smirnov, Perez, Amit-Romach, Sklan and Uni2005) and mucin gene expression (Smirnov et al., Reference Smirnov, Tako, Ferket and Uni2006; Chee et al., Reference Chee, Iji, Choct, Mikkelsen and Kocher2010a) are listed among key parameters studied in an attempt to generate information of dietary effects on intestinal mucin composition.
After the implemented European Union ban of antibiotics used as antimicrobial growth promoters (AGP) in animal nutrition, various feed additives are being actively researched for their efficacy to promote growth performance and health (Applegate et al., Reference Applegate, Klose, Steiner, Ganner and Schatzmayr2010). In this sense, the use of phytogenic compounds (e.g. essential oils, oleoresins and flavonoids) in poultry has gained momentum for their potential role as natural alternatives to AGP because of their beneficial effects in broiler performance and gut health (Giannenas et al., Reference Giannenas, Florou Paneri, Papazahariadou, Christaki, Botsoglou and Spais2003; Brenes and Roura, Reference Brenes and Roura2010; Mountzouris et al., Reference Mountzouris, Paraskevas, Tsirtsikos, Palamidi, Steiner, Schatzmayr and Fegeros2011).
It has been previously shown that dietary administration of a phytogenic feed additive (PFA) affected broiler growth performance, nutrient utilization and cecal microflora composition (Mountzouris et al., Reference Mountzouris, Paraskevas, Tsirtsikos, Palamidi, Steiner, Schatzmayr and Fegeros2011). The aim of this work was to further examine the effect of PFA dietary inclusion level on important elements of broiler gut ecology. In particular, the study focused on the determination of gut mucin monosaccharide composition, as knowledge in this level could shed further light on the potential of dietary feed additives to modulate host–gut microflora interface. Potential effects on mucus layer thickness, mucus layer staining intensity and broiler intestinal morphology were also studied.
Material and methods
Birds and experimental treatments
This study forms a part of ongoing research work (Mountzouris et al., Reference Mountzouris, Paraskevas, Tsirtsikos, Palamidi, Steiner, Schatzmayr and Fegeros2011), and in order to avoid excessive repetition a brief description on the experimental treatments is given below. A total of 525 1-day-old male Cobb broilers were obtained from a local commercial hatchery and were randomly allocated into five experimental treatments according to the type of supplementation in a maize–soybean basal diet (BD) formulated for broiler starter (1 to 14 days), grower (15 to 28 days) and finisher (29 to 42 days) growth periods. Animal care and use conformed to the guidelines of the Faculty of Animal Science and Aquaculture of the Agricultural University of Athens. Each experimental treatment had three replicate floor pens and treatments were: control treatment (C) where the birds were fed the BD with no other additions, the PFA treatments (E1, E2 and E3) where PFA was added in BD at increasing concentrations (i.e. 80, 125 and 250 mg/kg BD, respectively) and the avilamycin treatment (A) used as AGP, with avilamycin added at 2.5 mg/kg BD. There was no coccidiostat added in the BD. Diets and water were available ad libitum for the whole experiment that lasted 42 days. The PFA had carvacrol from oregano, anethol from anise and limonene from citrus as the main active ingredients reaching a total concentration of 115 g/kg PFA, whereas fructo-oligosaccharides acted as carriers (Biomin P.E.P., Biomin GmbH, Herzogenburg, Austria). Details on PFA in diets and PFA addition in feed can be found in Mountzouris et al. (Reference Mountzouris, Paraskevas, Tsirtsikos, Palamidi, Steiner, Schatzmayr and Fegeros2011).
Sampling and processing
The birds were in good health and no disease incidents occurred during the experiment. For intestinal samples, six birds per treatment (i.e. two birds per pen) at the age of 14 and 42 days were randomly selected and slaughtered by severing the jugular vein. The intestinal tract of the birds was removed and three segments (i.e. duodenum, ileum and cecum) were separated, frozen in liquid nitrogen and stored at −80°C until analyzed. Duodenum was defined as the loop from the gizzard duodenal junction to the point of entry of the pancreatic ducts. The ileum was defined as the segment between the Meckel's diverticulum and the ileocecal junction. As cecum, both cecal tonsils were used.
Each intestinal segment was defrosted on ice, placed on a frozen surface and opened longitudinally with the mucosa side up. Intestinal content was removed with caution, without affecting the underlying mucus layer. The tissue was subsequently rinsed three times with ice-cold phosphate-buffered saline (PBS) buffer containing phenylmethylsulfonyl fluoride, iodoacetamide and ethylenediaminetetraacetic acid (EDTA) to inhibit proteolytic activity (Ouwehand et al., Reference Ouwehand, Kirjavainen, Grunlund, Isolauri and Salminen1999). The clean tissue was subsequently placed on a filter paper to dry and then placed on an ice-cold glass surface.
Intestinal mucus isolation and purification
For mucus isolation, previously cleaned tissues were gently scrapped using a microscope glass slide and the scrapings were placed in bijoux pots (Greiner Bio-One GmbH, Frickenhausen, Germany) and weighted. Ice-cold EDTA buffer (5 mM) was added to mucus samples so as to yield a final concentration of 150 mg mucus/ml EDTA and were subsequently homogenized according to Libao-Mercado and De Lange (Reference Libao-Mercado and De Lange2007). After homogenization, the samples were centrifuged at 10 000 × g for 30 min at 4°C and the soluble mucin-containing supernatant was collected. The purification of mucin was performed by size-exclusion chromatography using an XK-16 column (GE Healthcare Bio Sciences AB, Uppsala, Sweden) filled in with Sepharose CL-4B (Sigma-Aldrich, St. Louis, MO, USA) and equilibrated with the elusion buffer (0.2 M NaCl), according to Libao-Mercado and De Lange (Reference Libao-Mercado and De Lange2007). The high molecular mucin molecule was eluted at the void volume of the column and collected as 1 ml fractions detected via combined UV (280 nm) and refractive index detection. All fractions comprising the mucin peak were pooled and lyophilized. The lyophilized mucins were then appropriately diluted (i.e. 100 mg/ml) in PBS and analyzed as described below.
Intestinal mucin carbohydrate side-chain composition
The procedure for the determination of mucin monosaccharides via high performance liquid chromatography (HPLC) analysis required a hydrolysis and one derivatization step according to Anumula (Reference Anumula1994 and Reference Anumula1995).
Determination of mucin GlcNac, GalNac, Gal, Man and Fuc
For the determination of mucin GlcNac, GalNac, Gal, Man and Fuc, except NeuAc, xylose was used as an internal standard and was added at a ratio 9 : 1 to each mucin solution, as well as to appropriate monosaccharide standard solutions.
Subsequently, 20 μl of each mucin sample and standards were placed in glass vials and mixed with 75 μl of 20% trifluoroacetic acid. The vials were then sealed tightly with aluminum caps and heated at 100°C for 3 h using a thermoblock dry heater (Falc Instruments, Treviglio, Italy). After the end of the hydrolysis, the aluminum caps were removed and the hydrolysates were dried under vacuum (Anumula, Reference Anumula1994).
For the derivatization of mucin monosaccharides, mucins and standard hydrolysates were dissolved in 20 μl freshly prepared 0.6% sodium acetate and mixed with 50 μl of 2-aminobenzoic (ABA or anthranilic acid) reagent. For the ABA reagent, ABA and sodium cyanoborohydride were dissolved in acetate–borate reaction medium (2.4% sodium acetate and 2% boric acid in methanol) in concentrations of 20 and 30 mg/ml, respectively. Vials were sealed and heated at 80°C for 1 h in a thermoblock dry heater. After cooling in ambient temperature, the volume was made up to 1 ml with HPLC solvent A (see following paragraph) and mixed vigorously before HPLC analysis.
The ABA derivatives of GlcNac, GalNac, Gal, Man and Fuc were determined with HPLC using the method described by Anumula (Reference Anumula1994) following slight modifications with respect to the size of the analytical column used and the sample elution table. In brief, the chromatographic system (Hewlett Packard 1100 series) (Hewlett Packard GmbH, Waldbronn, Germany) was equipped with an HP 1046A fluorescence detector (Hewlett Packard GmbH, Waldbronn, Germany) and a smaller C-18 reverse phase column (Hypersil ODS; 5 μm, 200 × 2.1 mm) (Agilent Technologies Inc., Santa Clara, California, USA) that allowed the analysis to be completed within 35 min. Two solvents were used for the separation. Solvent A contained 0.25% 1-butylamine, 0.5% ortho-phosphoric acid and 1% tetrahydrofuran (butylated hydroxytoluene (BHT) inhibited) in HPLC water. Solvent B consisted of solvent A and acetonitrile in ratio of 50 : 50. The separation of monosaccharides was carried out using gradient elution. According to the elution table, solvent B in the mobile phase increased linearly from 8% to 12% within 25 min. The column was subsequently washed with 100% solvent B for 5 min and equilibrated with the initial mobile phase (92% solvent A – 8% solvent B) for a further 5 min to ensure reproducibility from run to run. The temperature (25°C) and flow rate (0.5 ml/min) remained stable during the analysis. ABA derivatives were detected with fluorescence detection according to Anumula (Reference Anumula1994). Data were collected into an Agilent Chemstation chromatography data system and quantified following system calibration with appropriate standard calibration curves. Samples and standards were analyzed in triplicate.
Determination of NeuAc
The determination of NeuAc was performed by a modified method of Anumula (Reference Anumula1995) using the chromatographic system and column stated above and the procedure below.
Mucin samples (50 μl) and NeuAc standards were placed in vials and mixed with 50 μl of sodium bisulfate (0.25 M). The vials were tightly sealed with aluminum caps and heated at 80°C for 20 min.
NeuAc was derivatized with freshly prepared ortho-phenyldiamine (OPD) prepared by diluting 20 mg OPD 2HCl per ml sodium hydrogen sulfate (0.25 M). The OPD reagent (100 μl) was added to the hydrolysates and the vials were heated at 80°C for 40 min. After cooling in ambient temperature, HPLC solvent C (see following paragraph) was added at a final volume of 1 ml.
The OPD-NeuAc derivatives were analyzed by HPLC following elution with butylamine–phosphoric acid–tetrahydrofuran mobile phase as described by Anumula (Reference Anumula1995). In brief, solvent C contained 0.15% 1-butylamine, 0.5% o-phosphoric acid and 1% tetrahydrofuran (BHT inhibited) in HPLC water. Solvent D was prepared by mixing solvent C with acetonitrile in 1 : 1 ratio. NeuAc was detected following isocratic elution of 8% solvent D for 12 min. Subsequently, the column was washed with 100% solvent D for 5 min and re-equilibrated with the initial mobile phase (92% solvent C – 8% solvent D) for a further 5 min to ensure run-to-run reproducibility. Column temperature (25oC) and flow rate (0.5 ml/min) remained constant during the analysis. Data were collected into an Agilent Chemstation chromatography data system and quantified according to the calibration curves of the NeuAc external standards. Samples and standards were analyzed in triplicate.
Intestinal histomorphology
For histological examinations, three birds per experimental treatment (i.e. one bird per pen) were randomly selected and three intestinal segments (i.e. duodenum, ileum and cecum) per bird were examined. A tissue sample (approximately 1 cm3) from the middle of each intestinal segment was removed and immersed in 4% paraformaldehyde in 0.1 M PBS, 79382 (Fluka, Buchs, Switzerland) at pH 7.4 for 1 h at room temperature. Tissues were washed three times for 30 min in PBS before storage overnight at 4°C in PBS containing 7% sucrose and 0.1% sodium azide. Tissue samples were embedded in Optimal Cutting Temperature Cryocompound cryoprotection medium (Tissue-Tek, Leica, Nussloch, Germany) and snap frozen in liquid nitrogen-cooled isopentane. Transverse sections of 10 μm thickness were cut in a Leica CM1500 cryostat (Leica, Nussloch, Germany), thaw-mounted on poly-l-lysine-coated glass slides and stored at −30°C until analyzed as follows.
Morphology
Each section was stained with hematoxylin and eosin and stored at room temperature. Subsequently, villus height (Vh), crypt depth (Cd) and Vh/Cd ratio were determined for three villi and their adjoining crypts per cut (i.e. 27 measurements per intestinal segment per treatment). The stained sections were examined under light microscope (Olympus BX 50; Olympus, Hamburg, Germany) using image analysis software (Image-Pro Plus Version 3.1, Media Cybernetics, Silver Spring, MD, USA). Vh was measured from the villi tip to the villus–crypt junction, whereas Cd was defined as the depth of the invagination between two villi. All morphological examination readings were carried out blinded by one observer.
Mucus layer thickness and staining intensity
For the determination of mucus layer thickness and staining intensity, sections were stained with the Alcian Blue–Periodic Acid-Schiff (PAS; pH = 2.5) kit (DIAPATH, Martinengo, Italy). Both neutral and acidic (sialylated) mucins were stained and the mucus layer thickness was determined according to Jamroz et al. (Reference Jamroz, Wertelecki, Houszka and Kamel2006). In brief, three villi per cut were examined and five points along each villus were measured.
The mucus layer staining intensity was determined semiquantitatively using an arbitrary scale with four levels: level 0 corresponded to no mucin staining, level 1 to moderate staining, level 2 to sufficient staining and level 3 to full staining. A light microscope was used as above. Three slides per tissue sample (i.e. nine slides per intestinal segment per treatment) were examined; each section contained at least three villi with their adjoining crypts. Intestinal villi and crypts were separated into three fragments depending on their citation. The fragments were referred as villus or crypt tip, midsection and base. All mucous staining intensity readings were carried out blinded by one observer.
Statistical analysis
Data regarding mucin monosaccharide composition (i.e. molar ratios), Vh, Cd, Vh/Cd ratio and mucus layer thickness were analyzed by one-way ANOVA by treating the treatment as the only fixed effect. Before analysis, the Kolmogorov–Smirnov test was used to test for normal distribution (ND) of the data. This test showed that the data reasonably followed the ND. Significance was considered at P ⩽ 0.05. Statistical significant effects were further analyzed and means were compared using Duncan's multiple range test. In addition, the linear and quadratic effects of dietary PFA level (i.e. treatments C, E1, E2 and E3) were studied using polynomial contrasts.
Data on mucus layer staining intensity were analyzed separately by fitting a generalized linear model in an attempt to explicitly model the distribution of the mucus layer staining intensity scores. The model used allowed the mean scores to depend on linear predictors, that is, treatment, age, intestinal segment within age, villus or crypt fragments within intestinal segment through a nonlinear link function (log). Both a Poisson and a negative binomial response probability distribution were examined in favor of the latter that adequately account for overdispersion of the data. The bird within treatment effect was also included as the repeated factor and the compound symmetry structure was assumed for the errors because of repeated measurements per animal. Assessment of goodness of fit was based on deviance divided by degrees of freedom with acceptable values ranging from 1.16 to 1.26 for the crypts and villi, respectively. Results of this analysis are shown as least squares means. A count*2 transformation of data was applied to achieve solutions of the Generalized Estimating Equations via the maximum likelihood. This analysis was carried out by procedure GENMODE in SAS/STAT Software Version 9.0.
Results
Mucin monosaccharide composition
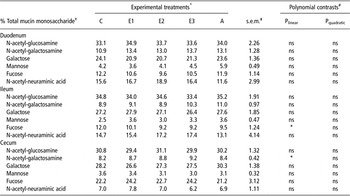
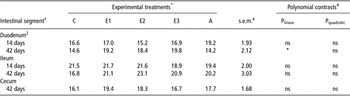
In the duodenum of 14-day-old broilers, the molar ratio of Man differed significantly (P < 0.05) among treatments. In particular, duodenal Man in treatments E2 and E3 was significantly higher (P ⩽ 0.05) compared with treatments C, E1 and A, whereas it increased linearly (P = 0.001) with PFA inclusion level (Table 1). In addition, PFA inclusion level had a quadratic effect in GalNac, with treatment E1 having the highest value, whereas there were no differences between treatments (P > 0.05). In the ileal mucin of 14-day-old broilers, a linear increase of Gal (P = 0.002) and Man (P = 0.012) was found with PFA inclusion level. Treatment A had lower (P ⩽ 0.05) ileal Gal than treatments E2 and E3 (Table 1). In the ileum of 42-day-old broilers, although there were no differences (P > 0.05) between treatments, a linear reduction (P = 0.021) of Fuc was found with increasing PFA level (Table 2). In the cecal mucin of 42-day-old broilers monosaccharide molar ratios did not differ (P > 0.05) between treatments, yet a pattern of linear increase of GalNac (P = 0.036) with increasing PFA level in BD was found (Table 2).
Means per treatment of mucin monosaccharide molar ratios at the duodenum and ileum of 14-day-old broilers

*Treatments: C = corn–soybean meal basal diet (BD) – no additives; E1 = BD containing 80 mg phytogenic feed additive (PFA)/kg diet; E2 = BD containing 125 mg PFA/kg diet; E3 = BD containing 250 mg PFA/kg diet; A = BD containing 2.5 mg avilamycin/kg diet.
†Data represent means from six birds per treatment. Treatment means with different superscripts (a, b or A, B) within the same row differ significantly (P ⩽ 0.05 or P < 0.01, respectively).
‡Pooled standard error of means.
Polynomial contrasts test the linear and quadratic effect of PFA inclusion levels using treatments C, E1, E2 and E3.
Means per treatment of mucin monosaccharide molar ratios at the duodenum, ileum and cecum of 42-day-old broilers

*Treatments: C = corn–soybean meal basal diet (BD) – no additives; E1 = BD containing 80 mg phytogenic feed additive (PFA)/kg diet; E2 = BD containing 125 mg PFA/kg diet; E3 = BD containing 250 mg PFA/kg diet; A = BD containing 2.5 mg avilamycin/kg diet.
†Data represent means from six birds per treatment.
‡Pooled standard error of means.
Polynomial contrasts test the linear and quadratic effect of PFA inclusion levels using treatments C, E1, E2 and E3.
Intestinal morphology
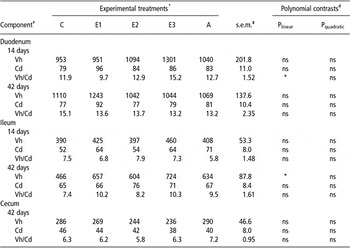
There were no significant differences (P > 0.05) between treatments regarding Vh, Cd and Vh/Cd ratio in the duodenum and ileum of 14-day-old broilers (Table 3). However, a linear increase (P = 0.039) in the ratio of Vh/Cd with PFA inclusion level was noted. No differences (P ⩽ 0.05) between treatments were observed in 42-day-old broilers (P > 0.050) for all intestinal segments examined. Nevertheless, ileal Vh increased linearly (P = 0.039) with increasing PFA level (Table 3).
Means per treatment of Vh, Cd and Vh/Cd ratio in different segments of the intestinal tract

Vh = villus height; Cd = crypt depth.
*Treatments: C = corn–soybean meal basal diet (BD) – no additives; E1 = BD containing 80 mg phytogenic feed additive (PFA)/kg diet; E2 = BD containing 125 mg PFA/kg diet; E3 = BD containing 250 mg PFA/kg diet; A = BD containing 2.5 mg avilamycin/kg diet.
†Data represent means from three birds per treatment. Vh and Cd were measured in μm.
‡Pooled standard error of means.
Polynomial contrasts test the linear and quadratic effect of PFA inclusion levels using treatments C, E1, E2 and E3.
Mucus layer staining intensity
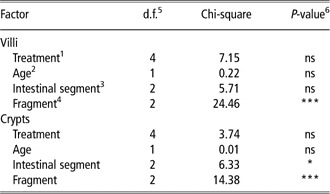
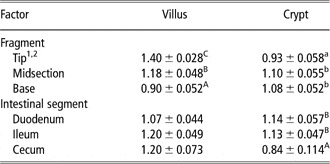
Mucus layer staining intensity of broiler intestinal villi was not significantly (P > 0.05) influenced by experimental treatments, age or intestinal segment (Table 4). In contrast, villus fragment (i.e. tip, midsection or base) affected the Alcian Blue–PAS staining of mucus layer (P < 0.001; Table 4). Higher staining intensity (i.e. more scores) was found at the villus tip compared with the staining intensity of the villus midsection and villus base (Table 5). In addition, the mucus layer staining was higher in the midsection compared with the base. With regard to the intestinal crypt of broilers, there was no influence of treatment or age on mucus layer staining intensity (P > 0.05). In contrast, Alcian Blue–PAS staining was affected by intestinal segment and crypt fragment (Table 4). More specifically, differences (P < 0.05) of least square means showed that the crypt tip had less staining intensity than the midsection and base of crypts. In addition, cecal staining intensity was lower than duodenal and ileal staining intensities (Table 5).
Effect of experimental treatment, broiler age, intestinal segment and villus–crypt fragment on mucus layer staining intensity

1Treatments: C = corn–soybean meal basal diet (BD) – no additives; E1 = BD containing 80 mg phytogenic feed additive (PFA)/kg diet; E2 = BD containing 125 mg PFA/kg diet; E3 = BD containing 250 mg PFA/kg diet; A = BD containing 2.5 mg avilamycin/kg diet.
2Two ages examined: 14 and 42 days.
3The examined intestinal segments were duodenum, ileum and cecum.
4Intestinal villi and crypts were separated into three segments: tip, midsection and base.
5Degrees of freedom.
6Differences were found when P ⩽ 0.05.
Least square means of mucus layer staining intensity concerning villus and crypt fragments along with intestinal segment villi and crypts of broilers

1Data were represented as mean of counts ± s.e.
2Means with different superscripts (a, b, c or A, B, C) within the same column per factor (i.e. fragment or intestinal segment) differ significantly (P ⩽ 0.05 or P < 0.01, respectively).
Mucus layer thickness
The PFA inclusion level did not influence the duodenal and ileal mucus layer thickness of 14-day-old broilers (Table 6). The intestinal mucus layer thickness increased linearly (P = 0.043) with PFA inclusion level in the duodenum of 42-day-old broilers; however, no differences (P > 0.05) were found between treatments. In addition, no differences (P > 0.05) between treatments were noted for ileal and cecal mucus layer thickness of 42-day-old broilers (Table 6).
Means per treatment of mucus layer thickness (μm) along the broiler intestinal tract

*Treatments: C = corn–soybean meal basal diet (BD) – no additives; E1 = BD containing 80 mg phytogenic feed additive (PFA)/kg diet; E2 = BD containing 125 mg PFA/kg diet; E3 = BD containing 250 mg PFA/kg diet; A = BD containing 2.5 mg avilamycin/kg diet.
†Data represent means from three birds per treatment.
‡Pooled standard error of means.
Polynomial contrasts test the linear and quadratic effect of PFA inclusion levels using treatments C, E1, E2 and E3.
Discussion
It is known that diet modulates the monosaccharide composition of mucin carbohydrate side chains (Sharma et al., Reference Sharma, Fernandez, Hinton and Schumacher1997; Fernandez et al., Reference Fernandez, Sharma, Hinton and Bedford2000; Jamroz et al., Reference Jamroz, Wertelecki, Houszka and Kamel2006; Chee et al., Reference Chee, Iji, Choct, Mikkelsen and Kocher2010a and Reference Chee, Iji, Choct, Mikkelsen and Kocher2010b). Research so far has examined the effect of dietary components such as amino acids, that is, threonine (Chee et al., Reference Chee, Iji, Choct, Mikkelsen and Kocher2010b), probiotics (Smirnov et al., Reference Smirnov, Perez, Amit-Romach, Sklan and Uni2005), prebiotics (Chee et al., Reference Chee, Iji, Choct, Mikkelsen and Kocher2010a and Reference Chee, Iji, Choct, Mikkelsen and Kocher2010b) and antibiotics (Smirnov et al., Reference Smirnov, Perez, Amit-Romach, Sklan and Uni2005; Chee et al., Reference Chee, Iji, Choct, Mikkelsen and Kocher2010a) in intestinal mucin dynamics of poultry. Jamroz et al. (Reference Jamroz, Wertelecki, Houszka and Kamel2006) studied the effect of PFA in broiler diet, which resulted in a higher mucus secretion in gastric and jejunal villi in 42-day-old broilers fed diet supplemented with plant extract containing carvacrol, cinnamaldehyde and capsicum oleoresin. The present study is the first one to investigate the effect of dietary phytogenics in intestinal mucin composition and to determine intestinal mucin carbohydrate monosaccharide molar ratios in broilers.
A noteworthy observation was the detection of all basic monosaccharides referred to the mucin composition of other animals (Shub et al., Reference Shub, Pang, Swann and Walker1983; Turck et al., Reference Turck, Feste and Lifschitz1993; Montagne et al., Reference Montagne, Toullec and Lallès2000). The latter was in line with the work of Gheri Bryk et al. (Reference Gheri Bryk, Sgambati and Gheri1999) who studied mucin monosaccharide composition in newborn chicks using lectin histochemistry. In contrast, Sharma et al. (Reference Sharma, Fernandez, Hinton and Schumacher1997) and Fernandez et al. (Reference Fernandez, Sharma, Hinton and Bedford2000) showed that Fuc and GalNac were absent in intestinal mucin of 5-week-old broilers, despite the fact that similar lectins to the ones used by Gheri Bryk et al. (Reference Gheri Bryk, Sgambati and Gheri1999) were used. The advantage of the analytical method used in this study is that it enables the detection of mucin monosaccharides irrespective of their location (i.e. internally, branch or terminal) in the carbohydrate side chains of the mucin molecule. In contrast, the carbohydrate-binding specificity of lectins allows only the detection of terminal monosaccharides.
The significant changes in Man with increasing PFA level in 14-day-old broilers, but not in 42-day-old ones, suggest a stronger PFA effect in N-linked glycosylation of young birds compared with the older ones. It is possible that the age dependence of PFA effects on gut goblet cells has to be considered within the context of overall development and maturation of young poultry digestive system, known to be incomplete, especially during the first 10 days post hatching (Batal and Parsons, Reference Batal and Parsons2002). Furthermore the changes in mucin monosaccharide composition pattern as in Gal, Fuc and GalNac molar ratios need to be further assessed in terms of overall gut microbial ecology, as it is known that a correlation between mucin composition and bacterial colonization and proliferation exits. The latter is evidenced via the degradation of mucin by bacterial glycosidases (Hoskins et al., Reference Hoskins, Agustines, McKee, Boulding, Kriaris and Niedermeyer1986; Ruas-Madiedo et al., Reference Ruas-Madiedo, Gueimonde, Fernandez-Garcia, de los Reyes-Gavilan and Margolles2008), the bacterial utilization of mucin carbohydrate side chains as energy source (Salyers, Reference Salyers1979; Scwad and Gänzle, Reference Scwad and Gänzle2011; Stahl et al., Reference Stahl, Friis, Nothaft, Liu, Li, Szymanski and Stinzi2011) and the bacterial adhesion in mucin monosaccharide (Kirjavainen et al., Reference Kirjavainen, Ouwehand, Isolauri and Salminen1998; Gusils et al., Reference Gusils, Oppezzo, Pizarro and González2003), as well as the ability of gut microflora to modulate intestinal glycosylation (Bry et al., Reference Bry, Falk, Midtvedt and Gordon1996; Gheri Bryk et al., Reference Gheri Bryk, Sgambati and Gheri1999; Freitas et al., Reference Freitas, Axelsson, Cayuela, Midtvedt and Trugnan2005) and mucin gene expression (Mack et al., Reference Mack, Michail, Wie, McDougall and Hollingsworth1999 and Reference Mack, Ahrne, Hyde, Wei and Hollingsworth2003). Therefore, this correlation may determine to a significant extent which species or even strains within species are best suited for utilization, colonization and/or adhesion to intestinal mucus. It has been previously shown that cecal luminal microflora was modulated by PFA inclusion level (Mountzouris et al., Reference Mountzouris, Paraskevas, Tsirtsikos, Palamidi, Steiner, Schatzmayr and Fegeros2011). At this stage, we cannot exclude modulation at small intestinal level but this has to be specifically studied.
It has been reported that several antibiotics administered in clinical doses may cause the breakdown of intestinal mucins to some extent (Carlstedt-Duke et al., Reference Carlstedt-Duke, Høverstad, Lingaas, Norin, Saxerholt, Steinbakk and Midtvent1986). Although it had been shown that avilamycin increased goblet cell density and mucin mRNA expression (Smirnov et al., Reference Smirnov, Perez, Amit-Romach, Sklan and Uni2005) and zinc bacitracin increased sulphomucin intensity (Chee et al., Reference Chee, Iji, Choct, Mikkelsen and Kocher2010a) in broiler intestine, mucin monosaccharide composition was not influenced by the inclusion of avilamycin in the diet when compared with the control treatment C of this work.
In the present investigation, the duodenal mucus layer thickness of 42-day-old broilers showed a pattern of linear increase with increasing PFA dietary levels. These results were in line with the work of Jamroz et al. (Reference Jamroz, Wertelecki, Houszka and Kamel2006) who observed a massive release of mucus material on jejunal villi in 21-day-old broilers fed a PFA. Given the fact that the nutrient digestibility in the PFA treatments did not differ from treatment C (Mountzouris et al., Reference Mountzouris, Paraskevas, Tsirtsikos, Palamidi, Steiner, Schatzmayr and Fegeros2011), the observed increase in mucus layer thickness could be considered as beneficial and could indicate a dietary PFA protective role for gut epithelium.
In this study, mucosal architecture in terms of Vh, Cd and Vh/Cd ratio did not differ between experimental treatments. Nevertheless, when examining treatments C, E1, E2 and E3, it was shown that increasing dietary PFA inclusion level resulted in increasing Vh/Cd ratio in the duodenum of 14-day-old broilers and ileal Vh in 42-day-old broilers. An increase in jejunal Vh has also been reported in broilers fed Zingiber officinale, propolis or a Z. officinale + propolis combination (Tekeli et al., Reference Tekeli, Kutlu, Celik and Doran2010). Generally, Vh and Vh/Cd ratio represents an indicator of the digestive capacity of the small intestine and higher values are concomitant with improved digestion and absorption (Montagne et al., Reference Montagne, Pluske and Hampson2003). However, other studies have not shown differences in intestinal morphology of broilers fed diets containing phytogenic extracts (Jamroz et al., Reference Jamroz, Wertelecki, Houszka and Kamel2006; García et al., Reference García, Catalá-Gregori, Hernández, Megías and Madrid2007; Perić et al., Reference Perić, Milošević, Žikić, Bjedov, Cvetković, Markov, Mohnl and Steiner2010).
Finally, the mucus layer staining intensity was influenced by the villus and crypt fragment. The Alcian Blue–PAS stain increased from villus base to villus tip. The increased higher accumulation of villus tip supported the key role of mucin in the protection of gut epithelium against luminal threats. Furthermore, the decreased stain in the crypt tip compared with midsection and base may relate to the process of proliferation and maturation of goblet cells, which are present mainly in crypts, but can also occur along the entire length of the villus of the chicken (Cairnie et al., Reference Cairnie, Lamerton and Steel1965; Uni et al., Reference Uni, Platin and Sklan1998).
Conclusions
This study has provided evidence that dietary PFA inclusion level in broilers modulated intestinal mucin monosaccharide composition, enhanced duodenal mucus secretion and affected positively the duodenal and ileal mucosal architecture morphology. However, further work is required to examine the relevance of such changes for host–microflora interactions and gut ecology.
Acknowledgments
The authors acknowledge the funding via a Biomin Research and Innovation Network (B.R.A.I.N) research grant.