Common units of analysis in Political Science are collective entities, such as voting precincts, cities, states or countries because that is how available data are collected, as in ecological voting studies, or because the unit is the entity of interest, as in studies of electoral party systems. Data clustered this way present estimation problems because the error terms within a cluster are unlikely to be independent. In many studies the multiple observations per unit are observed at irregular intervals with varying numbers of observations per unit so the data do not conform to the standard time-series, cross-section estimation models, which is one method for accommodating interdependence. The interdependence problem, however, must be addressed to obtain reliable estimates of the coefficients’ uncertainty as measured by their standard errors.
The common method with clustered data is cluster robust standard errors (CRSE), based on the Liang and Zeger (Reference Liang and Zeger1986) extension to clustered data of the robust standard errors associated with Eicker (Reference Eicker, Le Cam and Heyman1967), Huber (Reference Huber, Le Cam and Heyman1967) and White (Reference White1980). Unfortunately, as reviewed in various studies cited in Imbens and Kolesár (Reference Imbens and Kolesár2016), MacKinnon and Webb (Reference MacKinnon and Webb2017) and Esarey and Menger (Reference Esarey and Menger2019) CRSE are biased downwards for small samples and possibly even for larger samples. These authors present methods to adjust the CRSE confidence intervals, but do not address the basic bias problem.
This paper contributes to this literature by discussing a method for using the residuals from an OLS estimation to estimate the covariance within clusters which is then used to estimate the coefficient variance–covariance matrix. The problems with CRSE are discussed and then the new approach is developed. Extensive Monte Carlo simulations are conducted to compare the different correction methods with different sample properties. We conclude with examples from the State Politics and the Comparative Politics literatures where clustered data are common.Footnote 1
1 Methodological Issues with Cluster Robust Standard Errors
CRSE are routine with grouped data. (See Greene (Reference Greene2012, pp. 351 and 353); Franzese (Reference Franzese2005); and the citation count in Esarey and Menger (Reference Esarey and Menger2019, Table 1).) MacKinnon and Webb (Reference MacKinnon and Webb2017, p. 233) name three necessary conditions for CRSE to be consistent: (a) an infinite number of clusters; (b) homogeneity across clusters in the stochastic term distributions; and (c) an equal number of observations per cluster. This section discusses these and additional conditions that affect the CRSE underestimates of the true standard errors and thus biases subsequent statistical inference.
1.1 OLS with Cluster Robust Standard Errors
The problems posed by clustered data are described well in the cited literature. Following the conventional notation the population model is  $Y=X\unicode[STIX]{x1D6FD}+V$ and the estimated model is
 $Y=Xb+e$. The observations used to obtain the estimated model are clustered into groups, such as countries. The clusters are denoted by
 $g$,
 $g=1,\ldots ,G$. With interdependence within clusters
 $E(V_{g}V_{g}^{\prime })=\unicode[STIX]{x1D6F4}_{g}\neq \unicode[STIX]{x1D70E}_{g}^{2}I$. Denote the off-diagonal terms in
 $\unicode[STIX]{x1D6F4}_{g}$ by
 $\unicode[STIX]{x1D70C}_{g}\neq 0$. The conventional assumption and the one adopted here is that the stochastic terms are independent across groups so that
 $\unicode[STIX]{x1D6F4}_{v}=E(VV^{\prime })$ is block diagonal with the blocks being the variances and covariances of the stochastic terms within each cluster. The correct standard errors for the OLS estimation are,
 $$\begin{eqnarray}\unicode[STIX]{x1D6F4}_{b}=(X^{\prime }X)^{-1}\left[\mathop{\sum }_{g=1}^{G}(X_{g}^{\prime }\unicode[STIX]{x1D6F4}_{g}X_{g})\right](X^{\prime }X)^{-1},\end{eqnarray}$$
and are estimated with the expression,
 $$\begin{eqnarray}\hat{\unicode[STIX]{x1D6F4}}_{b}=S_{b}=(X^{\prime }X)^{-1}\left[\mathop{\sum }_{g=1}^{G}(X_{g}^{\prime }\hat{\unicode[STIX]{x1D6F4}}_{g}X_{g})\right](X^{\prime }X)^{-1},\end{eqnarray}$$
where  $\hat{\unicode[STIX]{x1D6F4}}_{g}$ is an estimate for
 $\unicode[STIX]{x1D6F4}_{g}$.
Cluster robust standard errors, following the procedure for sandwich estimators, obtain  $\hat{\unicode[STIX]{x1D6F4}}_{g}$ from the OLS residuals,
 $\hat{\unicode[STIX]{x1D6F4}}_{g}=(e_{g}e_{g}^{\prime })$, giving the following expression for the estimated CRSE,
 $$\begin{eqnarray}S_{b}=(X^{\prime }X)^{-1}\left[\mathop{\sum }_{g=1}^{G}X_{g}^{\prime }(e_{g}e_{g}^{\prime })X_{g}\right](X^{\prime }X)^{-1}.\end{eqnarray}$$
Comparison of the true standard errors to the expected CRSE is a comparison of the bracketed term in Equation (1) with the expected value of the bracketed term in Equation (3), which in turn depends on  $E(e_{g}e_{g}^{\prime })$. Appendix A develops the following expression,
 $$\begin{eqnarray}E(e_{g}e_{g}^{\prime })=\unicode[STIX]{x1D6F4}_{g}-\unicode[STIX]{x1D6F4}_{g}P_{g}-P_{g}\unicode[STIX]{x1D6F4}_{g}+X_{g}(X^{\prime }X)^{-1}\left(\mathop{\sum }_{g=1}^{G}X_{g}^{\prime }\unicode[STIX]{x1D6F4}_{g}X_{g}\right)(X^{\prime }X)^{-1}X_{g}^{\prime },\end{eqnarray}$$
where  $P_{g}=X_{g}(X^{\prime }X)^{-1}X_{g}^{\prime }$. Equation (4) shows the expected value of the variance–covariance matrix used to estimate
 $\unicode[STIX]{x1D6F4}_{g}$. Unfortunately substituting Equation (4) into the expected value of Equation (3) does not lead to any easily interpretable expression. Appendix B does this for the bivariate case assuming homogeneous clusters, i.e.
 $\unicode[STIX]{x1D6F4}_{g}=\unicode[STIX]{x1D6F4}$ for all
 $g$. The results provide some important insights into factors that affect by how much CRSE underestimate
 $\unicode[STIX]{x1D6F4}_{b}$.
One key result in Appendix B is Equation (B 5), which shows for the bivariate case that,
 $$\begin{eqnarray}\unicode[STIX]{x1D70E}_{b}^{2}=(x^{\prime }x)^{-1}\left(\mathop{\sum }_{g}x_{g}\unicode[STIX]{x1D6F4}_{g}x_{g}\right)(x^{\prime }x)^{-1}=\frac{\unicode[STIX]{x1D70E}^{2}}{NV_{x}}+\frac{2\unicode[STIX]{x1D70C}}{(NV_{x})^{2}}\mathop{\sum }_{g}C_{g}^{\ast },\end{eqnarray}$$
where  $x$ denotes the deviations of the explanatory variable from its full sample mean,
 $x=(X-\bar{X})$;
 $N$ is the total sample size;
 $V_{x}$ is the full sample variance of the explanatory variable
 $X$, and
 $C_{g}^{\ast }$ is the sum of the cross-product terms in cluster
 $g$,
 $C_{g}^{\ast }=\sum _{i=1}^{n_{g}-1}\sum _{j=i+1}^{n_{g}}x_{gi}x_{gj}$. Equation (B 4) in Appendix B shows that the expression for the expected value of the CRSE estimated coefficient variance is
 $$\begin{eqnarray}E(s_{b}^{2})=\frac{\unicode[STIX]{x1D70E}^{2}}{NV_{x}}\left[1-\mathop{\sum }_{g}\left(\frac{n_{g}V_{x_{g}}}{NV_{x}}\right)^{2}\right]+\frac{2\unicode[STIX]{x1D70C}}{(NV_{x})^{2}}\mathop{\sum }_{g}\left[\left(1-\frac{n_{g}V_{x_{g}}}{NV_{x}}\right)^{2}C_{g}^{\ast }\right].\end{eqnarray}$$
There are several important implications that can be drawn from Equations (5) and (6). The difference between the two equations is the presence of the squared terms involving  $n_{g}V_{x_{g}}/NV_{x}$, which is the share of the total variance in
 $X$ contributed by cluster
 $g$. The larger these summation terms the larger the amount by which the CRSE underestimate the true standard errors. Though Equation (6) is derived from the bivariate model and does not translate directly to the general multivariate model it still provides insight into factors that likely affect the reliability of CRSE in the general case.
There are several factors that affect the magnitude of the sum of these squared terms. One is the homogeneity of the distribution of  $X$ across clusters. Appendix B.1 shows that with homogeneous clusters, meaning that the number of observations and the mean and variance of
 $X$ are identical for all clusters, then the terms in brackets are only related to the factor
 $1/G$ so that as the number of clusters increases the CRSE approach the true standard errors,
 $\lim _{G\rightarrow \infty }s_{b}=\unicode[STIX]{x1D70E}_{b}$.
Cluster heterogeneity is the more frequent and interesting case. Because the relevant terms are squared quantities increasing heterogeneity increases the sum of these terms, which increases the gap between the CRSE and the true standard errors. One obvious source of heterogeneity is variation in the number of observations in each cluster,  $n_{g}$. As this variation increases so will the bias in the CRSE. Equal cluster sizes are one of the necessary conditions for consistent CRSE.
Heterogeneity in the explanatory variables’ variance is a much less discussed problem, though this heterogeneity has many sources. The focus here is on the amount of between cluster variance as a proportion of the total variance in an explanatory variable, labeled the amount of covariate clustering.Footnote 2 A high degree of covariate clustering is a likely attribute of many Political Science clustered datasets where the majority of variation in entities of interest, such as electoral rules, institutions, etc. is between units, such as countries, rather than within units. To see the effect of increasing the between variance decompose  $n_{g}V_{x_{g}}$ into its within and between components,
 $$\begin{eqnarray}n_{g}V_{x_{g}}=\mathop{\sum }_{i=1}^{n_{g}}[(X_{gi}-\bar{X}_{g})^{2}+n_{g}(\bar{X}_{g}-\bar{X})^{2}=n_{g}v_{x_{g}}+n_{g}(\bar{X}_{g}-\bar{X})^{2}],\end{eqnarray}$$
where  $v_{x_{g}}$ is the variance of
 $X$ within cluster
 $g$. Increased covariate clustering means larger values for the
 $n_{g}(\bar{X}_{g}-\bar{X})^{2}$ component, which in turn increases the variation in the
 $n_{g}V_{x_{g}}$ terms in Equation (6), which in turn decreases the value for
 $E(s_{b}^{2})$ relative to
 $\unicode[STIX]{x1D70E}_{b}^{2}$. As the amount of covariate clustering increases the gap between the CRSE and the true standard error also increases.
2 Corrections
What are the alternatives? Bell and McCaffrey (Reference Bell and McCaffery2002), based on a recommendation in Davidson and MacKinnon (Reference Davidson and MacKinnon1993), suggest an adjustment to the residual variances that increases the coefficient standard errors.Footnote 3 Imbens and Kolesár (Reference Imbens and Kolesár2016) incorporate this adjustment in their method. This approach still relies on  $e_{g}e_{g}^{\prime }$ to estimate
 $\unicode[STIX]{x1D6F4}_{g}$. Following the sandwich metaphor used to describe Equation (3) this method alters the bread but not the meat, which is where the problem lies.Footnote 4
Two methods adjust the confidence intervals for each coefficient, but not the standard errors, hoping to improve statistical inferences on a coefficient by coefficient basis. Imbens and Kolesár (Reference Imbens and Kolesár2016) and Stata adjust the number of degrees of freedom for each coefficient, thereby expanding the confidence interval. Another approach uses bootstrap methods to estimate the confidence intervals, (Cameron, Gelbach, and Miller Reference Cameron, Gelbach and Miller2008; Harden Reference Harden2011; MacKinnon and Webb Reference MacKinnon and Webb2017). Esarey and Menger (Reference Esarey and Menger2019) have an excellent summary and comparison of different bootstrap methods.
These approaches are limited because they do not provide an estimate for  $\unicode[STIX]{x1D6F4}_{b}$.Footnote 5 Exceptions are Harden (Reference Harden2011) who uses a bootstrapping procedure that returns an estimate for
 $\unicode[STIX]{x1D6F4}_{b}$ and the Stata boottest program, Roodman et al. (Reference Roodman, Nielsen, MacKinnon and Webb2019).Footnote 6 We return to Harden in a later section. By far the most common correction though follows Cameron, Gelbach, and Miller (Reference Cameron, Gelbach and Miller2008) and only corrects the individual coefficient confidence intervals, which creates serious limitations. A major one is that tests of null hypotheses about multiple coefficients, such as in models with interaction terms, are infeasible. This is a serious shortcoming given the popularity of models with interaction terms and the associated marginal effects plots, which require the full
 $\unicode[STIX]{x1D6F4}_{b}$ matrix to compute the desired confidence intervals. The corrections focused on confidence intervals also constrain the discussion to the confidence intervals selected by the authors as computing intervals for different
 $\unicode[STIX]{x1D6FC}$ values requires the original data. This is contrary to much current practice of reporting coefficients and standard errors and letting readers choose the level of uncertainty, see Wasserstein, Schirm, and Lazar (Reference Wasserstein, Schirm and Lazar2019). A better strategy is to estimate the correct standard errors, which is done next.
2.1 Cluster Estimated Standard Errors
The proposed method begins with the expression for  $E(e_{g}e_{g}^{\prime })$. The strategy is to relate this expected value to the unobserved variances,
 $\unicode[STIX]{x1D70E}_{g_{i}}^{2}$, and covariances among pairs of stochastic terms,
 $\unicode[STIX]{x1D70C}_{g_{ij}}$, and then to use these expressions to derive estimates for
 $\hat{\unicode[STIX]{x1D6F4}}_{g}$ in computing
 $\hat{\unicode[STIX]{x1D6F4}}_{b}$ in Equation (2).
Begin with the expression for  $E(e_{g}e_{g}^{\prime })$ in Equation (4). Impose the condition that the stochastic terms within a cluster are identically distributed so that
 $\unicode[STIX]{x1D70E}_{v_{g_{i}}}^{2}=\unicode[STIX]{x1D70E}_{g}^{2}$ and that
 $\unicode[STIX]{x1D70C}_{g_{ij}}=\unicode[STIX]{x1D70C}_{g}$ for all
 $i$ and
 $j$ in
 $g$. Equation (A 2) in Appendix A shows that,
 $$\begin{eqnarray}\displaystyle E(e_{g}e_{g}^{\prime }) & = & \displaystyle \unicode[STIX]{x1D70E}_{g}^{2}(I_{g}-P_{g})+\unicode[STIX]{x1D70C}_{g}\left[\vphantom{\left(\mathop{\sum }_{g=1}^{G}\right)}\unicode[STIX]{x1D704}_{g}\unicode[STIX]{x1D704}_{g}^{\prime }-(I_{g}-P_{g})-(P_{g}\unicode[STIX]{x1D704}_{g}\unicode[STIX]{x1D704}_{g}^{\prime }+\unicode[STIX]{x1D704}_{g}\unicode[STIX]{x1D704}_{g}^{\prime }P_{g})\right.\nonumber\\ \displaystyle & & \displaystyle +\left.X_{g}(X^{\prime }X)^{-1}\left(\mathop{\sum }_{g=1}^{G}X_{g}^{\prime }\unicode[STIX]{x1D704}_{g}\unicode[STIX]{x1D704}_{g}^{\prime }X_{g}\right)(X^{\prime }X)^{-1}X_{g}^{\prime }\right]\nonumber\\ \displaystyle & = & \displaystyle \unicode[STIX]{x1D70E}_{g}^{2}Q_{1_{g}}+\unicode[STIX]{x1D70C}_{g}Q_{2_{g}},\end{eqnarray}$$
where  $\unicode[STIX]{x1D704}_{g}$ is a
 $n_{g}\;x\;1$ column vector of ones. Equation (8) shows that the expected value of the squares and cross-products of the residuals in each cluster are linear functions of the unknown terms
 $\unicode[STIX]{x1D70E}_{g}^{2}$ and
 $\unicode[STIX]{x1D70C}_{g}$ with the weighting terms being functions of the observed
 $X$s, e.g. the elements in
 $Q_{1_{g}}$ and
 $Q_{2_{g}}$.
To simplify the algebra while we illustrate the methodology we impose the homogeneity condition across groups, so that  $\unicode[STIX]{x1D70E}_{g}^{2}=\unicode[STIX]{x1D70E}^{2}$ and
 $\unicode[STIX]{x1D70C}_{g}=\unicode[STIX]{x1D70C}$ for all
 $g$. Estimates for
 $\unicode[STIX]{x1D70E}^{2}$ and
 $\unicode[STIX]{x1D70C}$ follow from the linear structure in Equation (8). There are
 $n_{g}(n_{g}+1)/2$ residual squares and cross-products in
 $(e_{g}e_{g}^{\prime })$ whose expected values are linear functions of
 $\unicode[STIX]{x1D70E}^{2}$ and
 $\unicode[STIX]{x1D70C}$. Pooling these elements for all groups gives
 $\sum _{g=1}^{G}n_{g}(n_{g}+1)/2$ elements in the matrix of observed residual squares and cross-products,
 $$\begin{eqnarray}S_{e}=\left[\begin{array}{@{}cccc@{}}e_{1}e_{1}^{\prime } & 0 & \cdots \, & 0\\ 0 & e_{2}e_{2}^{\prime } & \cdots \, & 0\\ \vdots & \vdots & \ddots & \vdots \\ 0 & 0 & \cdots \, & e_{G}e_{G}^{\prime }\end{array}\right].\end{eqnarray}$$
These elements are related to the two unknown coefficients we are estimating and the corresponding elements in  $Q_{1}$ and
 $Q_{2}$. Think of this as a simple linear regression model,
 $$\begin{eqnarray}\displaystyle S_{e} & = & \displaystyle \left[\begin{array}{@{}cccc@{}}e_{1}e_{1}^{\prime } & 0 & \cdots \, & 0\\ 0 & e_{2}e_{2}^{\prime } & \cdots \, & 0\\ \vdots & \vdots & \ddots & \vdots \\ 0 & 0 & \cdots \, & e_{G}e_{G}^{\prime }\end{array}\right]=\left[\begin{array}{@{}cccc@{}}E(e_{1}e_{1}^{\prime })+\unicode[STIX]{x1D709}_{1} & 0 & \cdots \, & 0\\ 0 & E(e_{2}e_{2}^{\prime })+\unicode[STIX]{x1D709}_{2} & \cdots \, & 0\\ \vdots & \vdots & \ddots & \vdots \\ 0 & 0 & \cdots \, & E(e_{G}e_{G}^{\prime })+\unicode[STIX]{x1D709}_{G}\end{array}\right]\nonumber\\ \displaystyle & = & \displaystyle \unicode[STIX]{x1D70E}^{2}\left[\begin{array}{@{}cccc@{}}Q_{1_{1}} & 0 & \cdots \, & 0\\ 0 & Q_{1_{2}} & \cdots \, & 0\\ \vdots & \vdots & \ddots & \vdots \\ 0 & 0 & \cdots \, & Q_{1_{G}}\end{array}\right]+\unicode[STIX]{x1D70C}\left[\begin{array}{@{}cccc@{}}Q_{2_{1}} & 0 & \cdots \, & 0\\ 0 & Q_{2_{2}} & \cdots \, & 0\\ \vdots & \vdots & \ddots & \vdots \\ 0 & 0 & \cdots \, & Q_{2_{G}}\end{array}\right]+\left[\begin{array}{@{}cccc@{}}\unicode[STIX]{x1D709}_{1} & 0 & \cdots \, & 0\\ 0 & \unicode[STIX]{x1D709}_{2} & \cdots \, & 0\\ \vdots & \vdots & \ddots & \vdots \\ 0 & 0 & \cdots \, & \unicode[STIX]{x1D709}_{G}\end{array}\right]\nonumber\\ \displaystyle & = & \displaystyle \unicode[STIX]{x1D70E}^{2}Q_{1}+\unicode[STIX]{x1D70C}Q_{2}+\unicode[STIX]{x1D709}.\end{eqnarray}$$
Estimation of  $\unicode[STIX]{x1D70E}^{2}$ and
 $\unicode[STIX]{x1D70C}$ is based on this regression structure. Let
 $s_{e_{g}}$ be the observed residual square and cross-product terms from the lower triangle of
 $e_{g}e_{g}^{\prime }$ stacked into an
 $n_{g}(n_{g}+1)/2$ column vector. Similarly let
 $q_{1_{g}},q_{2_{g}}$ and
 $\unicode[STIX]{x1D709}_{g}$ be the corresponding vectors of elements from
 $Q_{1},Q_{2}$ and
 $\unicode[STIX]{x1D709}$ for cluster
 $g$. The OLS regression model used to estimate
 $\unicode[STIX]{x1D70E}^{2}$ and
 $\unicode[STIX]{x1D70C}$ is,
 $$\begin{eqnarray}\left[\begin{array}{@{}c@{}}s_{e_{1}}\\ s_{e_{2}}\\ \vdots \\ s_{e_{g}}\\ \vdots \\ s_{e_{G}}\end{array}\right]=\left[\begin{array}{@{}c@{}}q_{1_{1}}\\ q_{1_{2}}\\ \vdots \\ q_{1_{g}}\\ \vdots \\ q_{1_{G}}\end{array}\right]\unicode[STIX]{x1D70E}^{2}+\left[\begin{array}{@{}c@{}}q_{2_{1}}\\ q_{2_{2}}\\ \vdots \\ q_{2_{g}}\\ \vdots \\ q_{2_{G}}\end{array}\right]\unicode[STIX]{x1D70C}+\left[\begin{array}{@{}c@{}}\unicode[STIX]{x1D709}_{1}\\ \unicode[STIX]{x1D709}_{2}\\ \vdots \\ \unicode[STIX]{x1D709}_{g}\\ \vdots \\ \unicode[STIX]{x1D709}_{G}\end{array}\right].\end{eqnarray}$$
This gives
 $$\begin{eqnarray}\left[\begin{array}{@{}c@{}}\hat{\unicode[STIX]{x1D70E}}^{2}\\ \hat{\unicode[STIX]{x1D70C}}\end{array}\right]=\left[\begin{array}{@{}cc@{}}q_{1}^{\prime }q_{1} & q_{1}^{\prime }q_{2}\\ q_{2}^{\prime }q_{1} & q_{2}^{\prime }q_{2}\end{array}\right]^{-1}\left[\begin{array}{@{}c@{}}q_{1}^{\prime }s_{e}\\ q_{2}^{\prime }s_{e}\end{array}\right].\end{eqnarray}$$
This is not a statistical regression, but a method for choosing the values for  $\unicode[STIX]{x1D70E}^{2}$ and
 $\unicode[STIX]{x1D70C}$ that best fit the observed squares and cross-products of the residuals, where best is defined as the minimum sum of squared errors. This method is referred to as cluster estimated standard errors (CESE).
One adjustment is made computing the CESE. Davidson and MacKinnon (Reference Davidson and MacKinnon1993, p. 554) recommend adjusting the residuals by  $hc2=e_{i}/\sqrt{1-h_{ii}}$ or by
 $hc3=e_{i}/(1-h_{ii})$, where
 $h_{ii}$ denotes the
 $i$th diagonal element in the projection matrix
 $P_{g}$. They argue that squared residuals underestimate the true variance of the stochastic terms, particularly for observations that exert leverage on the OLS estimates (indicated by larger values for
 $h_{ii}$). They recommend the
 $hc3$ adjustment for data where heteroskedasticity is present. Long and Ervin (Reference Long and Ervin2000) report the results of extensive Monte Carlo simulations that support the Davidson and MacKinnon recommendations. These arguments and demonstrations are the basis for these adjustments.Footnote 7 These are referred to as the
 $\text{CESE}_{2}$ and
 $\text{CESE}_{3}$ estimators, respectively.
3 Monte Carlo Experiments Comparing Correction Methods
Monte Carlo experiments are conducted to compare the performance of the two methods for estimating standard errors with clustered data—cluster robust standard errors (CRSE) and cluster estimated standard errors (CESE). The distributions of the explanatory variables and stochastic terms are selected to examine the performance of the two estimators under a variety of circumstances. The initial simulations match the ideal conditions for the CRSE—homogeneously distributed explanatory variables with no covariate clustering, an equal number of observations per cluster and homogeneous normally distributed stochastic terms. Subsequent simulations vary the number of observations per cluster, the amount of covariate clustering, the heterogeneity of the stochastic term distributions for each cluster and the shape of the distribution from which the stochastic terms are obtained. Each simulation is done for varying numbers of clusters.
The model has three explanatory variables and one interaction term,
 $$\begin{eqnarray}Y_{g_{i}}=2+1\ast X_{1_{g_{i}}}+0\ast X_{2_{g_{i}}}+0\ast (X_{1_{g_{i}}}\cdot X_{2_{g_{i}}})+0.3\ast X_{3_{g_{i}}}+V_{g_{i}}.\end{eqnarray}$$
The values for  $\unicode[STIX]{x1D6FD}_{2}$ and
 $\unicode[STIX]{x1D6FD}_{3}$ equal zero to enable calculation and comparison of the rejection rates for Wald tests of the null hypothesis that both are zero. The values for the explanatory variables are random draws from a Chi-squared distribution with three degrees of freedom. All experiments are done with 12, 24, 48 and 72 and for the ideal conditions with 96 clusters to provide a better examination of the asymptotic properties.
The estimators’ performance is compared in two ways. The first is the mean standardized error in the estimated standard error of the coefficients. Let  $s_{b}$ be the standard deviation of the distribution of simulated coefficients and
 $\bar{{\hat{s}}}_{b}$ be the mean estimated coefficient standard error. The mean standardized error is
 $\text{mste}=(\bar{{\hat{s}}}_{b}-s_{b})/s_{b}$.Footnote 8 This is the mean error in estimating the coefficient standard error standardized by the standard deviation of the coefficient distribution. For example, if
 $s_{b}=1$ and the mean estimated standard error is 0.9 then
 $\text{mste}=-0.1$. This term is then averaged for the five coefficients in the model to give the average mean standardized error (amse). The second comparison is the percent of the simulations in which the Wald test of the null hypothesis that
 $\unicode[STIX]{x1D6FD}_{2}=\unicode[STIX]{x1D6FD}_{3}=0$ is rejected for
 $p=0.05$.Footnote 9 Any value greater than 5% indicates this null hypothesis is being rejected at too high a rate, increasing the probability of a Type I error.
A complication arose in a small fraction of the simulations where the CESE estimated value for  $\unicode[STIX]{x1D70C}$ is greater than the estimated value for
 $\unicode[STIX]{x1D70E}_{v}^{2}$. This situation occurred in 0.22% of all the simulations and was concentrated in the most problematic scenarios. Over 40% of the occurrences are in the simulations with twelve clusters and heteroskedastic error terms drawn from exponential or chi-squared distributions or with highly correlated errors, which are less than 8% of all the simulations. An arbitrary strategy is used which resets
 $\hat{\unicode[STIX]{x1D70E}}^{2}=(\hat{\unicode[STIX]{x1D70C}}+0.02)$ whenever
 $\hat{\unicode[STIX]{x1D70C}}>\hat{\unicode[STIX]{x1D70E}}_{u}^{2}$.Footnote 10
3.1 Homogeneous Clusters
The initial experiments constitute the ideal sample for CRSE. There are ten observations per cluster, the explanatory variables for each cluster are drawn from distributions with the same mean and variance, and the stochastic terms are drawn from identical normal distributions for each observation and each cluster. For these experiments the number of clusters is expanded to ninety-six to observe the asymptotic properties better. The within cluster stochastic term covariance is created by specifying a cluster specific stochastic term that is included in each observation’s stochastic term,  $V_{g_{i}}=u_{g}+\unicode[STIX]{x1D716}_{g_{i}}$. The terms
 $u$ and
 $\unicode[STIX]{x1D716}$ are independent so the stochastic term variance is
 $\unicode[STIX]{x1D70E}_{v}^{2}=\unicode[STIX]{x1D70E}_{u}^{2}+\unicode[STIX]{x1D70E}_{\unicode[STIX]{x1D716}}^{2}$ and the covariance is
 $\unicode[STIX]{x1D70C}=\unicode[STIX]{x1D70E}_{u}^{2}$. For these simulations both stochastic terms are independently drawn from standard normal distributions. Let
 $r_{v}=\unicode[STIX]{x1D70E}_{u}^{2}/\unicode[STIX]{x1D70E}_{v}^{2}$ be the expected correlation among the stochastic terms in each cluster. The simulations are done with both a very low and a moderate expected correlation,
 $r_{v}=0.1$ and
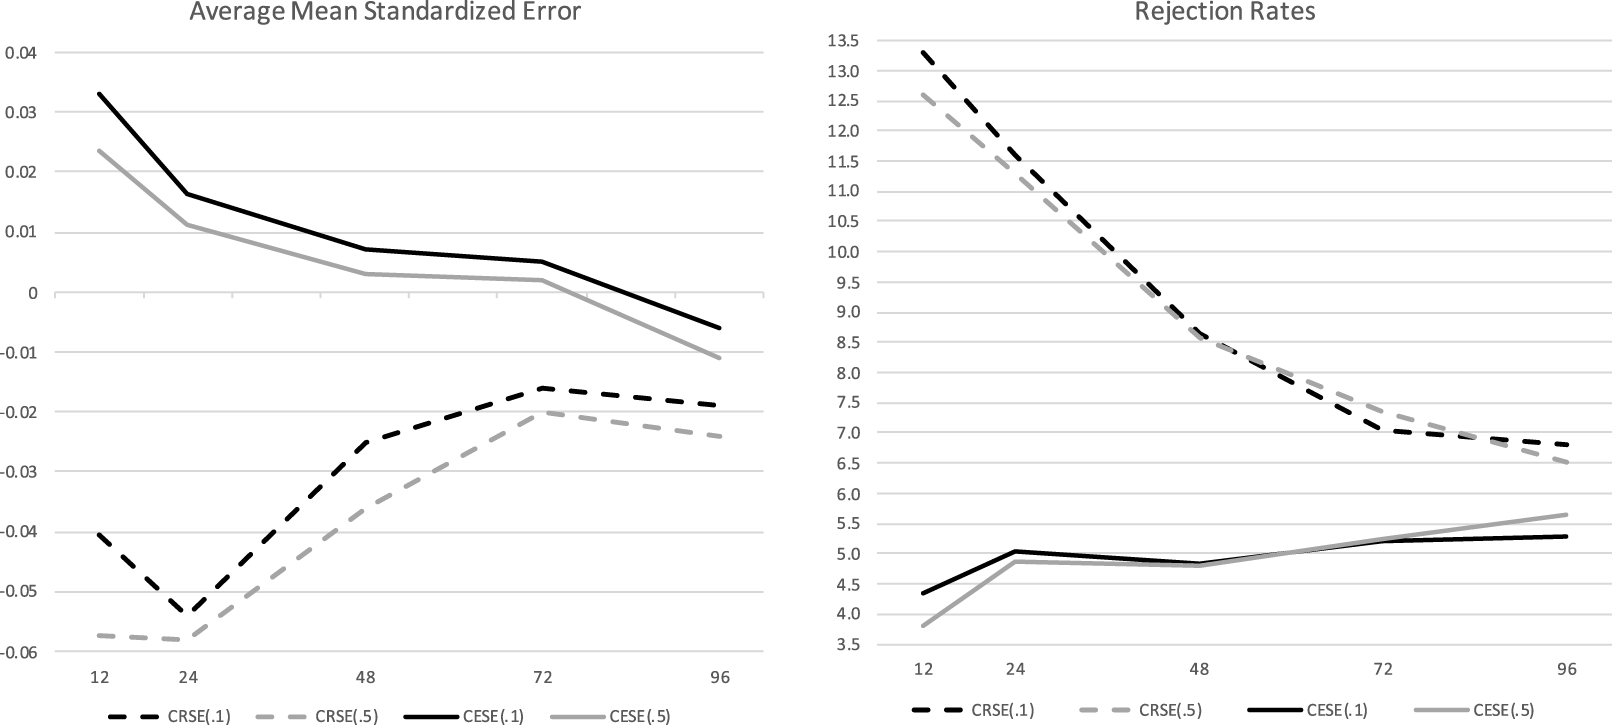
 $r_{v}=0.5$, respectively. The two panels in Figure 1 plot the performance measures for each estimator. The number in parentheses in the legend denotes the correlation of the stochastic terms within each cluster. Online appendix Table C.1 reports the numerical results.
Estimator performance with homogeneous clusters.

The CRSE asymptotic properties are very evident. The underestimates of the coefficient standard deviations range from about 5% with twelve clusters, to about 3% with forty-eight clusters to about 2% with ninety-six clusters. Similarly, the rejection rates drop from 13% with twelve clusters to about 6.5% with ninety-six clusters. The important result is that with forty-eight or fewer clusters, at least with the simulated data here, CRSE are quite unreliable and this unreliability increases sharply as the number of clusters decreases.
The CESE perform quite well for most numbers of clusters.Footnote 11 CESE overestimate the coefficient standard deviations by 2 to 3% with twelve clusters and underestimate them by less than 1% with ninety-six clusters. The CESE consistently reject the null hypothesis by close to the desired 5%. The CESE inferences are actually too conservative. In half the simulations the average rejection rate is less than 5%.
Differences with variations in the correlation of the stochastic terms in each cluster are quite small. Exceptions are the average mean standardized errors with twelve clusters, where the CRSE amse are 0.015 and the CESE amse are about 0.01 more negative with the higher correlation. For the CRSE and the CESE the differences in the rejection rates with the different amounts of interdependence are less than 0.4% except for the CRSE with twelve clusters, where the difference is about 0.7%. The subsequent question is whether cluster heterogeneity leads to larger differences with increased interdependence.
Summarizing, CRSE performed as expected with ideal data—poorly with only a few clusters and better as the number increased. The surprise is the apparent number of clusters for the asymptotic properties to dominate. MacKinnon and Webb (Reference MacKinnon and Webb2017, p. 234) cite Angrist and Pischke (Reference Angrist and Pischke2009) suggesting a “rule of 42,” that forty-two clusters are sufficient for reliable inference, but then argue there is no reliable rule of thumb on the necessary number of groups as the performance of CRSE is very sample specific. These simulations provide a further illustration of the MacKinnon and Webb concerns. The CESE are far less sensitive to the number of clusters, with relatively little change in performance particularly for rejection rates.
3.2 Estimator Performance with Heterogeneity
The next simulations move away from the ideal, homogeneous, sample with normally distributed stochastic terms in several important ways. These moves more closely approximate the situations encountered in Political Science. In these simulations stochastic terms are drawn from either a normal or an exponential distribution with three different types of heterogeneity.
(1) Number of observations per cluster. In these experiments there are five, ten or fifteen observations per cluster in equal proportions. This gives an average number of observations equal to that in the homogeneous experiments but with important variation.
(2) Heterogeneous explanatory variables. The heterogeneity explored here is the amount of covariate clustering, defined as the between cluster variance as a proportion of the variable’s total variance. When covariate clustering equals zero the explanatory variables in each cluster have the same mean and variance. The amount of covariate clustering equals 0, 0.3, 0.6, and 0.9.Footnote 12 The higher covariate clustering corresponds to analyses where factors such as institutions or electoral rules have very little within cluster variation.
(3) Heterogeneous stochastic terms. The stochastic terms are heteroskedastic between clusters, but homoskedastic within clusters.
All the comparisons begin with sixteen basic simulations—four with different numbers of clusters by four with different amounts of covariate clustering. These sixteen simulations are done with identically normally distributed stochastic terms and then with heteroskedastic exponentially distributed stochastic terms. In the heteroskedastic simulations the standard deviations for each of the stochastic components for each cluster,  $\unicode[STIX]{x1D70E}_{g_{u}}$ and
 $\unicode[STIX]{x1D70E}_{g_{\unicode[STIX]{x1D716}}}$, are drawn from a uniform distribution on the interval 0.1–2.0, giving variances that range from 0.01 to 4.0.Footnote 13 The intention is to create a maximal amount of heterogeneity. The simulations with zero covariate clustering and homogeneous normally distributed stochastic terms only differ from the previous simulations in that there are now an unequal number of observations per cluster, so comparing the results illustrates the effect of unequal numbers of observations per cluster.
The simulation designs keep the distribution of the number of observations per cluster constant as the number of clusters increases. As a consequence the total sample size increases as the number of clusters increases,  $N=10\ast G$. Equation (B 4) implies that CRSE performance varies with
 $G$ but not with
 $N$, which is consistent with MacKinnon and Webb (Reference MacKinnon and Webb2017, footnote 3, p. 237) and Esarey and Menger (Reference Esarey and Menger2019). An online appendix explores this implication with a series of simulations with
 $G=12$ but
 $N=480$ for the case with heterogeneous clusters and homoskedastic normally distributed stochastic terms. The results are consistent with expectations as all the methods’ performance are nearly identical with the different sample sizes but equal numbers of clusters.
3.2.1 Estimator Performance with Heteroskedastic and Exponentially Distributed Errors
These simulations compare the estimators’ performance in extremely unfavorable conditions—exponentially and heteroskedastically distributed stochastic terms—with that in better conditions—normally and homoskedastically distributed errors. The methods should perform worst in the former simulations and best in the latter. This provides a good picture of the range of the estimators’ performance and whether there is any commonality in that performance in quite different conditions. The emphasis here is a comparison of CRSE and CESE under these two conditions. The next section has a more detailed discussion of CESE performance in a range of conditions.
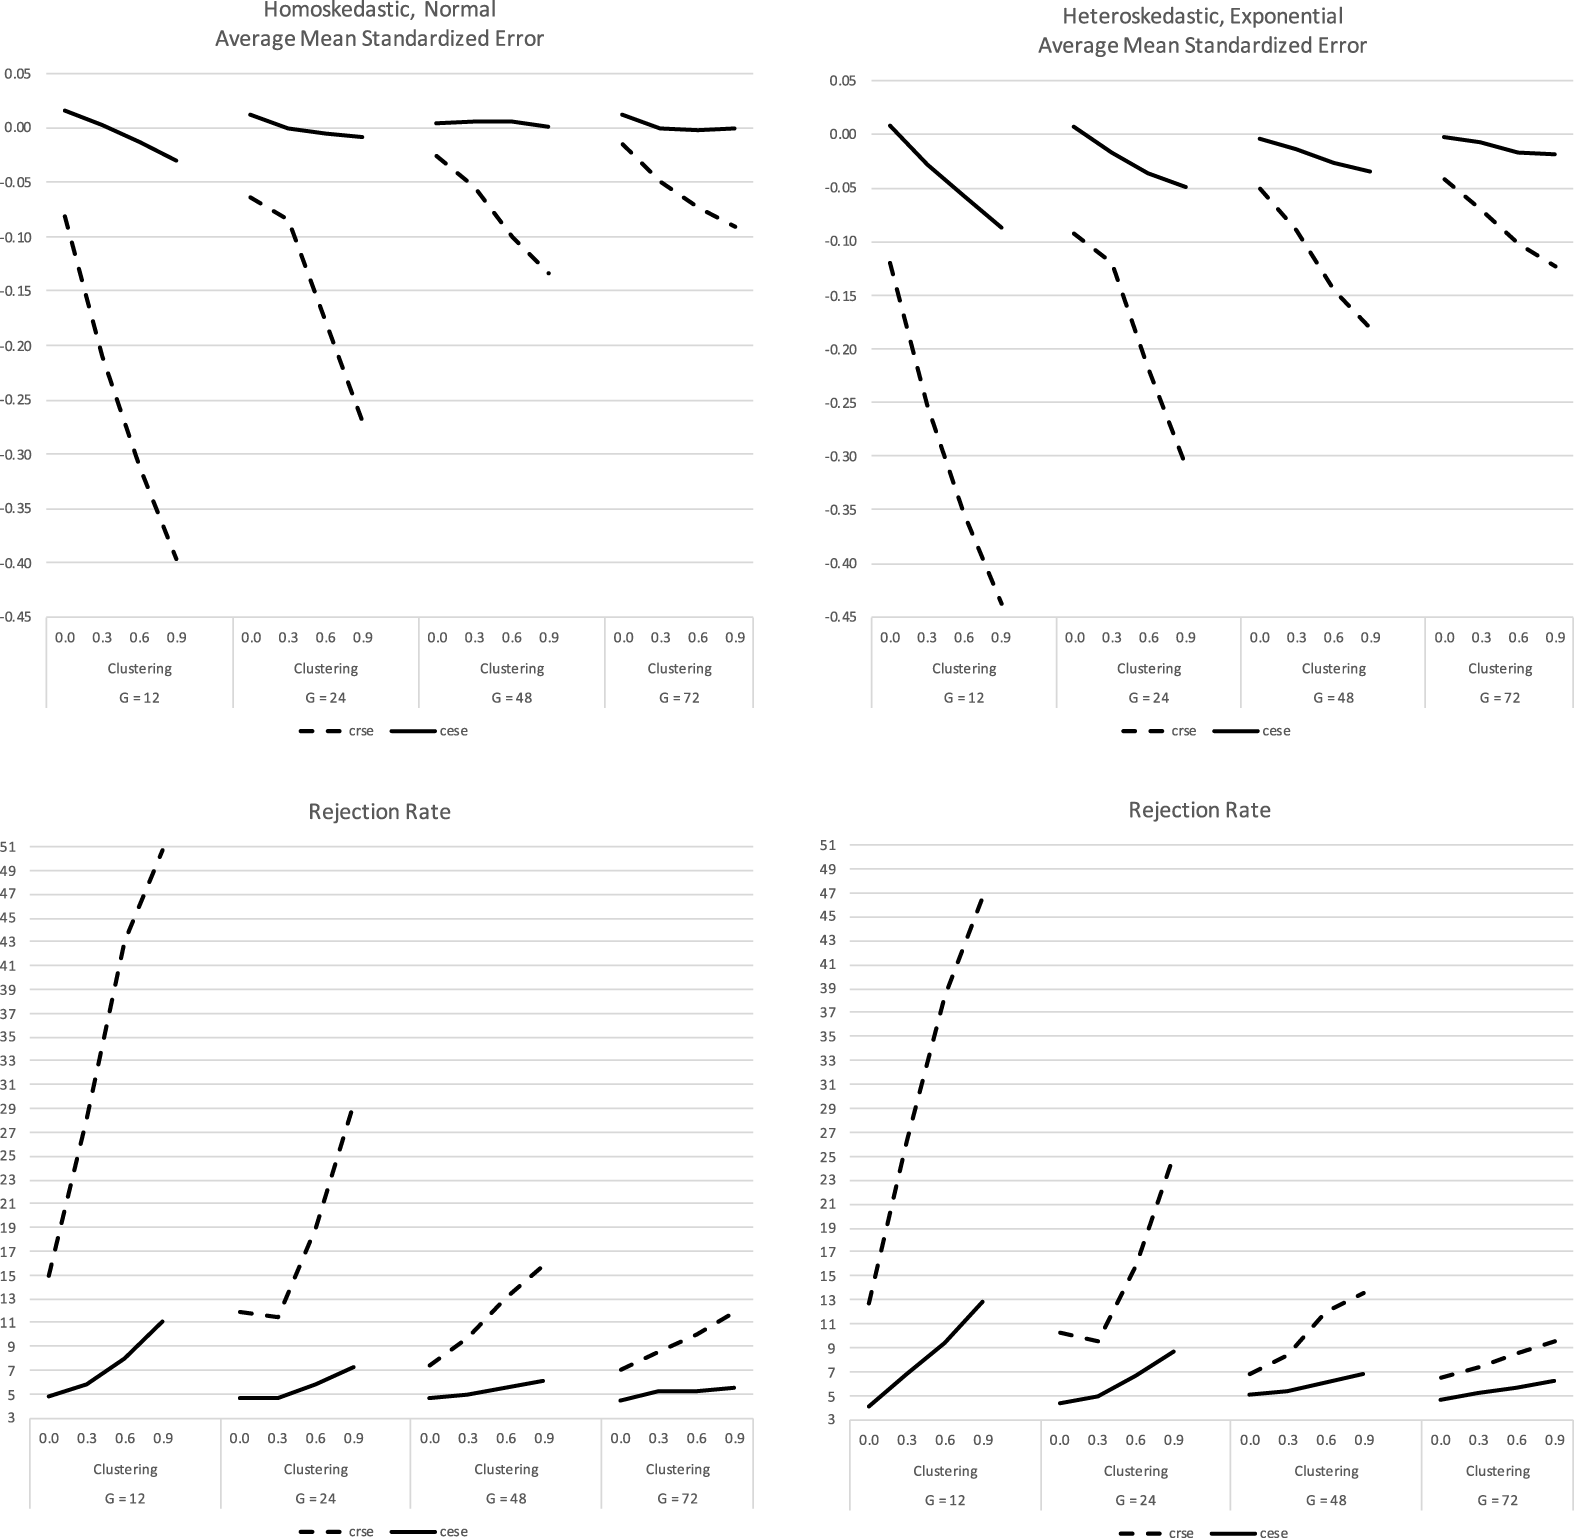
The left panel in Figure 2 plots the amse and rejection rates for the results for both estimators under the more favorable conditions. The right panels show these plots for heteroskedastically, exponentially distributed errors.Footnote 14 (All the results are reported in online appendix Table A.2.) In the most favorable case, with seventy-two clusters, no covariate clustering and homoskedastic normal error terms the CRSE underestimate the true standard deviations by 2% and reject the null hypothesis of no association 7% of the time. This performance is slightly worse than what is shown in Figure 1 when there are identical numbers of observations per cluster.
Estimator performance with heterogeneous clusters.

The CRSE performance declines as covariate clustering increases, even with a large number of clusters, and as the number of clusters decreases, even with no covariate clustering. This strong negative interaction between these conditions is predicted by Harden’s (Reference Harden2011) deflation factor shown in Footnote 6. The amse decreases to  $-0.09$ and the rejection rate increases to 12% with seventy-two clusters but very high covariate clustering, to
 $-0.08$ and 15% respectively with twelve clusters and no covariate clustering, and to
 $-0.40$ and an over 50% rejection rate with twelve clusters and very high covariate clustering. The performance falls between these values for intermediate numbers of clusters and covariate clustering.
The simulations with heteroskedastic and exponentially distributed stochastic terms, the most extreme conditions, shown in the right panels of Figure 2, present a similar pattern, but with an interesting paradox for CRSE. CRSE performance decreases sharply with increased covariate clustering and with decreasing numbers of clusters and again with a strong negative interaction between the two. The paradox is that the amse are worse but the rejection rates are lower by about 2% with the more extreme stochastic term distribution. The rejection rates are still too high for reliable inferences for all but the most favorable conditions, e.g. forty-eight or more clusters and no or a small amount of covariate clustering, where the rejection rates remain about 7%.
The CESE performance shown in Figure 2 provides a clear picture of the improvements offered by this estimator. In the best case with forty-eight or seventy-two clusters and no or a small amount of covariate clustering the CESE amse is about 0.07 smaller than with CRSE and the rejection rates are about the desired 5% compared to 7 or 8% for CRSE. The differences between CESE and CRSE increase rapidly as the number of clusters decreases and the amount of covariate clustering increases. For example, with twenty-four clusters and a moderate amount of covariate clustering the CRSE amse are about  $-0.20$ with rejection rates of 16%. The CESE amse range from
 $-0.01$ to
 $-0.04$ and rejection rates range from 6% to 7% depending upon the stochastic term distribution. Given these consistent disparities the remaining discussion focuses on the performance of the CESE in a wide range of circumstances.
3.2.2 CESE with Different Stochastic Term Distributions
CESE estimator performance with different error term distributions.

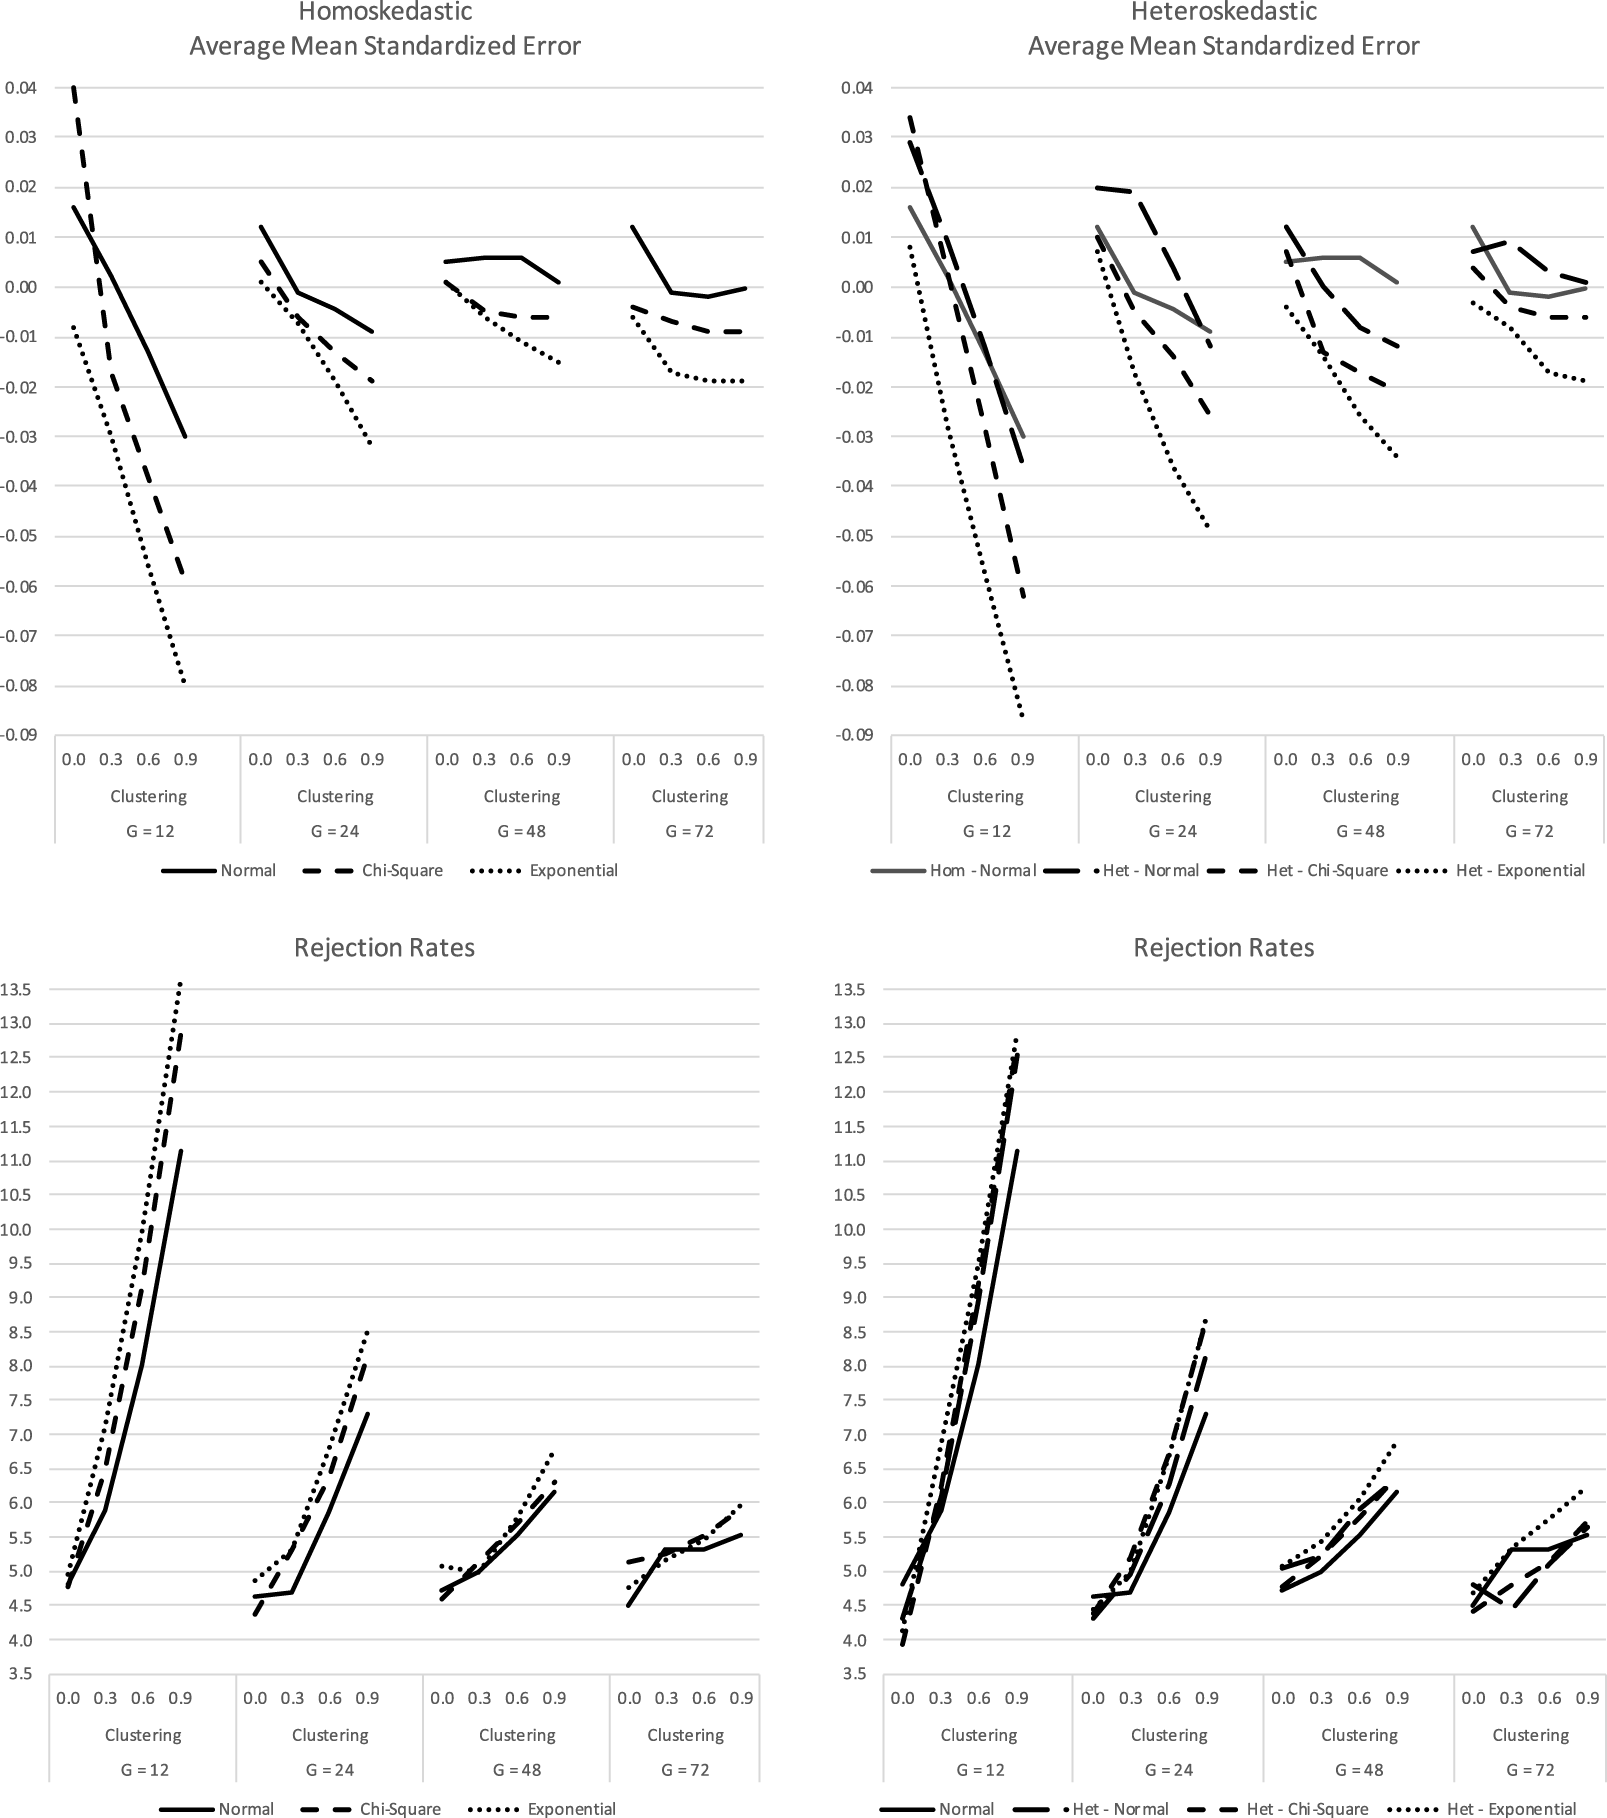
This section compares CESE performance across a broad range of stochastic term distributions to examine its robustness to deviations from the case with homoskedastic normally distributed errors. Stochastic terms drawn from a chi-square distribution with four degrees of freedom are added to the above distributions. These new simulations examine CESE performance with a skewed distribution but one not as extreme as the exponential. Figure 3 plots the CESE performance in the ninety-six different simulations. (The numerical results are shown in online Appendix A.3.) The figure highlights the performance differences associated with the different distributions, which are plotted as separate lines. The right hand plot, which shows the performance with heteroskedastic errors also includes the plots with homoskedastic normal errors, which is treated as the base case.
CESE perform quite well with a large number of clusters. With forty-eight and seventy-two clusters nine of forty-eight simulations had  $\text{amse}<-0.015$ and eight had rejection rates greater than 6%. All nine of the cases with large amses occurred with heterogeneous non-normally distributed errors and moderate to high amounts of covariate clustering and seven of the eight cases with high rejection rates occurred with the highest level of covariate clustering, which are the most problematic scenarios. Performance declines markedly as the number of clusters decreases, particularly with only twelve clusters. With twelve clusters half the simulations have an
 $\text{amse}<-0.02$ and rejection rates greater than 7%. Again, the poor performance is concentrated in the simulations with higher levels of covariate clustering.
Low levels of covariate clustering are also associated with good performance. In the simulations with no or low amounts of clustering only five have  $\text{amse}<-0.015$ and six have rejection rates higher than 5.5%. Increasing covariate clustering led to poorer performance. With the highest level of clustering nearly half have
 $\text{amse}<-0.02$ and half have rejection rates greater than 7%. These problems occur, with one exception, in experiments with twelve and twenty-four clusters.
Comparing performance with both covariate clustering and numbers of clusters makes the interaction between the two properties quite clear. As is evident in Figure 3 combining both a small number of clusters with high covariate clustering seriously degrades CESE performance. This combination of circumstances also increases the effects of having non-normal stochastic term distributions. In the experiments with twelve or twenty-four clusters and a moderate or high level of covariate clustering going from a normal distribution to an exponential increases the amse from  $-0.014$ to
 $-0.052$ and the rejection rate from 8.53 to 9.59. With forty-eight or seventy-two clusters and no or low covariate clusters the comparable range for the amse is 0.006 to
 $-0.007$ and is 4.88 to 5.07 for rejection rates. Comparing simulations with homoskedastic and heteroskedastic distributions showed very little difference or interaction effects.
The CESE method performs very well, even too conservatively at times, with large numbers of clusters, small amounts of covariate clustering, or homoskedastic normally distributed stochastic terms. This performance declines with each step away from these desirable conditions, with substantial negative interactions between the number of clusters and the amount of covariate clustering. Figure 3 shows that performance becomes unacceptable, such as rejection rates that exceed 8 or 9%, with extreme deviations from the ideal.
3.2.3 Differences in Cluster Stochastic Term Correlation
The final simulations in this section explore how differing amounts of stochastic term correlation within a cluster affect CESE performance with heterogeneous clusters. Equation (6) shows that the amount by which CRSE underestimate the true standard deviation varies with the stochastic term correlation,  $\unicode[STIX]{x1D70C}$, times the amount of heterogeneity in the clusters. This relationship predicts that increasing
 $\unicode[STIX]{x1D70C}$ will degrade the performance of the estimators more in the heterogeneous than in the homogeneous case. Recall that Figure 1 shows the performance of the CRSE and CESE estimators with different amounts of interdependence,
 $r_{v}=0.1$ and 0.5, for situations with completely homogeneous clusters—equal numbers of observations per cluster and identical distributions for the explanatory variables and the stochastic terms. We now make the same comparisons with the heterogeneous clusters used in the previous experiments with the expectation that increasing interdependence will decrease performance faster in the heterogeneous case. The heterogeneous sample has five, ten or fifteen observations per cluster, sets the covariate clustering level at 0.6 and uses normally homoskedastically distributed stochastic terms. The simulations are done for a low correlation,
 $r_{v}=0.1$, a moderate correlation,
 $r_{v}=0.5$ and a high correlation,
 $r_{v}=0.75$. The results for the simulations with homogeneous clusters are shown in online Appendix A.1 and those for the heterogeneous clusters are shown in online Appendix A.4.
Estimator performance with differences in interdependence.

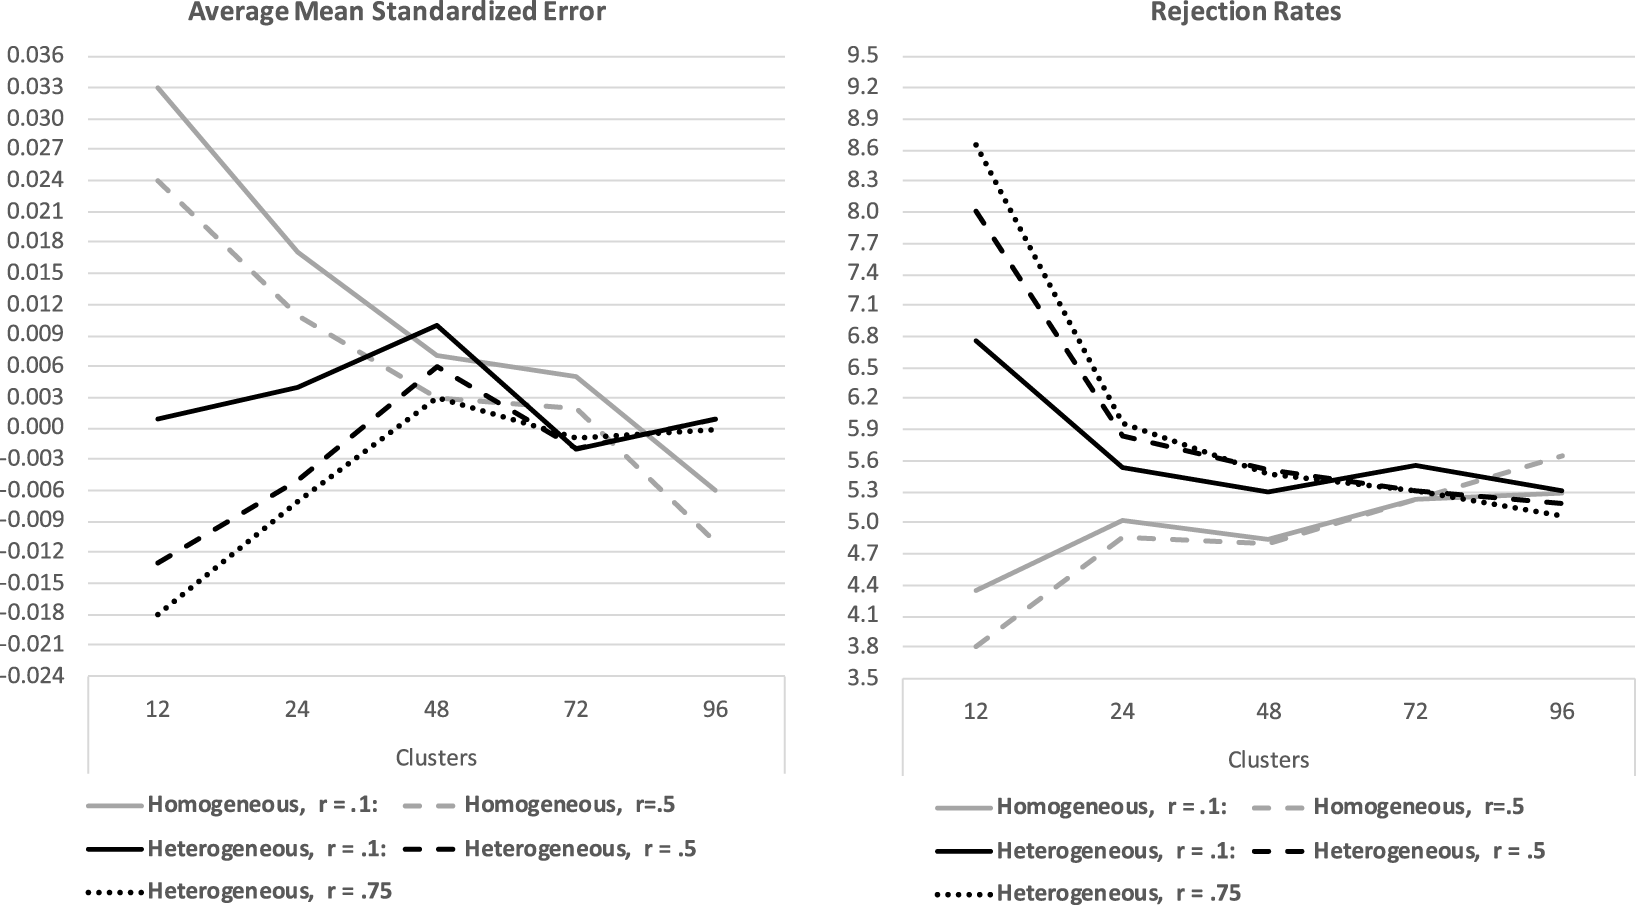
Figure 4 graphs the performance associated with the levels of interdependence for the homogeneous and heterogeneous simulations. (The homogeneous simulation plots repeat Figure 1.) One conclusion, evident in Figure 1, is that differences in stochastic term correlations have little effect on the CESE with homogeneous clusters. Not so with heterogeneous clusters. The performance gap is large between the low and high correlation cases with twelve clusters, is relatively small with twenty-four clusters and virtually disappears with forty-eight or more clusters. For example, with twelve clusters the amse are 0.00,  $-0.01$ and
 $-0.02$ and the rejection rates are 6.8%, 8.0% and 9.3% across the three correlation levels. With forty-eight clusters the amse are 0.01, 0.006 and
 $-0.005$ and the rejection rates are 5.3%, 5.5% and 5.6%. The conclusion is that the level of interdependence matters, but primarily with low numbers of heterogeneous clusters.
3.3 Bootstrapped Standard Errors
Most of the current literature examines bootstrapping as a correction for CRSE. The bootstrapping procedure in Harden (Reference Harden2011) returns an estimate for  $\unicode[STIX]{x1D6F4}_{b}$, which enables the full range of statistical tests such as the Wald tests explored in the previous simulations. This section repeats a selected set of the previous simulations using this bootstrap method to estimate coefficient standard errors and conduct the Wald tests and compares these results with the CESE. The scenarios are:
(A) homogeneous clusters with homoskedastic normally distributed stochastic terms;
(B) scenario A but with an unequal number of observations per cluster;
(C) scenario B but with covariate clustering equals 0.6;
(D) scenario C but with heteroskedastic error terms; and
(E) scenario C but with stochastic terms draws from a
 $\unicode[STIX]{x1D712}^{2}$ distribution.

These simulations compare cluster bootstrapped standard errors (CBSE) with CESE over this range of conditions. They are not a comprehensive examination of CBSE performance. All five simulations are done with the same data as the previous simulations.Footnote 15 The scenarios are ordered in terms of increasing difficulty for the CESE estimator.
The simulations followed Harden (Reference Harden2011, footnote 10) in using one thousand replications for the bootstrap. The simulations raise a concern with bootstrapping. The estimated  $\unicode[STIX]{x1D6F4}_{b}$ varied noticeably with the number of replications and the random number seed. For example, the average rejection rate for the simulation with twenty-four clusters and scenario C differed by more than 1% with two different seeds. (More on this in online Appendix C.) For consistency all reported results are done with 1000 replications and the random seed used for the CESE simulations, but it is important to understand that these estimates of coefficient uncertainty are themselves uncertain.
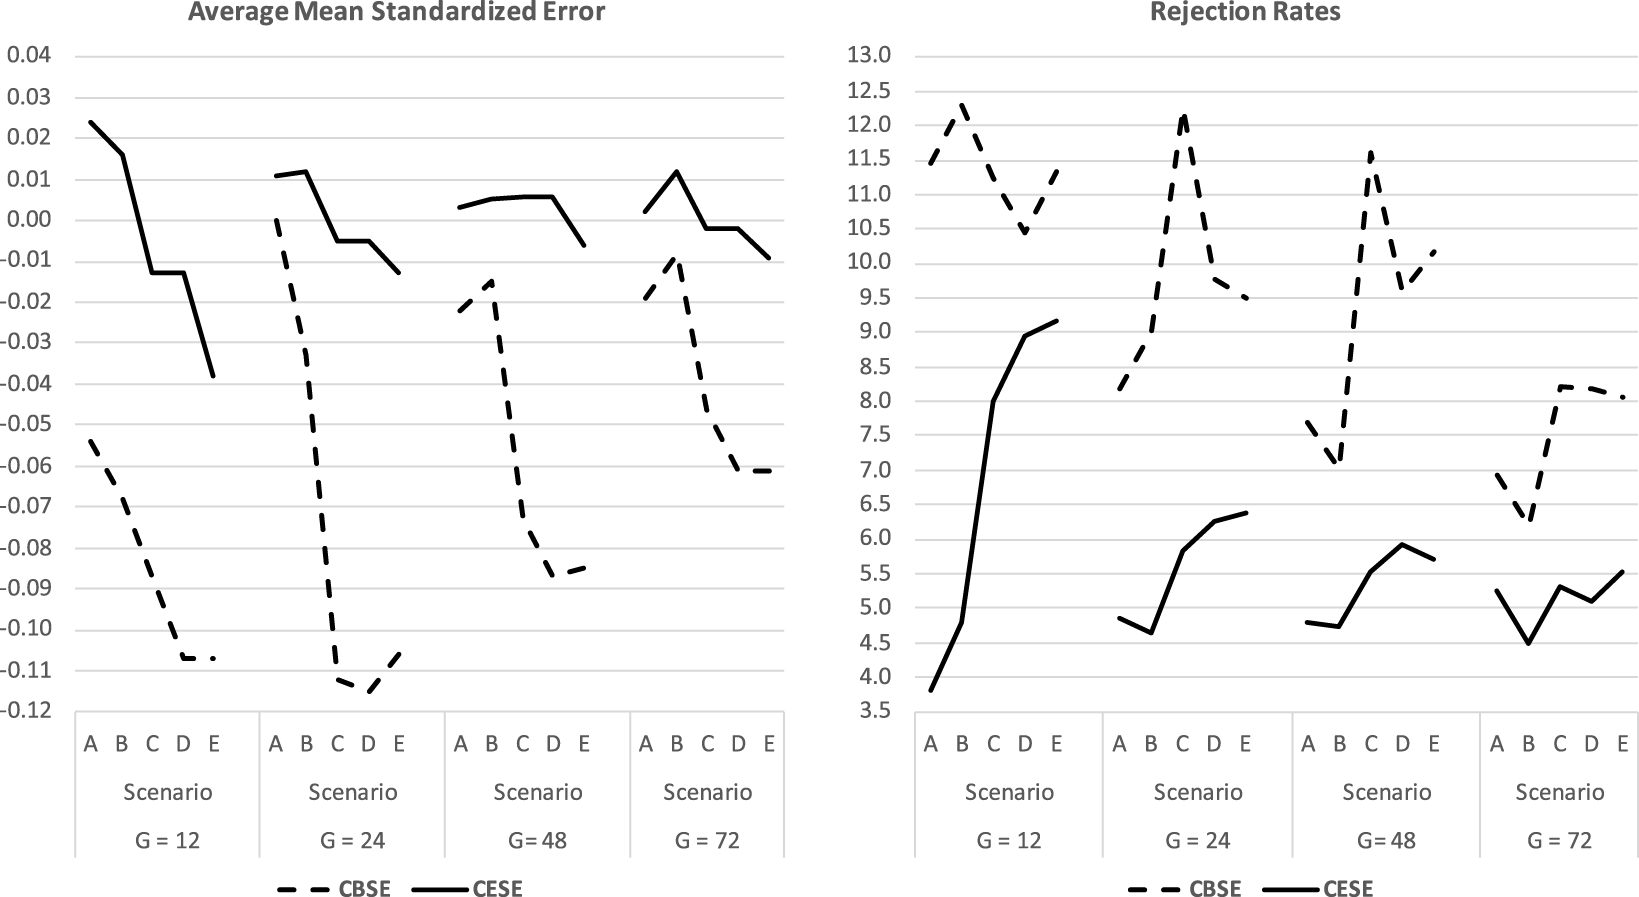
Figure 5 plots the amse and rejection rates for the CESE and CBSE for all five scenarios with varying numbers of clusters. The quick summary is that CESE have smaller errors than the CBSE method for all scenarios and numbers of clusters. The CBSE amse were substantially larger for all scenarios with only twelve clusters. Above twelve clusters there are relatively small differences between the CBSE and CESE amse for the first two scenarios, which include no covariate clustering and homoskedastic normal errors. As the scenarios deviated from these more ideal conditions the difference in the two amse grows substantially. For example, with twenty-four clusters the CESE and CBSE amse are both zero for scenario A, but the CBSE amse grow almost monotonically across the scenarios, reaching  $-0.11$ for scenarios C, D and E while the CESE
 $\text{amse}\geqslant -0.013$. With seventy-two clusters the CBSE amse are
 $-0.02$ to
 $-0.01$ and the CESE amse are weakly positive for scenarios A and B. But, for scenarios C to E where the scenarios deviate from these ideal cases the CBSE amse decrease to
 $-0.05$ and
 $-0.06$ while all the CESE amse are
 $-0.01$ or higher.
CESE & bootstrapped standard errors.

The CBSE rejection rates follow a somewhat irregular pattern though all are higher than the CESE measures. There is very little variation in CBSE rejection rates across the simulations with twelve clusters though they are much higher than the CBSE rejection rates even in scenarios D and E, which present the greatest difficulties for CESE. With twenty-four and forty-eight clusters CBSE rejection rates increase moving from scenarios A to E with a sharp spike for scenario C. In the most favorable simulations the CBSE rejection rates are just over 6% and increase substantially after that for scenarios C, D, and E, being 10% or more in over half the fifteen simulations where  $G<72$. By comparison the CESE rejection rates are less than 6% in ten of the same fifteen simulations. With seventy-two clusters the CBSE rejection rates vary from 6.2% to 8.2% while the CESE rejection rates range from 4.5% to 5.5%.
The Monte Carlo results show that CBSE perform well in simulations with a moderate to large number of relatively homogeneous clusters,  $G>12$ and scenarios A and B. With
 $G=12$ and/or heterogeneity across the clusters and in the error terms the CBSE amse become increasingly negative and the rejection rates increase beyond what should be acceptable. CESE are much less sensitive to these variations, except with
 $G=12$ and heterogeneous clusters and stochastic terms, though in all scenarios they perform better than CBSE.Footnote 16
3.4 Monte Carlo Simulation Summary
There are several take-aways from the simulations. As is now well established CRSE seriously underestimate the standard deviation of the simulated coefficient distributions and produce confidence intervals that are far too narrow, leading to rejection rates that are substantially too high except with homogeneous clusters and a large number of clusters. A common solution is cluster bootstrapped standard errors, particularly as presented in Harden (Reference Harden2011) where the full coefficient variance–covariance matrix is estimated. In the simulations done here this method is a vast improvement on CRSE, but still underestimates the actual coefficient standard deviations, except for data with very homogeneous clusters, and over rejects a null hypothesis using a Wald test based on the estimated coefficient variance–covariance matrix. An option proposed here is the CESE correction, which has better estimated standard errors and rejection rates. The quality of this estimator decreases as the number of clusters decreases, as the amount of covariate clustering increases, and with heterogeneous stochastic terms. In terms of relative performance in the simulations conducted here the CESE method outperformed the CBSE method particularly as the number of clusters decreases, as the amount of covariate heterogeneity increases and as the stochastic terms deviate from being homoskedastically normally distributed. These are the circumstances where CESE perform poorly, but their performance does not decline as fast or as far as the other methods examined.Footnote 17
4 Examples
We compare the CRSE, CBSE and CESE estimators with two examples.Footnote 18 One from state politics, Brown, Jackson, and Wright (Reference Brown, Jackson and Wright1999), which Harden (Reference Harden2011) uses to compare CRSE and CBSE. The other from comparative politics, Elgie et al. (Reference Elgie, Bueur, Dolez and Laurent2014). The former has relatively homogeneous clusters as each state has four observations, which should favor CRSE and CBSE. In the comparative politics example the number of observations per cluster ranges from one to thirty-two, which should present problems for CRSE and likely CBSE.
4.1 State Politics
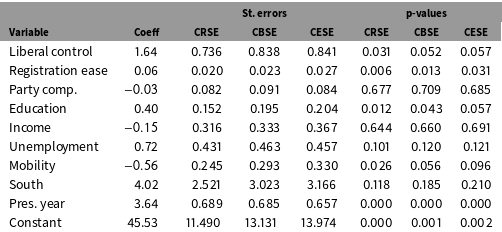
Harden (Reference Harden2011) replicates Brown, Jackson, and Wright (Reference Brown, Jackson and Wright1999)’s model of state voter registration.Footnote 19 The propositions are that liberal (Democratic) control of the legislature, ease of registration, and party competition are associated with higher levels of voter registration. Controls for education, income, residential mobility, unemployment, south, and presidential election years are included. Harden estimates their model with both CRSE and CBSE. Liberal control and ease of registration are statistically significant with CRSE along with the education and mobility controls. With CBSE both liberal party control and mobility are no longer significant. Harden [pp. 235 and 236], however, makes the point that liberal control, “…is just on the edge of significance with CBSE ( $t=1.94$).” and “…the authors have good reason to interpret a t-value of 1.94 as support for their hypothesis.”
The registration equation is replicated using CRSE, CBSE and CESE.Footnote 20 Table 1 displays the respective coefficients, standard errors and p-values.Footnote 21 These data should favor CRSE and CBSE as there are an equal number of observations per cluster. The results replicate Harden’s findings with CBSE standard errors being almost 15% larger than the CRSE standard errors. The CESE standard errors are, on average, 5% larger than the CBSE standard errors. Consistent with the simulations, CESE attach the most uncertainty to the coefficient estimates and CRSE the least with the uncertainty implied by CBSE being much closer to that with CESE.
State voter registration rates.

This increasing uncertainty has implications for those who persist in reporting statistical significance. With CRSE a 95% confidence interval for the Liberal control, registration ease, education and mobility coefficients excludes zero. With CBSE this list is reduced to registration ease and education and with CESE only the registration ease coefficient meets this criteria.
4.2 Comparative Politics
The second example provides an important contrast to the state politics example as there are a wide range of observations per cluster making the clusters very heterogeneous. It also includes an interaction term so there is a need to use a joint test of a pair of coefficients. The example is a slightly modified version of a model relating the effective number of parties to the number of presidential candidates and presidential power presented by Elgie et al. (Reference Elgie, Bueur, Dolez and Laurent2014) building on work of Golder (Reference Golder2006) and Hicken and Stoll (Reference Hicken and Stoll2012).Footnote 22 They relate the number of effective legislative parties to the number of presidential candidates, a measure of presidential power, the proximity of presidential and legislative elections, the effective number of ethnic groups and the log of average district magnitudes and two interaction terms. The model the authors say shows the strongest relationship between the effective number of legislative parties and presidential power and the effective number of candidates is shown in a marginal effects plot in their Figure 4 and included in the replication file but the coefficients and standard errors are not shown in the table of results.Footnote 23
Their Figure 4 model is re-estimated with three changes that expand the sample and number of countries. The databases developed by Golder and colleagues (Golder Reference Golder2005; Bormann and Golder Reference Bormann and Golder2013), which form the basis for most of this comparative research, contain data that permit replacement of missing values in the proximity and log district magnitude variables. This adds twenty observations but does not increase the number of countries as these countries had nonmissing values for these variables. Seven missing values in the preferred measure of presidential power are replaced by the values in the alternative measure that Elgie et al. use in most of their analyses, which adds seven cases and two countries.Footnote 24 These changes expand the number of observations from 281 to 310 and increase the number of countries from 47 to 51.Footnote 25 The results of these changes favor their core hypothesis as the two coefficients relating the effective number of legislative parties to presidential power are slightly larger, though within sampling variability, and are individually and collectively more significant.Footnote 26
Model for number of legislative parties.

a Wald test that  $\unicode[STIX]{x1D6FD}_{2}=\unicode[STIX]{x1D6FD}_{3}=0$.
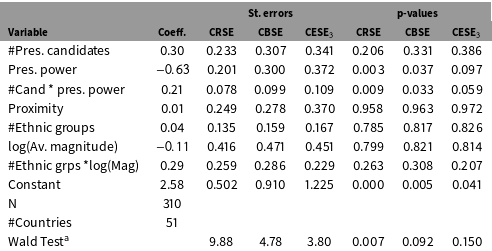
Table 2 shows the estimated coefficients, standard errors and continuous p-values. The CESE standard errors are the largest, being about 55 and 20% larger than the CRSE and CBSE standard errors, respectively, for the four institutional variables.Footnote 27 As in the previous example, CRSE imply a much higher level of certainty about the coefficient distributions than either CBSE or CESE with the CBSE estimates closer to the CESE estimates than to the CRSE estimates. For example, the estimated relationship between the number of legislative parties and presidential power is  $-0.63$. The estimated standard deviation of the distribution from which this value is drawn ranges from 0.20 with the CRSE to 0.37 with CESE.
The standard error differences are consequential for statistical inference for those who rely on these evaluations. A major point in Hicken and Stoll (Reference Hicken and Stoll2012) and Elgie et al. (Reference Elgie, Bueur, Dolez and Laurent2014) is a significant relationship between the number of legislative parties and presidential power and its interaction with the number of candidates. The p-value of the coefficient on presidential power increases from less than 0.01 level with the CRSE to less than the 0.05 level with the CBSE to just less than 0.10 level with CESE standard errors. The p-value for the interaction term coefficient increases from 0.009 to 0.032 to 0.059 with the CRSE, CBSE and CESE methods, respectively. At the conventional 95% confidence level these two coefficients are only significant with the first two methods.
Wald tests of the joint hypothesis that  $\unicode[STIX]{x1D6FD}_{2}=\unicode[STIX]{x1D6FD}_{3}=0$, meaning no association between the number of legislative parties and the presidential power variables, are 9.88, 4.77 and 3.80 with p-values of 0.007, 0.092 and 0.150 for the CRSE, CBSE and CESE estimates, respectively. The CRSE results clearly reject while the CBSE and CESE results do not reject this null hypothesis at the 95% significance level. The CBSE value, however, is significant at the 0.10 level. This result combined with the CBSE tests of the individual coefficients, which reject the null hypothesis of no association for the two presidential power variables, might cause some doubt about not rejecting the null hypothesis, depending upon ones tolerance for Type I and Type II errors. The CESE results leave much less doubt about not rejecting the null hypotheses.
The Comparative Politics results parallel the State Politics results and the simulations. The CESE estimates are the most conservative and the CRSE estimates the least conservative. Further, the CBSE and CESE are more consistent with each other and very different from the CRSE. The important difference between the CBSE and CESE results is that the CBSE results reject the null hypothesis that the individual coefficients on the two presidential power variables, including the #Candidates*Pres. Power interaction term, are zero while the CESE estimates do not.
5 Concluding Remarks
The comparisons shown in Tables 1 and 2 and their substantive implications along with the analytical discussions and the Monte Carlo simulations indicate that the choice of an estimation method has important consequences. Resort to CRSE when analyzing grouped data is unwise, particularly with a small number of clusters, highly clustered explanatory variables or non-normally distributed errors. The sensitivity of CRSE to covariate clustering is seldom discussed in the literature, except for Harden (Reference Harden2011), but for many Political Science applications this will be a critical factor as many of the important variables have little variation within clusters. A method such as CESE that estimates the within cluster variance–covariance matrix and uses that estimate to compute the standard errors performs much better in simulations and in the examples is far less willing to reject a null hypothesis of no association than are methods based on the sandwich estimator associated with Liang and Zeger (Reference Liang and Zeger1986). Bootstrap methods, commonly proposed as the alternative to CRSE, perform much better than CRSE but still have smaller estimated standard errors and higher rejection rates than CESE in both the simulations and the examples. In any specific application one may want to compare the performance of the different methods for the data at hand using the type of Monte Carlo simulations undertaken here given their likely sample specific performance.
The next challenge is to explore if, or how, the CESE estimator can be extended to the general linear model, which includes the important class of limited dependent variables, counts, etc. We lay out a possible way to begin this exploration. The discussion is restricted to the general linear model where  $Y_{i}=f(X_{i}\unicode[STIX]{x1D6FD})=f(z_{i})$ and the log likelihood function for observation
 $i$ is
 $L_{i}^{\ast }=g(z_{i})$. Let
 $\unicode[STIX]{x1D6FF}_{i}=\unicode[STIX]{x2202}L_{i}^{\ast }/\unicode[STIX]{x2202}z_{i}$ so that
 $\unicode[STIX]{x2202}L_{i}^{\ast }/\unicode[STIX]{x2202}\unicode[STIX]{x1D6FD}_{k}=\unicode[STIX]{x1D6FF}_{i}X_{ik}$. The MLE estimates for
 $\unicode[STIX]{x1D6FD}$ are obtained by solving the following set of equations,
 $\unicode[STIX]{x2202}L^{\ast }/\unicode[STIX]{x2202}\unicode[STIX]{x1D6FD}_{k}=\sum _{i=1}^{N}\unicode[STIX]{x1D6FF}_{i}\unicode[STIX]{x1D6FD}_{k}=0,k=1,\ldots ,K$. Further, let
 $D$ equal the inverse of the Hessian matrix of second derivatives,
 $D=[\unicode[STIX]{x2202}^{2}L^{\ast }/\unicode[STIX]{x2202}\unicode[STIX]{x1D6FD}_{k}\unicode[STIX]{x2202}\unicode[STIX]{x1D6FD}_{k^{\prime }}]^{-1}$. The sandwich estimate for the variance–covariance matrix of the MLE coefficients is
 $$\begin{eqnarray}V(\hat{\unicode[STIX]{x1D6FD}})=D^{-1}[X^{\prime }(\unicode[STIX]{x1D6FF}\unicode[STIX]{x1D6FF}^{\prime })X]D^{-1}.\end{eqnarray}$$
With the OLS model  $\unicode[STIX]{x1D6FF}_{i}=(Y_{i}-X_{i}\unicode[STIX]{x1D6FD})=u_{i}$. For the standard OLS model with iid stochastic terms
 $E(uu^{\prime })=\unicode[STIX]{x1D70E}_{u}^{2}I$ and Equation (13) becomes the familiar
 $V(\hat{\unicode[STIX]{x1D6FD}})=\unicode[STIX]{x1D70E}_{u}^{2}(X^{\prime }X)^{-1}$. With clustered data Equation (13) becomes Equation (1). Substituting the residuals
 $e_{i}$ for
 $u_{i}$ gives Equation (3), the expression for CRSE.
Equation (13) is the starting point in developing the equivalent to CESE for the general linear model. It will be necessary to find expressions for  $\unicode[STIX]{x1D6FF}_{i}$ and then relate the matrix
 $\unicode[STIX]{x1D6FF}\unicode[STIX]{x1D6FF}^{\prime }$ to the interdependence within clusters. Although these steps are not obvious for many applications the logit model for binary outcomes offers an example of how one might begin. In the logit model
 $L_{i}^{\ast }=-\log (1+e^{-z_{i}})$ for
 $Y_{i}=1$ and
 $-\log (1+e^{z_{i}})$ for
 $Y_{i}=0$. With
 $P_{i}$ denoting the probability that
 $Y_{i}=1$ the resulting expressions for
 $\unicode[STIX]{x1D6FF}_{i}$ are:
 $$\begin{eqnarray}\unicode[STIX]{x1D6FF}_{i}=e^{-z_{i}}/(1+e^{-z_{i}})=1-P_{i}:\;\;\;Y_{i}=1,\end{eqnarray}$$
and
 $$\begin{eqnarray}\unicode[STIX]{x1D6FF}_{i}=-e^{z_{i}}/(1+e^{z_{i}})=0-P_{i}:\;\;\;Y_{i}=0.\end{eqnarray}$$
Fortuitously the  $\unicode[STIX]{x1D6FF}_{i}$ are analogous to the stochastic terms in the OLS model as they indicate how the observed outcomes, which are measured as zeros and ones, differ from the true probability that
 $Y_{i}=1$. If after calculating the logit estimates for
 $\unicode[STIX]{x1D6FD}$ the predicted probabilities
 $\hat{P}_{i}$ are calculated the residuals
 $d_{i}=1-\hat{P}_{i}$ or
 $d_{i}=-\hat{P}_{i}$ can be substituted for
 $\unicode[STIX]{x1D6FF}$ in Equation (13). The next, and most difficult step, is to derive an expression for
 $dd^{\prime }$ as a function of the true variances and covariances within clusters, analogous to Equations (9) and (11), that can be used to estimate
 $\unicode[STIX]{x1D6FF}\unicode[STIX]{x1D6FF}^{\prime }$ in Equation (13).
Data Availability Statement
Replication materials can be found at Jackson (Reference Jackson2019).
Supplementary material
For supplementary material accompanying this paper, please visit https://doi.org/10.1017/pan.2019.38.
Appendix A. Expression for $E(e_{g}e_{g}^{\prime })$

This appendix develops the expression Equation (4).
 $$\begin{eqnarray}\displaystyle E(e_{g}e_{g}^{\prime }) & = & \displaystyle E[(Y_{g}-X_{g}b)(Y_{g}-X_{g}b)^{\prime }]=E\{[V_{g}-X_{g}(b-\unicode[STIX]{x1D6FD})][V_{g}-X_{g}(b-\unicode[STIX]{x1D6FD})]^{\prime }\}\nonumber\\ \displaystyle & = & \displaystyle E\{[V_{g}-X_{g}(X^{\prime }X)^{-1}X^{\prime }V][V_{g}-X_{g}(X^{\prime }X)^{-1}X^{\prime }V]^{\prime }\}\nonumber\\ \displaystyle & = & \displaystyle E(V_{g}V_{g}^{\prime })-E(V_{g}V^{\prime })X(X^{\prime }X)^{-1}X_{g}^{\prime }-X_{g}(X^{\prime }X)^{-1}X^{\prime }E(VV_{g}^{\prime })\nonumber\\ \displaystyle & & \displaystyle +\,X_{g}(X^{\prime }X)^{-1}X^{\prime }E(VV^{\prime })X(X^{\prime }X)^{-1}X_{g}^{\prime }\nonumber\\ \displaystyle & = & \displaystyle \unicode[STIX]{x1D6F4}_{g}-\unicode[STIX]{x1D6F4}_{g}P_{g}-P_{g}\unicode[STIX]{x1D6F4}_{g}+X_{g}(X^{\prime }X)^{-1}\left(\mathop{\sum }_{g=1}^{G}X_{g}^{\prime }\unicode[STIX]{x1D6F4}_{g}X_{g}\right)(X^{\prime }X)^{-1}X_{g}^{\prime },\end{eqnarray}$$
where  $P_{g}$ is the projection matrix
 $P_{g}=X_{g}(X^{\prime }X)^{-1}X_{g}^{\prime }$. This equation makes repeated use of the condition that the stochastic terms are independent across clusters.
Equation (A 1) can be extended with repeated use of the assumption of homogeneity within clusters and the expression that  $\unicode[STIX]{x1D6F4}_{g}=\unicode[STIX]{x1D70C}\unicode[STIX]{x1D704}_{g}\unicode[STIX]{x1D704}_{g}^{\prime }+(\unicode[STIX]{x1D70E}_{v}^{2}-\unicode[STIX]{x1D70C})I_{g}$. (Recall that
 $\unicode[STIX]{x1D704}_{g}$ is an
 $n_{g}~x~1$ vector of ones and
 $I_{g}$ is an
 $n_{g}~x~n_{g}$ identity matrix.) Use this expression to rewrite Equation (A 1) as,
 $$\begin{eqnarray}\displaystyle E(e_{g}e_{g}^{\prime }) & = & \displaystyle \unicode[STIX]{x1D70C}_{g}\unicode[STIX]{x1D704}_{g}\unicode[STIX]{x1D704}_{g}^{\prime }+(\unicode[STIX]{x1D70E}_{g}^{2}-\unicode[STIX]{x1D70C}_{g})I_{g}-2(\unicode[STIX]{x1D70E}_{g}^{2}-\unicode[STIX]{x1D70C}_{g})P_{g}-\unicode[STIX]{x1D70C}_{g}(P_{g}\unicode[STIX]{x1D704}_{g}\unicode[STIX]{x1D704}_{g}^{\prime }+\unicode[STIX]{x1D704}_{g}\unicode[STIX]{x1D704}_{g}^{\prime }P_{g})\nonumber\\ \displaystyle & & \displaystyle +\,X_{g}(X^{\prime }X)^{-1}\left\{\mathop{\sum }_{g=1}^{G}[(\unicode[STIX]{x1D70E}_{g}^{2}-\unicode[STIX]{x1D70C}_{g})X_{g}^{\prime }X_{g}+\unicode[STIX]{x1D70C}_{g}X_{g}^{\prime }\unicode[STIX]{x1D704}_{g}\unicode[STIX]{x1D704}_{g}^{\prime }X_{g}]\right\}(X^{\prime }X)^{-1}X_{g}^{\prime }\nonumber\\ \displaystyle & = & \displaystyle \unicode[STIX]{x1D70C}_{g}\unicode[STIX]{x1D704}_{g}\unicode[STIX]{x1D704}_{g}^{\prime }+(\unicode[STIX]{x1D70E}_{g}^{2}-\unicode[STIX]{x1D70C}_{g})I_{g}-2(\unicode[STIX]{x1D70E}_{g}^{2}-\unicode[STIX]{x1D70C}_{g})P_{g}-\unicode[STIX]{x1D70C}_{g}(P_{g}\unicode[STIX]{x1D704}_{g}\unicode[STIX]{x1D704}_{g}^{\prime }+\unicode[STIX]{x1D704}_{g}\unicode[STIX]{x1D704}_{g}^{\prime }P_{g})\nonumber\\ \displaystyle & & \displaystyle +\,(\unicode[STIX]{x1D70E}_{g}^{2}-\unicode[STIX]{x1D70C}_{g})X_{g}(X^{\prime }X)^{-1}\left(\mathop{\sum }_{g=1}^{G}X_{g}^{\prime }X_{g}\right)(X^{\prime }X)^{-1}X_{g}^{\prime }\nonumber\\ \displaystyle & & \displaystyle +\,\unicode[STIX]{x1D70C}_{g}X_{g}(X^{\prime }X)^{-1}\left(\mathop{\sum }_{g=1}^{G}X_{g}^{\prime }\unicode[STIX]{x1D704}_{g}\unicode[STIX]{x1D704}_{g}^{\prime }X_{g}\right)(X^{\prime }X)^{-1}X_{g}^{\prime }\nonumber\\ \displaystyle & = & \displaystyle \unicode[STIX]{x1D70E}_{g}^{2}(I_{g}-P_{g})+\unicode[STIX]{x1D70C}_{g}\left[\vphantom{\left(\mathop{\sum }_{g=1}^{G}\right)}\unicode[STIX]{x1D704}_{g}\unicode[STIX]{x1D704}_{g}^{\prime }-(I_{g}-P_{g})-(P_{g}\unicode[STIX]{x1D704}_{g}\unicode[STIX]{x1D704}_{g}^{\prime }+\unicode[STIX]{x1D704}_{g}\unicode[STIX]{x1D704}_{g}^{\prime }P_{g})\right.\nonumber\\ \displaystyle & & \displaystyle +\left.X_{g}(X^{\prime }X)^{-1}\left(\mathop{\sum }_{g=1}^{G}X_{g}^{\prime }\unicode[STIX]{x1D704}_{g}\unicode[STIX]{x1D704}_{g}^{\prime }X_{g}\right)(X^{\prime }X)^{-1}X_{g}^{\prime }\right]\nonumber\\ \displaystyle & = & \displaystyle \unicode[STIX]{x1D70E}_{g}^{2}Q_{1}+\unicode[STIX]{x1D70C}_{g}Q_{2},\end{eqnarray}$$
where  $Q_{1}$ and
 $Q_{2}$ are functions of the observed explanatory variables. This equation shows that
 $E(e_{g}e_{g}^{\prime })$ is a linear function of the unknown terms
 $\unicode[STIX]{x1D70E}_{g}^{2}$ and
 $\unicode[STIX]{x1D70C}_{g}$.
Appendix B. CRSE—Bivariate Case
This appendix uses the expression for  $E(e_{g}e_{g}^{\prime })$ from Equation (A 1) in the previous appendix to derive the CRSE estimate for the variance of the estimate in the bivariate case. In this derivation all variables are mean centered, e.g.
 $x_{gn}=(X_{gn}-\bar{X})$, removing the constant term. The bivariate case along with mean centered variables greatly simplify the algebra because the term
 $(X^{\prime }X)^{-1}$ reduces to the scalar
 $1/NV_{x}$ where
 $N$ is the total sample size and
 $V_{x}$ is the full sample variance of the explanatory variable. We also simplify the model by assuming homogeneous error terms,
 ${\unicode[STIX]{x1D6F4}_{v}}_{g}=\unicode[STIX]{x1D6F4}_{v}$ for all
 $g$.
Begin with the expression for  $\sum _{g=1}^{G}x_{g}^{\prime }\unicode[STIX]{x1D6F4}_{v}x_{g}$.
 $$\begin{eqnarray}\displaystyle \mathop{\sum }_{g=1}^{G}x_{g}^{\prime }\unicode[STIX]{x1D6F4}_{v}x_{g} & = & \displaystyle \mathop{\sum }_{g=1}^{G}(x_{g1},x_{g2},\ldots ,x_{gn_{g}})\left(\begin{array}{@{}cccc@{}}\unicode[STIX]{x1D70E}^{2} & \unicode[STIX]{x1D70C} & \ldots & \unicode[STIX]{x1D70C}\\ \unicode[STIX]{x1D70C} & \unicode[STIX]{x1D70E}^{2} & \ldots \, & \unicode[STIX]{x1D70C}\\ \vdots & \vdots & \ddots & \vdots \\ \unicode[STIX]{x1D70C} & \unicode[STIX]{x1D70C} & \ldots \, & \unicode[STIX]{x1D70E}^{2}\end{array}\right)\left(\begin{array}{@{}c@{}}x_{g1}\\ x_{g2}\\ \vdots \\ x_{gn_{g}}\end{array}\right)\nonumber\\ \displaystyle & = & \displaystyle \mathop{\sum }_{g=1}^{G}\left[\unicode[STIX]{x1D70E}^{2}(x_{g1}^{2}+x_{g2}^{2}+\cdots +x_{gn_{g}}^{2})+2\unicode[STIX]{x1D70C}\left(\mathop{\sum }_{i=1}^{n_{g}-1}\mathop{\sum }_{j=i+1}^{n_{g}}X_{gi}X_{gj}\right)\right]\nonumber\\ \displaystyle & = & \displaystyle \unicode[STIX]{x1D70E}^{2}\mathop{\sum }_{g=1}^{G}\mathop{\sum }_{i=1}^{n_{g}}X_{gi}^{2}+2\unicode[STIX]{x1D70C}\mathop{\sum }_{g=1}^{G}\left(\mathop{\sum }_{i=1}^{n_{g}-1}\mathop{\sum }_{j=i+1}^{n_{g}}C_{g_{ij}}\right)\nonumber\\ \displaystyle & = & \displaystyle \unicode[STIX]{x1D70E}^{2}NV_{x}+2\unicode[STIX]{x1D70C}\left(\mathop{\sum }_{g=1}^{G}C_{g}^{\ast }\right),\end{eqnarray}$$
where  $C_{g_{ij}}$ is the cross-product of the values for
 $x_{g}$ in periods
 $i$ and
 $j$ and
 $C_{g}^{\ast }$ is the sum of these terms in cluster
 $g$. Equation (B 1) is an important term as it appears in the equation for the true coefficient variance–covariance matrix, Equation (1), and is the first term and the sandwich term in large parentheses in the expression for the expected coefficient variance–covariance matrix using CRSE, obtained from substituting Equation (4) in Equation (3).
The next term to derive is  $W=\sum _{g}x_{g}^{\prime }\unicode[STIX]{x1D6F4}_{v}P_{g}x_{g}=\sum _{g}x_{g}^{\prime }\unicode[STIX]{x1D6F4}_{v}[x_{g}(x^{\prime }x)^{-1}x_{g}^{\prime }]x_{g}$.
 $$\begin{eqnarray}\displaystyle W & = & \displaystyle \mathop{\sum }_{g=1}^{G}[(x_{g}^{\prime }\unicode[STIX]{x1D6F4}_{v}x_{g})(x^{\prime }x)^{-1}(x_{g}^{\prime }x_{g})]\nonumber\\ \displaystyle & = & \displaystyle \frac{1}{NV_{x}}\mathop{\sum }_{g=1}^{G}\{[\unicode[STIX]{x1D70E}^{2}(x_{g1}^{2}+\cdots +x_{gn_{g}}^{2})+2\unicode[STIX]{x1D70C}C_{g}^{\ast }](x_{g1}^{2}+\cdots +x_{gn_{g}}^{2})\}\nonumber\\ \displaystyle & = & \displaystyle \frac{\unicode[STIX]{x1D70E}^{2}}{NV_{x}}\mathop{\sum }_{g=1}^{G}(n_{g}V_{x_{g}})^{2}+\frac{2\unicode[STIX]{x1D70C}}{NV_{x}}\mathop{\sum }_{g=1}^{G}n_{g}V_{x_{g}}C_{g}^{\ast },\end{eqnarray}$$
where  $V_{x_{g}}$ is the variation of
 $x$ about the full sample mean in cluster
 $g$. Given the symmetries the value for
 $x_{g}^{\prime }P_{g}\unicode[STIX]{x1D6F4}x_{g}$ will be identical to
 $W$ in Equation (B 2).
Last there is an expression for  $Z=\sum _{g}x_{g}^{\prime }[x_{g}(x^{\prime }x)^{-1}(\sum _{g}x_{g}^{\prime }\unicode[STIX]{x1D6F4}_{v}x_{g})(x^{\prime }x)^{-1}x_{g}^{\prime }]x_{g}$.
 $$\begin{eqnarray}\displaystyle Z & = & \displaystyle \frac{1}{(NV_{x})^{2}}\mathop{\sum }_{g=1}^{G}[(x_{g1}^{2}+\cdots +x_{gn}^{2})^{2}(\unicode[STIX]{x1D70E}^{2}NV_{x}+2\unicode[STIX]{x1D70C}C_{g}^{\ast })]\nonumber\\ \displaystyle & = & \displaystyle \frac{\unicode[STIX]{x1D70E}^{2}}{NV_{x}}\mathop{\sum }_{g=1}^{G}(n_{g}V_{x_{g}})^{2}+\frac{2\unicode[STIX]{x1D70C}}{(NV_{x})^{2}}\mathop{\sum }_{g=1}^{G}(n_{g}V_{x_{g}})^{2}C_{g}^{\ast }.\end{eqnarray}$$
Substituting the expressions in Equations (B 1)–(B 3) for the terms in Equation (3) gives the expected value of the CRSE estimated coefficient variance as,
 $$\begin{eqnarray}\displaystyle E(S_{b}^{2}) & = & \displaystyle \frac{1}{(NV_{x})^{2}}\left[\mathop{\sum }_{g=1}^{G}(x_{g}^{\prime }\unicode[STIX]{x1D6F4}_{v}x_{g})-2W+Z\right]\nonumber\\ \displaystyle & = & \displaystyle \frac{1}{(NV_{x})^{2}}\left\{\unicode[STIX]{x1D70E}^{2}NV_{x}+2\unicode[STIX]{x1D70C}\mathop{\sum }_{g=1}^{G}C_{g}^{\ast }-\frac{2}{NV_{x}}\left[\unicode[STIX]{x1D70E}^{2}\mathop{\sum }_{g=1}^{G}(n_{g}V_{x_{g}})^{2}+2\unicode[STIX]{x1D70C}\mathop{\sum }_{g=1}^{G}n_{g}V_{x_{g}}C_{g}^{\ast }\right]\right.\nonumber\\ \displaystyle & & \displaystyle \left.+\left[\frac{\unicode[STIX]{x1D70E}^{2}}{NV_{x}}\mathop{\sum }_{g=1}^{G}(n_{g}V_{x_{g}})^{2}+\frac{2\unicode[STIX]{x1D70C}}{(NV_{x})^{2}}\mathop{\sum }_{g=1}^{G}(n_{g}V_{x_{g}})^{2}C_{g}^{\ast }\right]\right\}\nonumber\\ \displaystyle & = & \displaystyle \frac{\unicode[STIX]{x1D70E}^{2}}{NV_{x}}\left[1-\frac{\mathop{\sum }_{g=1}^{G}(n_{g}V_{x_{g}})^{2}}{(NV_{x})^{2}}\right]+\frac{2\unicode[STIX]{x1D70C}}{(NV_{x})^{2}}\left\{\mathop{\sum }_{g=1}^{G}\left[1-\frac{2n_{g}V_{x_{g}}}{NV_{x}}+\frac{(n_{g}V_{x_{g}})^{2}}{(NV_{x})^{2}}\right]C_{g}^{\ast }\right\}\nonumber\\ \displaystyle & = & \displaystyle \frac{\unicode[STIX]{x1D70E}^{2}}{NV_{x}}\left[1-\mathop{\sum }_{g=1}^{G}\left(\frac{n_{g}V_{x_{g}}}{NV_{x}}\right)^{2}\right]+\frac{2\unicode[STIX]{x1D70C}}{(NV_{x})^{2}}\left[\mathop{\sum }_{g=1}^{G}\left(1-\frac{n_{g}V_{x_{g}}}{NV_{x}}\right)^{2}C_{g}^{\ast }\right].\end{eqnarray}$$
From Equations (1) and (B 1) the true coefficient variance is,
 $$\begin{eqnarray}\unicode[STIX]{x1D70E}_{b}^{2}=(x^{\prime }x)^{-1}\left(\mathop{\sum }_{g=1}^{G}x_{g}\unicode[STIX]{x1D6F4}_{v}x_{g}\right)(x^{\prime }x)^{-1}=\frac{\unicode[STIX]{x1D70E}^{2}}{NV_{x}}+\frac{2\unicode[STIX]{x1D70C}}{(NV_{x})^{2}}\mathop{\sum }_{g=1}^{G}C_{g}^{\ast }.\end{eqnarray}$$
The difference between Equations (B 4) and (B 5) is the presence of the squared terms involving  $n_{g}V_{x_{g}}/NV_{x}$, which is the share of the total variance in
 $X$ contributed by cluster
 $g$. The larger these terms the larger the amount by which the CRSE underestimate the true standard errors.
B.1 CRSE with Fully Homogeneous Clusters
A sufficient condition for consistent CRSE is fully homogeneous clusters, by which we mean an equal number of observations in each cluster and that  $X$ has the same mean and variance in each cluster;
 $n_{g}=n,\bar{X}_{g}=\bar{X},$ and
 $V_{x_{g}}=V_{x}$ for all
 $g$. With these conditions,
 $$\begin{eqnarray}\frac{n_{g}V_{x_{g}}}{NV_{x}}=\frac{nV_{x}}{nGV_{x}}=\frac{1}{G}\end{eqnarray}$$
and equation (6) becomes,
 $$\begin{eqnarray}E(S_{b}^{2})=\frac{\unicode[STIX]{x1D70E}^{2}}{NV_{x}}\left(1-\frac{1}{G}\right)+\frac{2\unicode[STIX]{x1D70C}}{(NV_{x})^{2}}\left[\mathop{\sum }_{g=1}^{G}\left(1-\frac{1}{G}\right)^{2}C_{g}^{\ast }\right].\end{eqnarray}$$
Thus,  $\lim _{G\rightarrow \infty }E(S_{b}^{2})=\unicode[STIX]{x1D70E}_{b}^{2}$.