

I. INTRODUCTION
This Article is the third in a program of study, conducted in collaboration with the American Bar Association (“ABA”), on diversity and inclusion (“D&I”) in the legal profession.Footnote 1 The investigation’s overarching focus is on lawyers with disabilitiesFootnote 2 and lawyers who identify as lesbian, gay, bisexual, transgender, and queer (“LGBTQ+” as an overarching term).Footnote 3 It further considers multiple individual and social intersectional identities associated with race and ethnicity, gender, and age.Footnote 4
Ours is not the first study to focus on the legal profession. Earlier studies of the legal profession included broad formative empirical investigations, such as the longitudinal study, After the JD, conducted from 2004 to 2019 by the American Bar Foundation (“ABF”) and the National Association for Law Placement (“NALP”).Footnote 5 Specific diversity-oriented studies from 2015 to 2020 have acknowledged that the legal profession remains among the least diverse professions in the United States, and particularly at senior and leadership levels.Footnote 6 Despite extensive efforts to promote D&I in the profession, and existing antidiscrimination laws, reports of discrimination and bias by minority-identity lawyers are prevalent.Footnote 7
The existing body of study on the lack of D&I in the legal profession, while robust, has primarily focused on gender,Footnote 8 racial and ethnic minorities,Footnote 9 and the intersection of gender and race.Footnote 10 Our engagement in a program of studies to extend the focus of D&I studies to include lawyers with disabilities and who identify as LGBTQ+Footnote 11 comes to coincide with the thirtieth anniversary of the Americans with Disabilities Act (“ADA”).Footnote 12
In our studies, we seek to build upon the increasing recognition that, to be successful, legal organizations must seek to hire and retain diverse talent.Footnote 13 Our body of research likewise rests on the recognition that “success” in the legal profession can be measured in a wider variety of ways than have typically been recognized, such as in diversity of personal and professional experience; work ethic and competence; emotional intelligence; and values, such as integrity, that underpin the legal profession.Footnote 14
As is well recognized in the legal profession, attitudinal and structural stigma and bias are antithetical to D&I, as are intentional and unintentional discrimination in the workplace.Footnote 15 When these unjustified and harmful forces play a role in organizations, some of their members, and sometimes their organizational customers and clients, perceive other members to have qualities that are devalued—regardless of those other members’ competence or other professional characteristics.Footnote 16 This devaluation may be expressed in myriad ways, such as by overt bias, stigma, and discrimination; by subtler verbal means, nonverbal means, or both, as with “microaggressions”;Footnote 17 or by variations of both verbal and nonverbal types of discrimination. Devaluation may also be expressed intentionally or unintentionally. This latter form often is described as implicit, or “unconscious,” bias.Footnote 18
These forms of discriminatory expression may be conveyed, or perceived to have been conveyed, by both individuals and groups. These expressions may be internal or external to an organization’s governing mechanisms and may take the form of discriminatory policies, procedures, practices, and norms (this last term is also referred to as organizational culture or climate). These mechanisms all inevitably vary as a function of context, time, group dynamics, tasks and objectives, and other characteristics of particular environments.Footnote 19
Stigma, bias, and discrimination, of course, are perceived, experienced, and reported differently depending upon the individuals and groups engaged in the particular interaction and circumstance.Footnote 20 So, too, are they affected by the individual’s sense of self-identity, personal and professional experience, culture, age, and myriad other factors.Footnote 21 Their receipt is also moderated by environmental, organizational, and other contextual and temporal effects.Footnote 22 Given the ubiquity of the terms stigma, bias, and discrimination, as expressed and received in all their forms,Footnote 23 they are inevitably viewed and interpreted differently by researchers, lawyers, the general public, and bystanders.
The demographic, economic, and structural changes in the legal profession over the past twenty-five or so years, recently magnified due to the global health and economic emergency from the pandemic, have slowly led to recognition that D&I in the legal profession—understood, in part, as anti-stigma, anti-bias, and antidiscrimination mechanisms—is, to put it simply, important.Footnote 24 Nonetheless, despite such commitments, corporate law firms remain dominated by non-disabled White menFootnote 25 and are unwelcoming for many individuals with multiple marginalized and oppressed identities.Footnote 26
Passage of the ADA has added, or ought to have added, to the factors changing the legal profession. Because the ADA includes an accommodation principle, we have argued that the D&I objective for a culture of inclusion must include that principle. We have called the resulting concept Diversity and Inclusion plus Accommodation (“D&I+”).Footnote 27 D&I+ includes three core elements that may be applied across settings to advance an organization’s mission: (1) Diversity of talent, (2) Inclusion of talent, and (3) Accommodation of talent.Footnote 28
We proceed in this Article as follows: in Part II, we provide a brief overview of the studies in our investigation. We then review extant literature on forms of workplace discrimination, with a focus on forms of overt and subtle discrimination, as well as the combination of these complex processes. In Part III, we overview the methodology used to conduct our research, with mention of the participants, methods, and research questions. In Part IV, we present our findings about the extent to which individuals with minority and multiple minority identities, as compared to others, are likely to report forms of discrimination.Footnote 29 Finally, in Part V, we discuss the implications of the findings and the limitations of the study, and we propose pathways for future research.
II. PURPOSE
A. Prior Studies and Current Study
The first article in our series of studies presented descriptive findings from our nationwide study of the legal profession focusing on lawyers with disabilities and lawyers who identify as LGBTQ+.Footnote 30 Lawyers with disabilities, those who identified as LGBTQ+, women, and racial/ethnic minority lawyers reported generally higher rates of discrimination at their workplaces.Footnote 31 Other studies are in accord with these findings, showing that lawyers of color, White women, and those who identify as LGBTQ+ are more likely to report they have been targets of discrimination than are White men.Footnote 32
Consistent with our prior findings, researchers also find that lawyers with marginalized identities report relatively more experiences of overt forms of discrimination.Footnote 33 Based on the oppression, discrimination, and bias that have been documented elsewhere,Footnote 34 we predicted that the intersection of minority identity characteristics would create unique challenges. Thus, individuals who identify with multiple minority and differing salient identities are more likely than individuals not identifying as such to report discrimination on the basis of their race, gender, and age.Footnote 35 The results from our study showed that around four in ten lawyers reported at least one form of subtle or overt discrimination, but almost half (46%) also reported they had experienced strategies and practices that were aimed at lessening the effects of bias and discrimination in their workplaces.Footnote 36 In that first article, we also introduced the concept of D&I+.
In the second article in this series, we examined workplace accommodations or individualized adjustments to work, vital for employees with disabilities, to further the broader conception of D&I+ that we had introduced.Footnote 37 We considered who requests accommodations and who is more likely to have their requests granted. We investigated the role of individual characteristics and their intersection, including disability, sexual orientation, gender, race/ethnicity, and age. Using the data set from our study, we estimated the odds of requesting accommodations and having the request approved, as well as differences in odds according to individual characteristics, adjusting for organizational control variables.
Certain personal identity factors, such as disability, gender, and age, were associated with requests for accommodations. The odds of requesting accommodations were higher for women and people with disabilities as compared to men and those without disabilities, but lower for the older individuals in the study as compared to the younger individuals. The odds of requesting accommodations were higher for a segment of the older population—older LGBQ lawyers—than for younger LGBQ lawyers.Footnote 38
But the results also showed that accommodations were granted differentially to individuals with multiple marginalized identities. Counter to our predictions, being a person with a disability was negatively associated with having an accommodation granted. Older lawyers had higher odds of having accommodations granted; nonetheless, such accommodation-granting effects were offset for groups such as women and racial/ethnic minorities, whose odds went down with age. LGBQ lawyers of color likewise had lower odds than did White LGBQ lawyers of having their accommodations granted. Longer job tenure and working for a large organization resulted in generally higher odds of having accommodations approved, while working for a private organization decreased the odds.
Based on these prior studies, we concluded that it is indeed often those who need accommodations the most, such as lawyers with disabilities and women, who are more likely to request accommodations. However, concerning grants of accommodation requests, disabled lawyers, older women lawyers, older lawyers of color, and LGBQ lawyers of color were less likely to have accommodation requests approved as compared to their counterparts. The results highlighted the need for continued study of intersectional identities in the accommodation process.
Building on our prior two studies, this current study continues to parse the original survey data from the national study and to espouse the concept of D&I+. We again focus on lawyers who identify as having health conditions, impairments, and disabilities, and on lawyers who identify as LGBTQ+. This study, however, builds on the prior descriptive findings of reported discrimination and extends the analysis by using multivariate modeling to predict the likelihood of reports of discrimination in the workplace.
Specifically, in this study, we extend the prior analysis by examining the extent to which different individuals with multiple minority identities are likely to report types of overt and subtle discrimination, or both. Given the lack of systematic study in this area from an intersectional perspective, we aim to help further the empirical basis for reports of discrimination in the legal profession.Footnote 39
The findings in this Article demonstrate that lawyers with disabilities show a higher likelihood of reporting both types of discrimination (overt and subtle). Lawyers who identify as LGBQ show a higher likelihood of reporting subtle-only discrimination, as well as both subtle and overt discrimination. Women, as compared to men, and lawyers of color, are more likely to report all three types of discrimination (subtle, overt, and both subtle and overt discrimination). In general, younger lawyers are more likely to report subtle-only discrimination as compared to older lawyers.Footnote 40 Lawyers working at a private firm are less likely to report any type of discrimination, while working for a larger organization is associated with a higher relative likelihood of reporting subtle-only discrimination.
In summary, this study is an incremental step toward understanding the impact of multiple minority identities in the legal profession. The findings illustrate that primary and multiple minority identities—disability, sexual orientation, gender, race/ethnicity, and age—are associated with reports of discrimination and bias in the legal workplace. Men, regardless of identity, generally have the lowest probabilities of reporting all three types of discrimination and, consequently, the highest probability of experiencing no discrimination in the legal workplace.
B. Workplace Discrimination and Bias Overview
Workplace discrimination is commonly the adverse or negative treatment of similarly situated employees on the basis of their individual and social identities, some of which are protected characteristics under the law, such as race, gender, disability, sexual orientation and gender identity, and age.Footnote 41 The current study, as had others before, considers aspects of the legal profession’s culture as differently affecting persons with disabilities and those identifying as LGBTQ+—in other words, as subjecting them to discrimination.Footnote 42
Discrimination or bias may present explicitly or overtly, as “blatant antipathy, beliefs that women and people of color are inherently inferior, endorsement of pejorative stereotypes, and support for open acts of discrimination.”Footnote 43 Overt discrimination has been described as “differential and unfair treatment that [is] clearly exercised, with visible structural outcomes.”Footnote 44 Overt discrimination may be evidenced in individual attitudes and behaviors, verbally or nonverbally. It also may be evidenced in structural aspects of organizations, such as workplace policies, procedures, and practices, as well as in aspects of organizational culture and norms.
In all their pernicious forms, overt forms of discrimination are viewed as unacceptable behavior in the workplace, and such behavior usually leads to consequences for the person(s) who commit it.Footnote 45 For example, the ADA prohibits employers from discriminating against their employees based on their disabilities, and denial of a reasonable workplace accommodation to an otherwise-qualified worker is discrimination under the law.Footnote 46
Often, therefore, bias and stigma are presented subtly.Footnote 47 Such presentation does not necessarily result in a less malignant delivery or effect, but it is expressed with less obvious or visible intent and action. As with overt discrimination, it can be both verbal and nonverbal.Footnote 48 Subtle forms of discrimination often may be as harmful as, or even more harmful than, overt forms of discrimination.Footnote 49 The prior descriptive findings in this program of study have shown that subtle forms of discrimination were reported with greater frequency than more overt forms of discrimination.Footnote 50
Subtle, and seemingly ambiguous, behavior or actions, with negative intent or consequences, may also be particularly stressful to individuals, as compared to explicit discrimination.Footnote 51 This is because subtle forms of discrimination, bias, and aggression are more difficult to discern and detect, and may occur more frequently because they are less obvious.Footnote 52 For victims, subtle discrimination is associated with increased risk for negative health effects and somatic symptoms,Footnote 53 lower levels of well-being,Footnote 54 low job satisfaction and high levels of detachment,Footnote 55 and lower earnings, self-esteem, self-regulation, and task-performance for those who are subjected to it.Footnote 56
There are, of course, innumerable manifestations across the continuum of attitudinal and structural discrimination in the workplace, and they are experienced at the individual, work team, and organizational levels.Footnote 57 Discrimination, particularly of the subtle type, may be evidenced in seemingly ordinary interpersonal dynamics, verbally, nonverbally, symbolically, intentionally, and unintentionally.Footnote 58 Many D&I awareness and training programs address such intentional and unintentional discrimination, sometimes termed as “conscious” or “unconscious.”Footnote 59 In reality, whatever the form of such attitudinal and structural bias and discrimination, it is typically not manifested only in discrete incidents but, instead, as a pattern of behavior, occurring over time in differing degrees and circumstances.Footnote 60
D&I awareness and training programs have addressed intentional and unintentional discrimination in various contexts, including the legal community context.Footnote 61 In our current study of the legal profession, and for our phase one survey, we asked the lawyer participants to recount experiences of subtle and overt forms of bias and discrimination, as well as the combination of these two. We used this terminology and approach, in part, because we assumed that most of our lawyer participants would be generally familiar with antidiscrimination laws and regulations that prohibit explicit or overt forms of workplace discrimination, and which have had the effect of making subtle forms of discrimination and bias more commonplace.Footnote 62 In addition, lawyers in particular are usually mindful of D&I training and “unconscious bias,” with some state bars requiring continuing education in the D&I area.Footnote 63
The broad contours of the study and debate about workplace bias and discrimination are well beyond the immediate scope of this investigation. Our immediate purpose is to further document, and empirically model, discrimination and bias in the legal profession as reported by disabled and LGBTQ+ lawyers, and by others with related minority identities. Thus, for the phase one survey reported on here, we recorded individual reports of discrimination and bias along dimensions that were presumably familiar to lawyers—overt, subtle (whether intentional or unintentional), and combinations of these categories.
But we do also have a broader aim: to increase understanding of D&I, or D&I+, in the legal profession, in order to help mitigate sources of bias and discrimination. That is why we also consider correlates and predictors of reports of discrimination and bias. Lisa Nishii and colleagues have illuminated such D&I approaches using a “multi-level process model”Footnote 64 and have considered the efficacy of D&I practices such as mentoring, targeted recruiting, training, and work-life integration. However, Nishii and colleagues, and others, find the general efficacy of D&I programming disappointing: for most studies, “the results were mixed or inconclusive and occasionally even negative.”Footnote 65 Often, D&I programs do not have specific and desired objectives, and they are frequently implemented without full appreciation for, or in isolation from, the intersectional human experience.Footnote 66 Recent evidence shows that such trainings not only may be ineffective, but may also have the opposite effect of the one desired—instead of reducing bias and discrimination, they increase it.Footnote 67 For example, Michelle Duguid and Melissa Thomas-Hunt have shown that messages about the prevalence of stereotyping, presented in many unconscious bias trainings, do not actually mitigate the expression of stereotyping behavior.Footnote 68
Thus, despite innumerable D&I efforts in the legal profession (even with a focus on “implicit” bias), existing laws prohibiting discrimination, and workplace rules aimed at preventing discrimination, marginalized individuals in our studies still report high levels of overt and subtle forms of discrimination.Footnote 69 In accord, Robert Nelson and colleagues report that women, especially women of color, men of color, and LGBTQ attorneys are more likely than their counterparts to perceive discrimination from their clients, as well as from their supervisors, even when controlling for other individual and organizational factors.Footnote 70 Our own earlier descriptive study showed that lesbian, gay, and bisexual (“LGB”) lawyers report relatively high perceptions of subtle biases.Footnote 71 Lawyers with disabilities,Footnote 72 women and transgender lawyers, and lawyers of color also report experiencing a high prevalence of overt forms of discrimination, including harassment and bullying.Footnote 73 Transgender people and people who identify as LGBQ also experience high levels of employment and workplace discrimination in professions other than the legal profession.Footnote 74
Overall, overt and subtle discrimination and bias, expressed in attitudes, behavior, and actions, co-exist in the multidimensional human experience. Although discrimination and bias are expressed and perceived in different forms and circumstances, they cannot be separated from organizational and group form, history and culture, and interpersonal dynamics in a particular place and time. These observations naturally will lead us to examine in further detail programs and organizational efforts that transcend current D&I approaches, such as our D&I+ conception.Footnote 75
But first, in this study, we take a closer look at reports of discrimination and bias and their differential effects across and within individual and multiple identities.Footnote 76
C. Research Questions
Using our data from the 2018/2019 sample of 3590 lawyers across the United States, this study examines reports of workplace discrimination during the years before the pandemic. We purposefully oversampled from the Disability Rights Bar Association (“DRBA”), the National LGBT Bar Association, and other organizations of lawyers with disabilities and from the LGBTQ+ community. Our data make it possible to explore differences in workplace experiences within and across these groups, while also considering other intersecting identities such as gender, race, and age.Footnote 77
We address two overarching research questions in this study. First, what are the characteristics of those lawyers who are likely to report discrimination in the legal workplace? Given the established literature in this area, we hypothesized that historically marginalized groups are more likely to report workplace discrimination, particularly people with disabilities, those who identify as LGBQ, women, and racial/ethnic minorities.Footnote 78
Second, we examine the extent to which these lawyers are likely to report discrimination (overt-only, subtle-only, both overt and subtle, or none) in their workplaces. Based on the prior literature, reports of discrimination will vary by individual, temporal, and contextual factors. We predict that those individuals whose multiple identities typically require formal disclosure (i.e. certain types of disabilities, sexual orientation, and gender identities) will be more likely to report subtle discrimination and bias, as compared to individuals with more obvious identities, who will be more likely to report overt discrimination and bias or both subtle and overt discrimination and bias. The current exploratory analyses identify some of these possible associations that future studies will better consider, such as which identity disclosures and other factors may be associated with reports of workplace discrimination.Footnote 79
III. METHODS
A. Data
To answer the main research questions, we employ the data from our phase one survey of a sample of lawyers in the United States. Our survey methods have been described in detail elsewhere.Footnote 80 But some key features are that the survey uses quantitative and qualitative questions, with fixed-choice and open-ended response opportunities. We deployed the survey electronically and in accessible formats to geographically dispersed people working in the legal profession across types (e.g., private/public) and sizes of organizations. In the end, as noted, 3590 people completed and submitted the survey, although not all participants completed all the survey questions.Footnote 81 For the current analyses, the subsample consists of 2577 individuals who responded to all the questions included in our model.
B. Outcome Variables
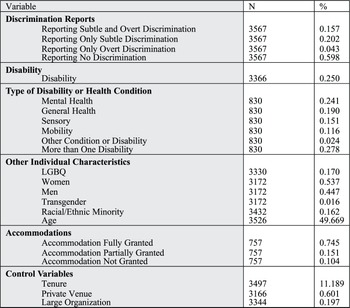
Type of Discrimination: Our dependent variable is a nominal outcome variable with four categories of reported discrimination: overt and subtle discrimination (“both types”), overt discrimination only, subtle discrimination only, and no discrimination.Footnote 82 Overt discrimination includes reports of discrimination, bullying, and/or harassment. Subtle discrimination includes two possible reports: subtle and intentional bias, and subtle but unintentional bias. “No discrimination reported” was coded for respondents who answered “do not know,” “prefer not to say,” “not applicable,” or who did not provide an answer to the question.Footnote 83 As discussed and presented in Table 1 below, approximately one in six (16%) of respondents reported both types of discrimination, one in five (20%) reported subtle-only, and one in twenty-five (4%) reported overt-only. The majority (60%) reported no discrimination.
Descriptive Statistics

Notes: Age and tenure are continuous variables, with the range for age at 24 to 90 years and the range for tenure at 0 to 70 years, and with the mean values for these variables reflected in the % column in the Table.
C. Individual Characteristics
Table 1 provides information about the characteristics of our overall sample, such as disability status and type, sexual orientation, gender identity, race/ethnicity, and age. Table 1 provides an overview of the number of the respondents, indicating the proportion for each variable included in our model.
Disability is coded as a binary variable: “1” for “has a disability, impairment, or health condition” and “0” for “no disability.”Footnote 84 One in four respondents (25%) report having a disability. Within disability, individuals with more than one health condition, disability, or impairment and those with mental disabilities represent the largest share of our sample among people with disabilities and health conditions (28% and 24%, respectively).Footnote 85
Table 1 also shows that for workplace accommodations, three-quarters (75%) of respondents who requested an accommodation reported that their request was fully granted, 15% reported that it was partially granted, and 10% that it was not granted.
Sexual orientation is coded as a binary variable, with “1” when the respondent identified as LGBQ, and “0” for straight/heterosexual. About one in six (17%) of respondents identified as LGBQ.Footnote 86
Gender is coded as three separate binary variables: women (“1” for Women, “0” for Other), men (“1” for Men, “0” for Other), and transgender (“1” for Transgender, “0” for Other). Although the sample of individuals who identify as transgender is relatively small, we include their responses, given the general lack of data about transgender individuals in the legal profession. Men is the “omitted variable” in our models; that is, it is the baseline level against which the other variables in the models are compared. The gender identity variables are derived from two different survey questions that asked respondents their gender (“Woman, Man, Other”) and whether they identify themselves to be transgender.Footnote 87 Women make up the largest group at 54% of respondents, men at 45%, and transgender at 1%.
Race and ethnicity are coded as one binary variable to indicate racial and ethnic minority status, which is done to simplify subsequent intersectional analyses as well as to increase cell sizes. This variable is coded as “1” when the respondent identifies as a person of color (Black, Hispanic or Latino, American Indian or Alaska Native, Native Hawaiian or Pacific Islander, Asian, Multiracial) and “0” if White, non-Hispanic. About one in six (16%) of respondents identify as a person of color.
Age is coded as a continuous variable, ranging from 24 to 90 years of age, with the average age at just over 49 years.Footnote 88 In our regression models, age is centered at the mean (49 years) to help in the interpretation of results.Footnote 89
D. Control Variables
We included specific covariates identified in the prior literature to control for their effect on our core variables: job tenure, organization size, and organization type (e.g., private/public).Footnote 90 First, job tenure Footnote 91 reflects the number of years the respondent had worked at the current organization at the time of the survey. Responses ranged from less than one year (coded as “0”) to seventy years, with the average tenure being slightly longer than eleven years. Thus, there is a degree of job stability for this cohort.
Second, organization size is coded as a binary variable, with “1” for firms and organizations with more than 500 lawyers (“large” or “BigLaw”) and “0” for organizations with less than 500 lawyers. Around 20% of respondents worked at organizations with more than 500 employees. Third, we included practice type as a binary variable, coded “1” for private firm and “0” for other types (in-house legal department, public sector, non-profit, judicial, educational, and other). The majority (60%) of organizations were private firms.
E. Analytic Strategy
To provide descriptive statistics for our sample, we estimate differences in characteristics between the types of discrimination reported (i.e., both overt and subtle, subtle-only, overt-only, or none).Footnote 92 To answer our research questions, we estimate the relative risk ratio of reporting one of the three types of discrimination as compared to no reported discrimination.
Specifically, using multinomial logistic regression, we estimate differences in the relative risk of reported discrimination by individual characteristics such as disability, sexual orientation, gender, race/ethnicity, and age (Model 1). We progressively add to this basic model the covariates, such as job tenure, organization type, and organization size, to assess their contribution to the variation in discrimination reports (Model 2). We then add two-by-two (“2x2”) interactions of individual characteristics (Model 3). This is done to model the intersectional analysis, which considers combinations of individual characteristics that create unique identity experiences for these respondents.Footnote 93
IV. RESULTS
A. Basic Findings
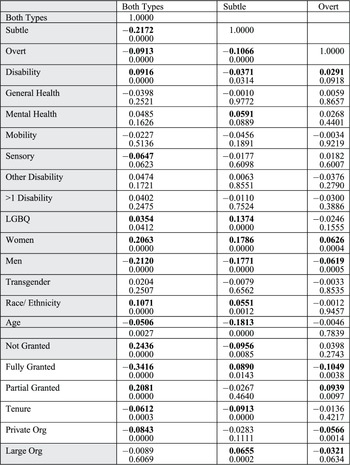
Table 2 shows pairwise (simple bivariate) correlation coefficients for the variables used in our model to consider the central research questions.Footnote 94 The results indicate that reports of both types of discrimination, overt and subtle, are significantly associated with:
-
• Identifying as a person with a disability;
-
• Not reporting sensory disability;
-
• Identifying as LGBQ;
-
• Women;
-
• Identifying as a racial/ethnic minority;
-
• Younger individuals and those with less job tenure;
-
• Non-granting of workplace accommodations (including non-full granting of accommodations or partial granting of accommodations);
-
• Not working at private firms.
Correlation Between Discrimination Types and Relevant Individual Characteristics

Notes: Table represents pairwise correlation between dependent and independent variables and their corresponding p-value. We have represented phi coefficients and Point-Biserial Correlation coefficients as appropriate. Shown in bold are significant results with an associated p-value < 0.1.
Reports of both types of discrimination trend toward an association with reports of mental health conditions.Footnote 95 In addition, and conversely, the combination of identifying as a man, being older, having longer job tenure, and working for a private organization is associated with fewer reports of both types of discrimination, subtle and overt.
The results indicate that reports of subtle-only discrimination partially mirror the findings (direction of relationship and magnitude) for reports of both subtle and overt discrimination. Consistent with the findings in Table 2 for reports of both types of discrimination, the experience of subtle-only discrimination is positively and significantly associated with lawyers who identify as LGBQ, are women, and are people of color. Our results indicate that reports of subtle-only discrimination, as compared to reports of both types of discrimination, are also significantly associated with:
-
• Not identifying as a person with a disability;
-
• Reporting mental health conditions;
-
• Full-granting of workplace accommodations; and
-
• Working at larger organizations.
Reports of disability overall are negatively associated with subtle bias, whereas reports of mental health conditions are positively associated with reports of subtle bias. This finding further amplifies the strong suggestive evidence of the negative stigma (subtle discrimination here) often associated with reports of mental health conditions.
Lastly, the reports of overt-only discrimination vary somewhat as compared to the reports of both types and subtle-only discrimination, in that overt-only discrimination is significantly associated with:
-
• Identifying as a person with a disability;
-
• Women;
-
• Non-full granting of workplace accommodations (including partial granting of accommodations);
-
• Not working at private firms; and
-
• Not working for a large organization.
Reports of overt-only discrimination are not associated with identification as LGBQ or being a racial/ethnic minority. We return to these basic associations below in our multivariate regression modelling.
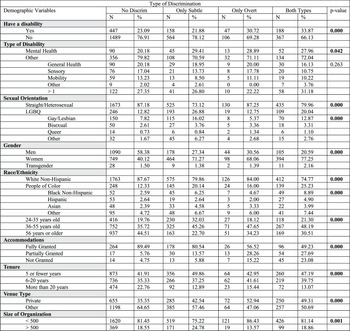
Table 3 summarizes the basic descriptive statistics organized by the four categories of discrimination (both, subtle-only, overt-only, and none) and by the demographic and firm variables introduced earlier.Footnote 96 Table 3 displays the frequency distributions of the discrimination types by groupings with the associated column percentages.Footnote 97
Distribution of Discrimination Type by Individual Characteristics (Column Percentages)

Notes: P-value represents Pearson’s χ2. Significant results with a p-value of 0.1 or lower are shown in bold. Column percentages adjusted with rounding to add up to 100%.
Disability. Results show that there is a statistically significant relationship between disability status and the type of discrimination reported. Specifically, although lawyers with disabilities make up only about one-quarter (23%) of the “no discrimination” responses, they comprise about one-third (34%) of cases reporting both types of discrimination and about one-third (31%) of cases reporting overt-only discrimination. In addition, lawyers who report a mental health condition represent a significantly larger portion of individuals reporting discrimination as compared to those reporting no discrimination. Predictably, nine in ten (90%) of lawyers who did not report discrimination had their accommodation request fully granted, as compared to 81% of those reporting subtle-only discrimination and less than half (49%) reporting both types of discrimination, with somewhat more than half (57%) for those reporting overt-only discrimination.
Sexual Orientation and Gender Identity. Results show that the probability of reporting discrimination differs by individual sexual orientation. Thus, LGBQ lawyers make up a relatively larger portion of those who report both types of discrimination (20%) or subtle-only discrimination (27%), as compared to those not reporting discrimination (13%) or reporting overt-only discrimination (13%). Although women comprise just over half (54%) of the respondents, they make up more than three-quarters (77%) of those reporting both types of discrimination. Women also comprise 71% of those reporting subtle-only discrimination, 68% of those reporting overt-only discrimination, and less than half (40%) of those reporting no discrimination. Similarly, while transgender individuals comprise about one percent of the overall sample, they make up more than two percent of those reporting both types of discrimination.
Race/Ethnicity. The identification of race/ethnicity is associated with the type of discrimination reported. Results in Table 1 show that White non-Hispanic respondents comprise more than eight of ten respondents (84%), with individuals reporting as racial/ethnic minorities comprising about 16% of respondents. Yet, Table 3 shows that racial/ethnic minorities reflect only about one in ten (12%) of individuals reporting no discrimination as compared to almost nine in ten (88%) of White non-Hispanic lawyers. For racial/ethnic minorities, discrimination reports are: 25% for both types, 16% for overt-only, and 20% for subtle-only.
Age/Tenure. Younger respondents and those with less than five years’ tenure at a firm are more likely to report all forms of discrimination as compared to older lawyers.
B. Who is Likely to Report Discrimination? Regression Models
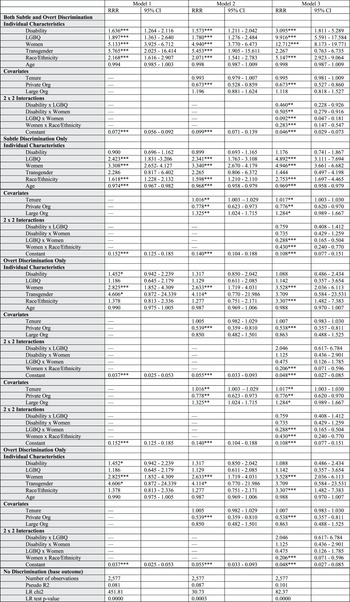
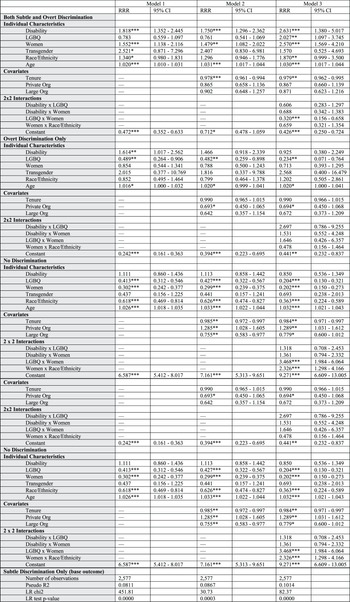
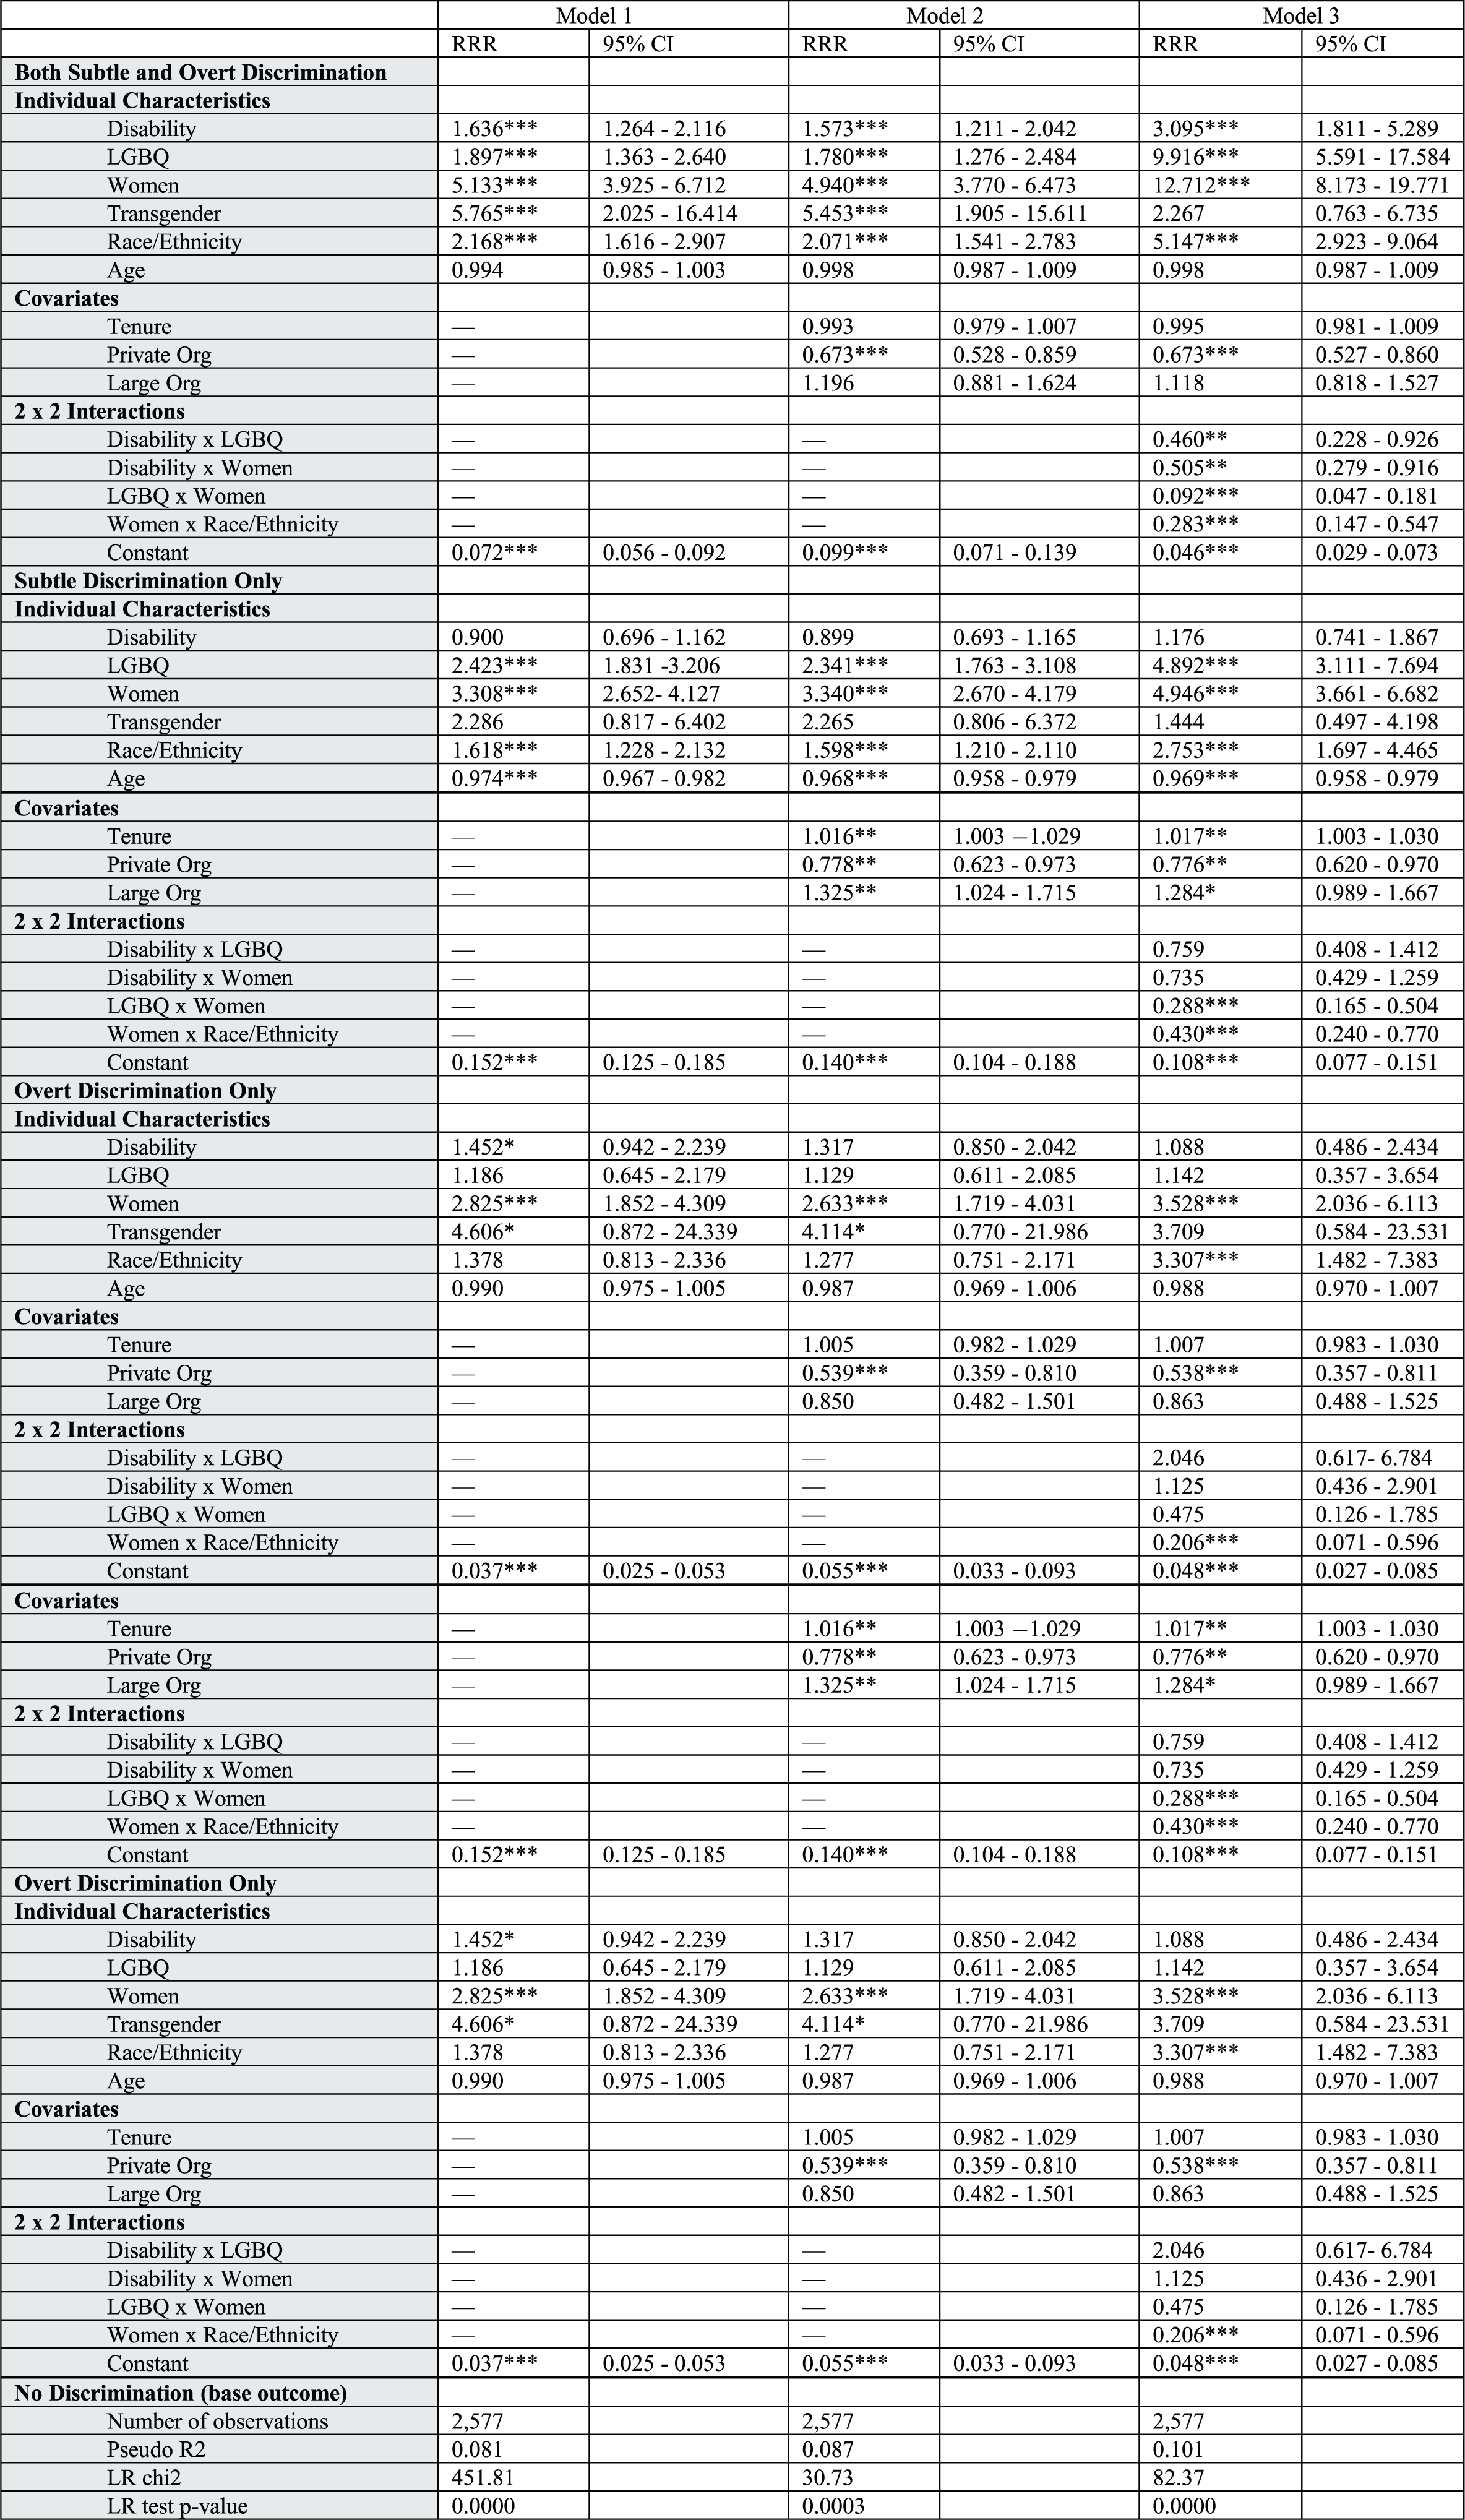
To estimate differential reporting of discrimination, we conduct a series of multinomial logistic models. The results in Table 4 present the relative risk ratio (“RRR”) of reporting the discrimination categories—overt-only, subtle-only, or both—as compared to reporting no discrimination (the baseline value), controlling for the other variables in the model. In other words, we examine the risk of a respondent reporting one of the three discrimination categories relative to the risk of reporting no discrimination, while considering the other variables in the models as presented in Table 4.Footnote 98
Determinants of Reporting Discrimination in the Workplace Among Lawyers (Multinomial Logistic Regression)
Notes: ***p-value < 0.01; **p-value < 0.05; *p-value < 0.1. No discrimination is the base outcome. Age is mean centered at 49 years.
Model 1 in Table 4 presents a basic multinomial logistic model, which considers the main variables as predictors of the outcomes of interest—both, subtle-only, and overt-only discrimination. Model 2 in Table 4 adds the organizational covariates—job tenure, private/public firm, and size of organization. The full model, Model 3, adds the 2x2 interaction terms; that is, associations between pairs of variables. Table 4 at the bottom also presents the results of the Likelihood Ratio Test (“LR”), which compares the explanatory usefulness of each model.Footnote 99
We observe in Model 1 that, as compared to those not reporting discrimination, individuals with disabilities; individuals who identify as LGBQ, women, or transgender; and individuals who are racial/ethnic minorities are more likely to report both types of discrimination as compared to their counterparts.Footnote 100 The findings in Models 2 and 3 comport with these findings, except that in Model 3 we cannot reach any conclusions for individuals identifying as transgender, which is likely related to the small sample size of this group.
In addition, as evidenced by the correlational findings in Table 2, the results from Model 1 suggest that: (1) individuals who identify as LGBQ, women, and racial/ethnic minorities show a higher risk of reporting subtle-only discrimination, as opposed to not experiencing discrimination, and (2) older individuals show a lower risk of reporting subtle-only discrimination, as opposed to not experiencing discrimination. These findings differ for overt-only discrimination (Model 1), where we find that individuals with disabilities, women, and those who identify as transgender are more likely to report overt discrimination versus no discrimination.
Disability. The results from Model 3 in Table 4 show that the relative risk ratio of reporting both types of discrimination (versus no discrimination) increases by a factor of 3.095 (210%)Footnote 101 for a person with a disability as compared to a person with no disability, controlling for the other individual and organizational characteristics. This effect for disability does not appear for subtle-only versus no discrimination or overt-only versus no discrimination.
Review of the 2x2 interaction analysis in Model 3 shows that, for disabled individuals reporting both types of discrimination, the main effect of disability varies as a function of (i.e., interacts with) sexual orientation and of gender.Footnote 102 That is, the relative risk of reporting is reduced by 54% for LGBQ individuals with disabilities, and 49% for women with disabilities as compared to their counterparts.Footnote 103
Sexual Orientation. Table 4 shows that the RRR of reporting both types of discrimination versus no discrimination is almost ten times (9.916) higher for a person who identifies as LGBQ as compared to a person who does not identify as LGBQ, controlling for the other variables in the model. The comparable RRR for subtle discrimination is almost five times (4.892) higher for a person who identifies as LGBQ as compared to a person who identifies as straight.Footnote 104 The effect of sexual orientation varies with disability identification (discussed above) and with gender. For instance, the relative risk for LGBQ women reporting both types of discrimination is about 91% lower, and about 71% lower for reporting subtle-only, compared to no discrimination.Footnote 105
Gender. Being a woman is associated with a higher relative risk of reporting all three types of discrimination—both, subtle-only, and overt-only—as compared to men, controlling for the other variables in the model.Footnote 106 Holding constant the other variables in the model, the RRR of reporting both types of discrimination (versus no discrimination) is 12.712 times higher for women than men; the RRR for subtle-only versus no discrimination is 4.946 times higher for women than men; and the RRR for overt-only versus no discrimination is 3.528 times higher for women than men.Footnote 107
The interaction effect of gender (for women) varies with race/ethnicity for those who report all three types of discrimination versus no discrimination. Specifically, the risk of reporting all three types of discrimination, compared to no discrimination, is reduced for women who are racial/ethnic minorities.Footnote 108
Race/Ethnicity. Race is associated with a relative risk of reporting all types of discrimination (compared to no discrimination). The RRR for reporting both types is 5.147 times higher for lawyers who identify as racial/ethnic minorities; the RRR of reporting subtle-only is 2.753 times higher for racial/ethnic minorities; and the RRR of reporting overt-only is 3.307 times higher, as compared to White lawyers.Footnote 109
Age. The variable of age is significant for those who report subtle-only, but not for both types or overt-only, as compared to no discrimination. The risk of reporting subtle-only discrimination versus no discrimination declines by 3% for a one-year increase in age (RRR = 0.969), net of the other variables in the model.Footnote 110
Organizational and Job Covariates. Job tenure is associated with a 1.7% higher risk of reporting subtle-only discrimination for a one-year increase (relative to reporting no discrimination).Footnote 111 Working for a private organization compared to other organizations is associated with a decline of 33% in the risk of reporting both types, a 22% decline in the risk of reporting subtle-only, and a 46% decline in the risk of reporting overt-only, versus no discrimination.Footnote 112 Working for a large organization versus a small organization is associated with an increase of 28% in the relative risk of reporting only subtle-only versus no discrimination.Footnote 113
C. Predicted Probabilities of Reports of Discrimination
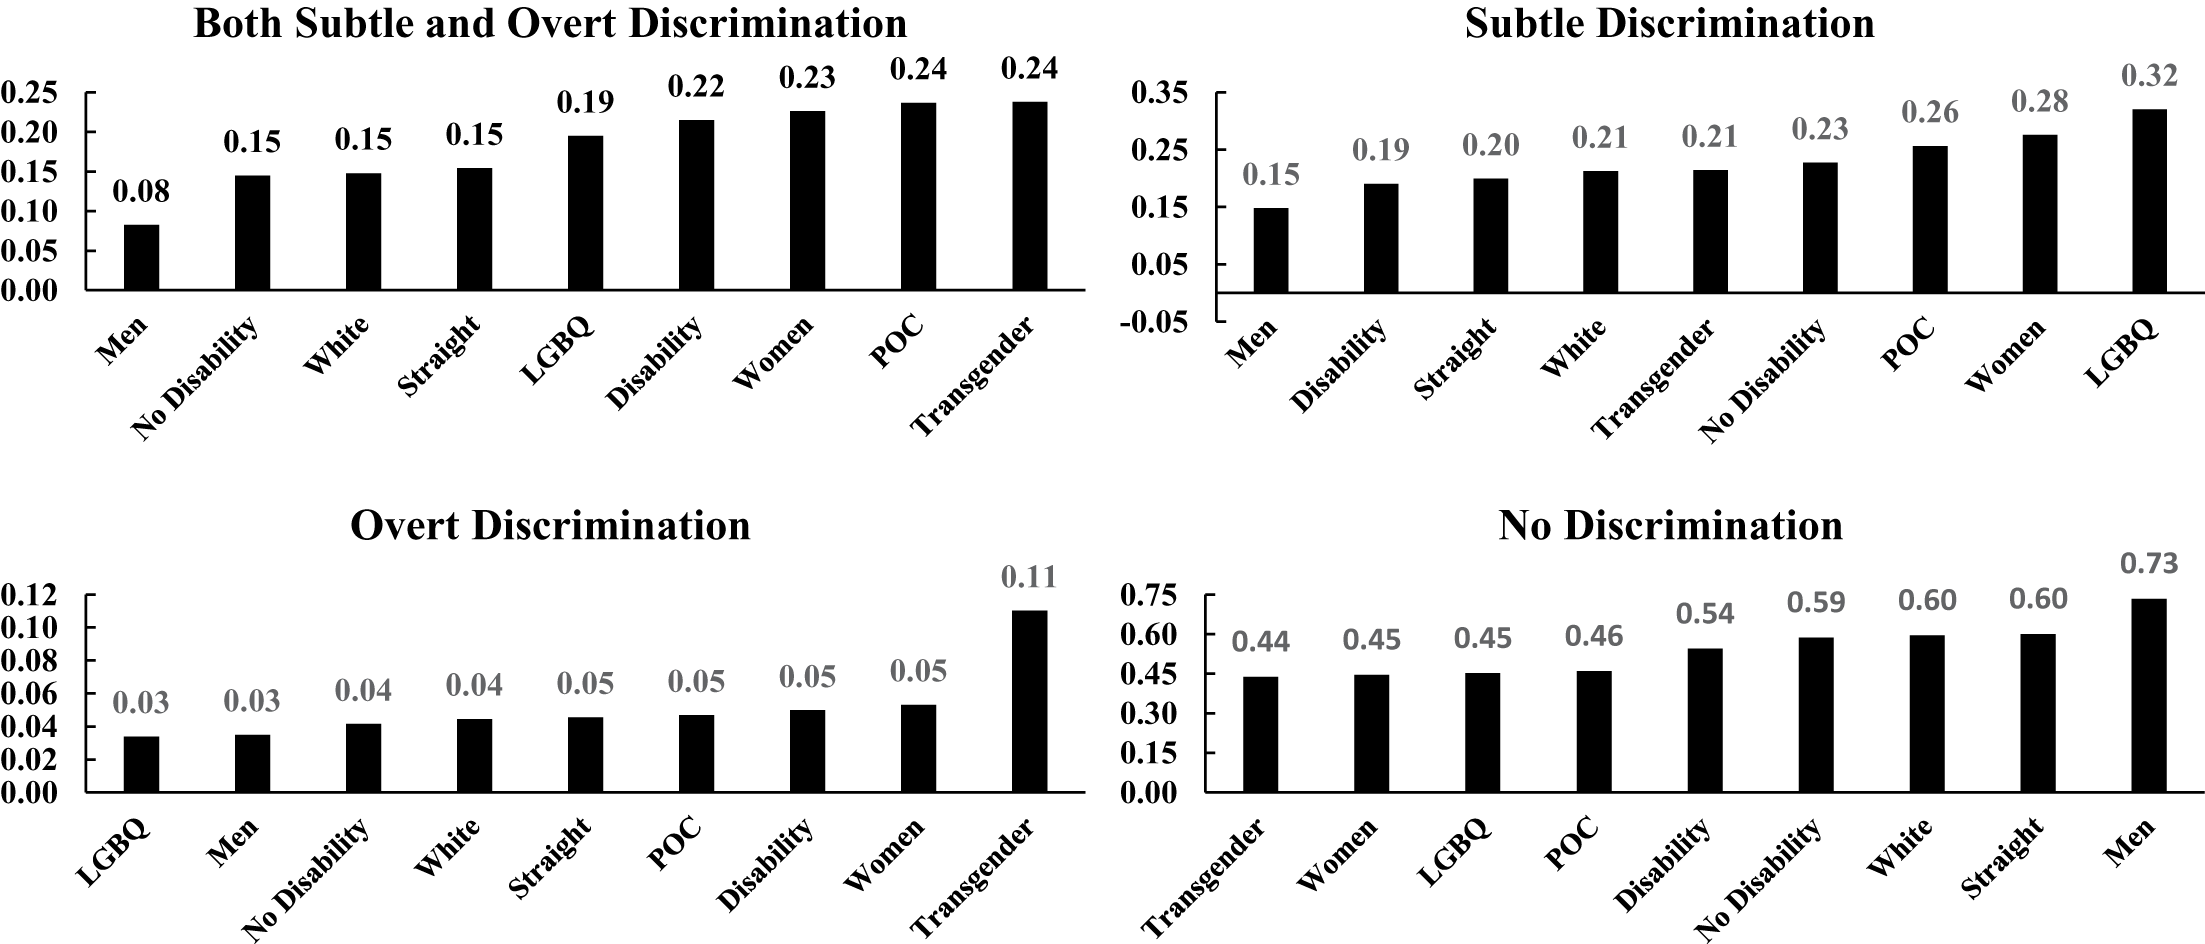
Both Types of Discrimination. Figure 1 displays the predicted probabilities for each type of discrimination report (both, subtle-only, and overt-only, and none) by individual identities. Reports of both types (i.e., the top left panel) are seven percentage points higher for people with disabilities than without (22% versus 15%), keeping other variables as they are in the dataset.
Predicted Probability of Reporting Discrimination
Notes: We use Average Adjusted Predictions (AAP) to calculate the expected probability of reporting discrimination. These numbers represent the average predicted probabilities that would be observed for a specific variable, all else remaining as it is in the data.

The probability of LGBQ lawyers reporting both types of discrimination is four percentage points higher than for heterosexual individuals (19% versus 15%). Women show a meaningfully higher probability of reporting both types of discrimination as compared to men (23% versus 8%), as do transgender lawyers as compared to men (24% versus 8%). Lawyers of color show a substantially higher probability of reporting both types of discrimination as compared to White individuals (24% versus 15%).
Subtle-Only Discrimination. The probability of reporting subtle-only discrimination is lower by four percentage points for lawyers with disabilities as compared to those without disabilities (19% versus 23%). In contrast, the probability of LGBQ lawyers reporting subtle-only is significantly higher than for heterosexual lawyers (32% versus 20%). Women show a substantially higher probability of reporting subtle-only discrimination as compared to men (28% versus 15%), as do transgender lawyers (21% versus 15%). Finally, the probability of reporting subtle-only discrimination is somewhat higher (26%) for racial/ethnic minorities as compared to White lawyers (21%).
Overt-Only Discrimination. Considering its overall low incidence, the probability of reporting overt-only discrimination is comparable for lawyers with and without disabilities (5% versus 4%). There is also little difference in the probability of reporting overt-only discrimination for LGBQ lawyers when compared to straight lawyers (3% versus 5%). Women show a relatively comparable probability of reporting overt-only discrimination as compared to men (5% versus 3%), while lawyers who identify as transgender show a higher probability of reports of overt-only discrimination as compared to men (11% versus 3%). There is little difference in the probability of reporting overt-only as between lawyers of color (5%) and White lawyers (4%).
No Discrimination. The probability of reporting no discrimination is lower for lawyers with disabilities compared to those without disabilities (54% versus 59%). The probability of LGBQ lawyers reporting no discrimination is meaningfully less than for straight lawyers (45% versus 60%). Women show a significantly lower probability of reporting no discrimination as compared to men (45% versus 73%), as do transgender lawyers as compared to men (44% versus 73%). Lawyers of color are meaningfully less likely to report no discrimination (46%) as compared to White lawyers (60%).
Summary. The findings suggest that lawyers with disabilities, who are people of color, and who are women or transgender show a higher probability of reporting both types of discrimination, as compared to other groups. Further, lawyers identifying as LGBQ, women, and people of color are more likely to report subtle-only discrimination. Transgender lawyers have the highest probability of experiencing overt-only discrimination.Footnote 114 Finally, men are the least likely to report all three types of discrimination, and consequently show the highest probability of reporting no discrimination.
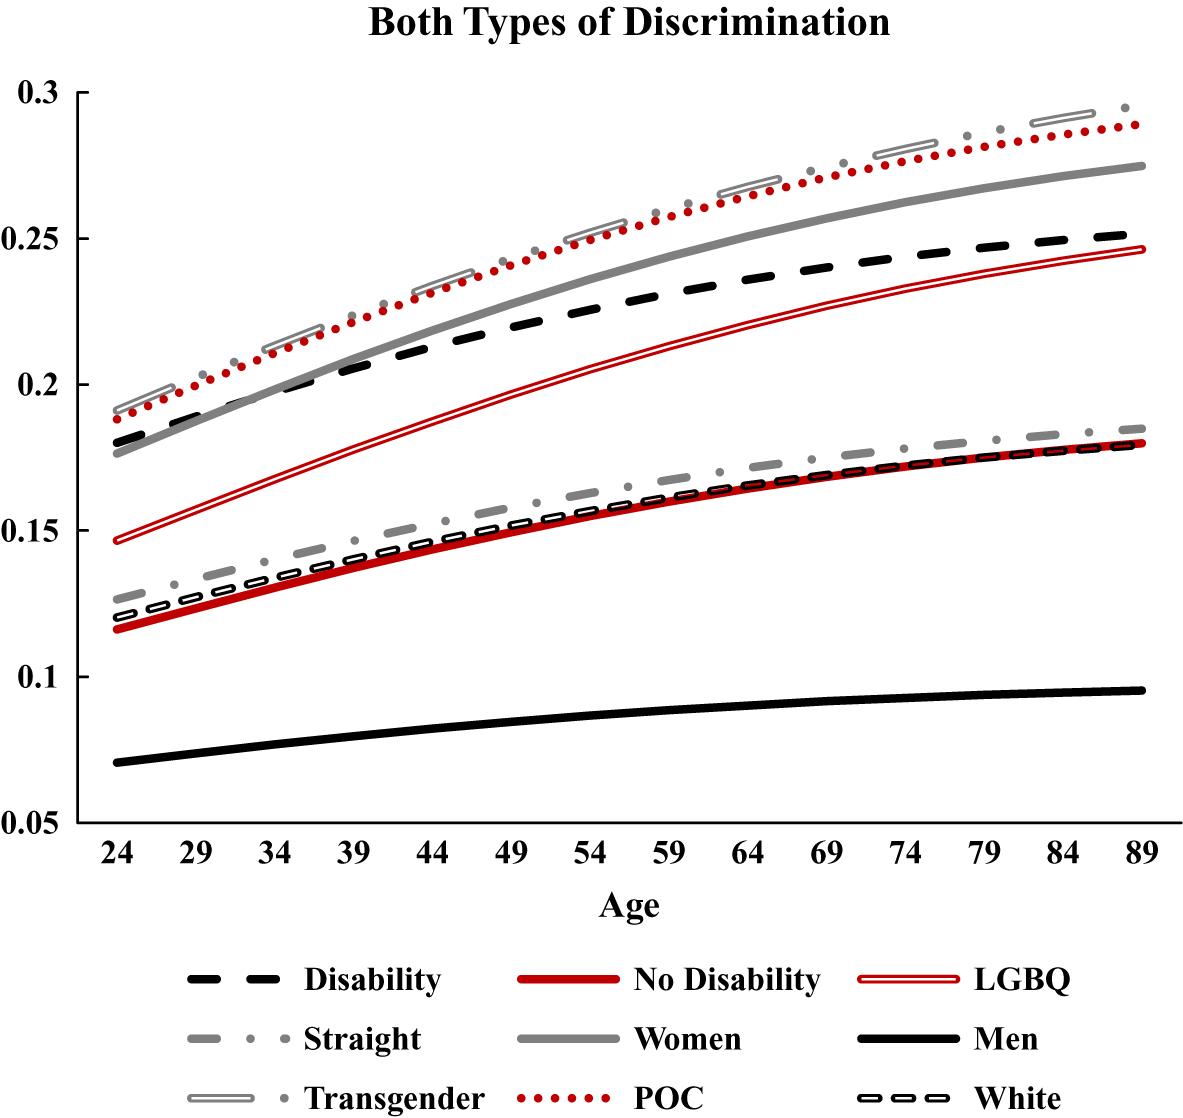
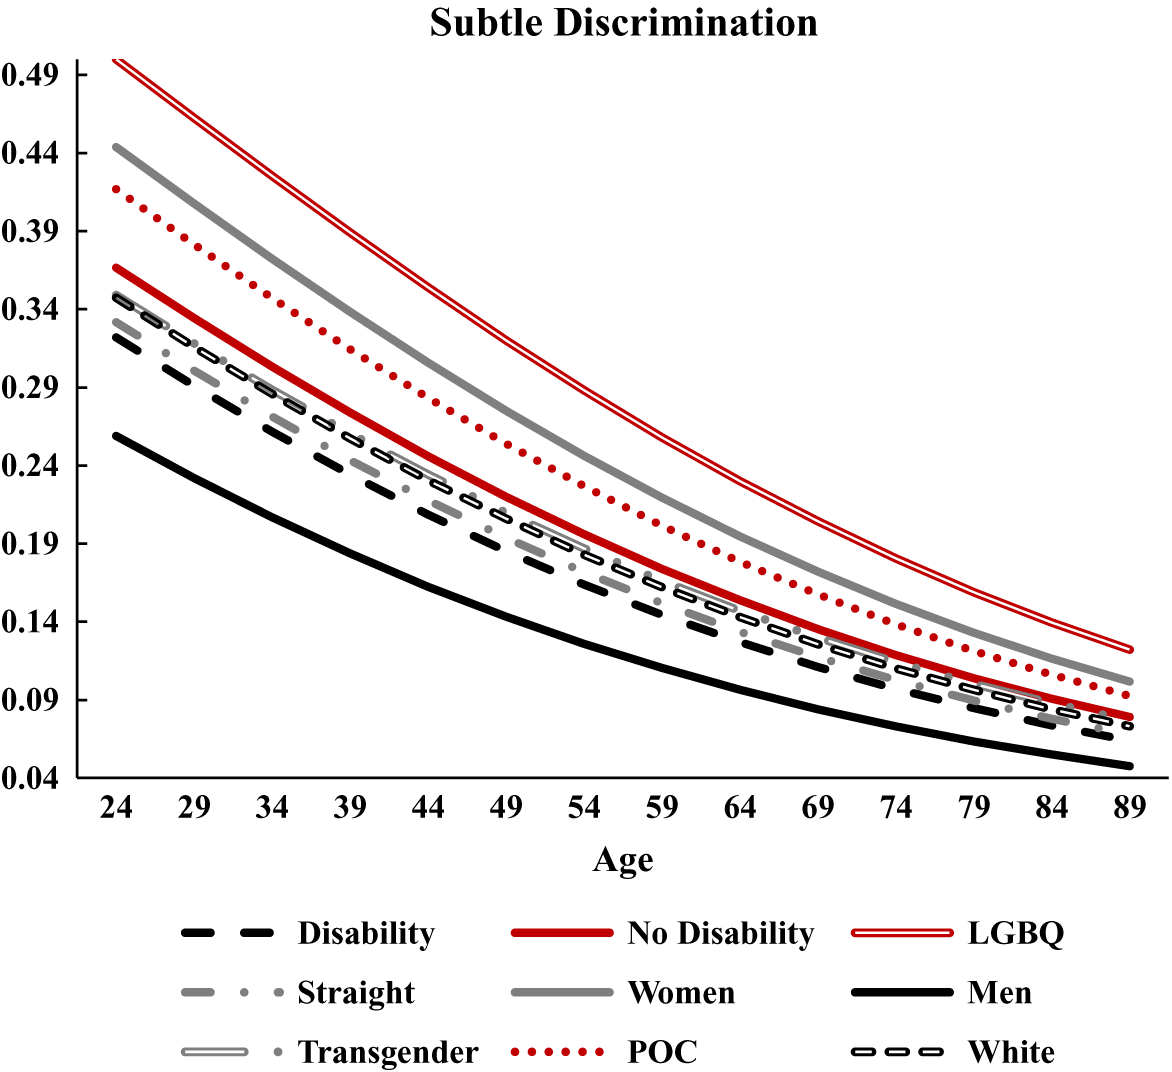
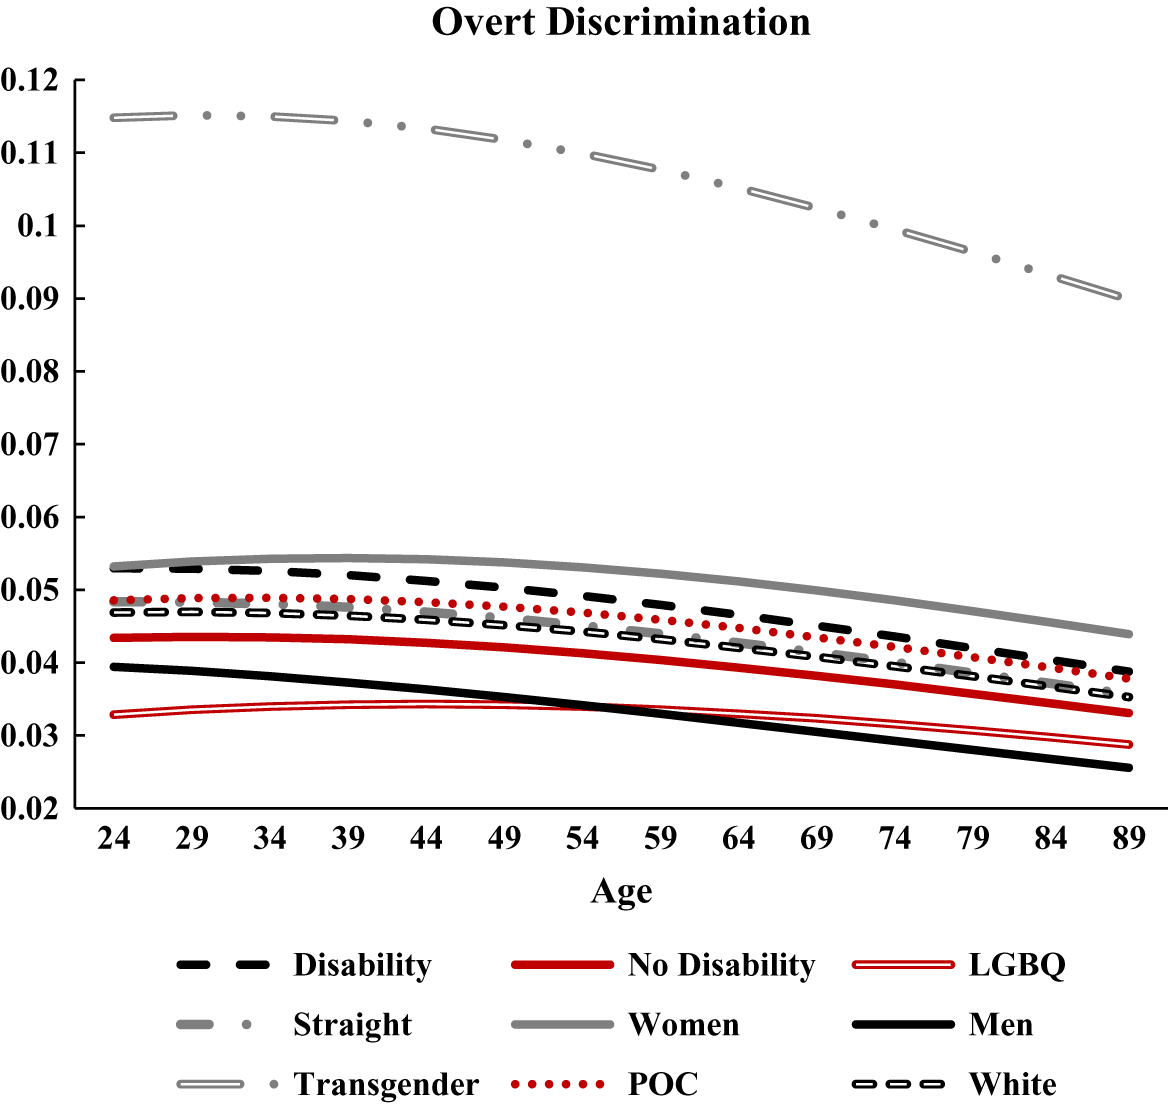
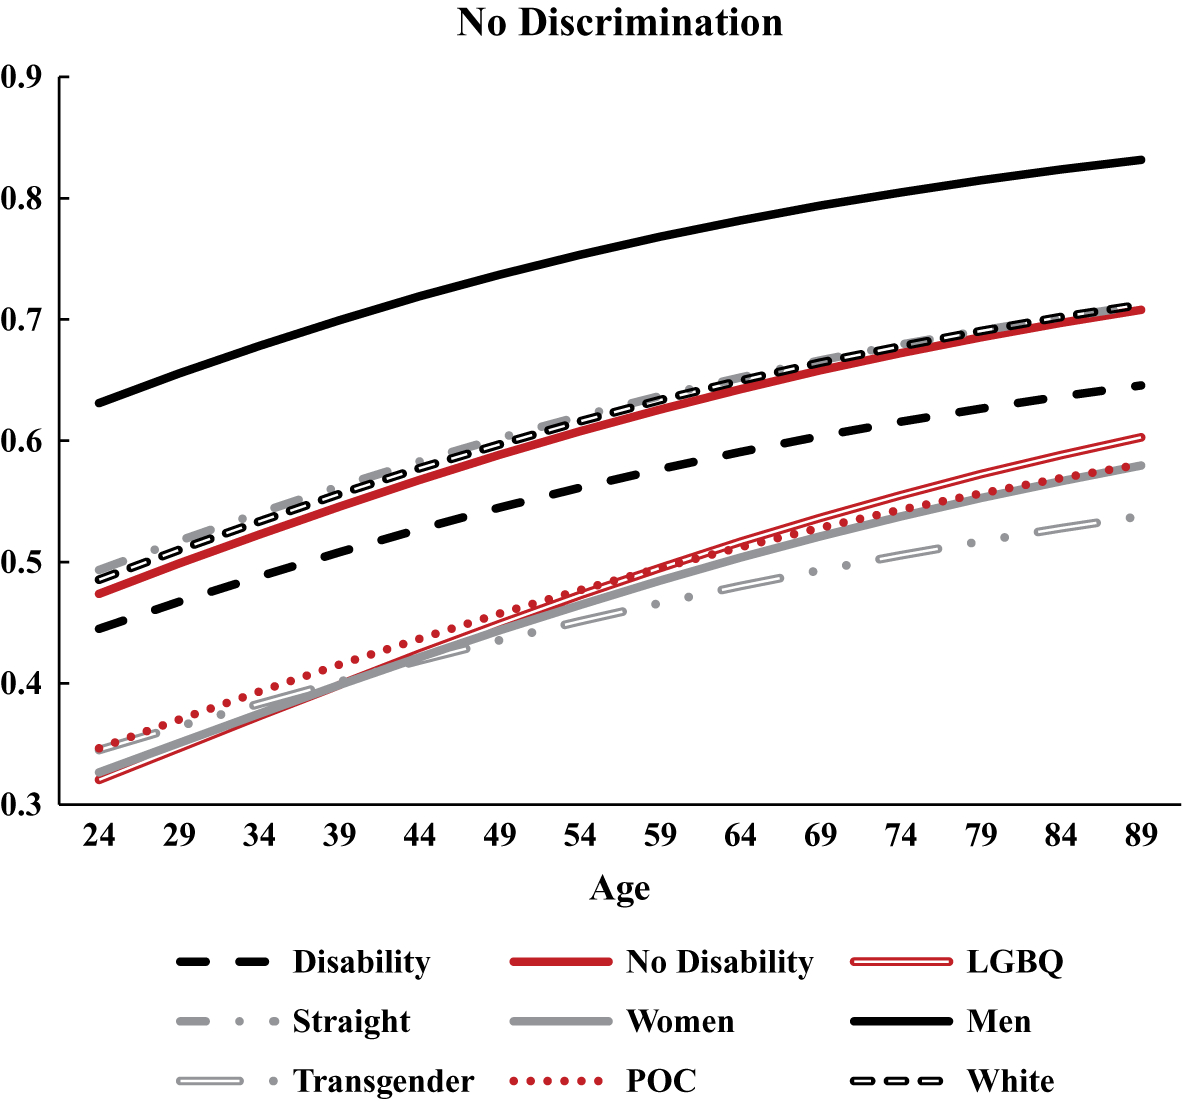
Age. The predicted probabilities for each group as a function of age show that the prospect of reporting both types of discrimination increases slightly with age for lawyers with and without disabilities, women/men/transgender, LGBQ/straight, and people of color/White (as presented in Appendix Figure 1a). In contrast, the probability of reporting subtle-only discrimination markedly declines with age for all these groups (Figure 1b), and there is a less steep decline for overt-only discrimination for all groups (Figure 1c). Age increases the probability of not experiencing discrimination for all groups (Figure 1d).
These results suggest that while the risk of reporting discrimination is reduced with age, such a countering role of age does not show its effect in the probability of reporting both types of discrimination. Extant research shows that discrimination experiences and reports generally decline with age,Footnote 115 which parallels our results for reports of subtle-only and overt-only discrimination. Other studies have, however, shown that particular forms of discrimination, such as disability-related discrimination, are more prevalent among older employees than younger ones.Footnote 116
The general upward trend with age in reports of both types of discrimination requires future study, for example, to examine the particular duration, severity, and context of such experiences over time, along with organizational factors associated with application of antidiscrimination laws and company policies. Nonetheless, studies about reports of discrimination and age are, overall, mixed, with some previous studies showing that older workers are more likely to perceive workplace discrimination, possibly due to their greater interpersonal and workplace experiences.Footnote 117
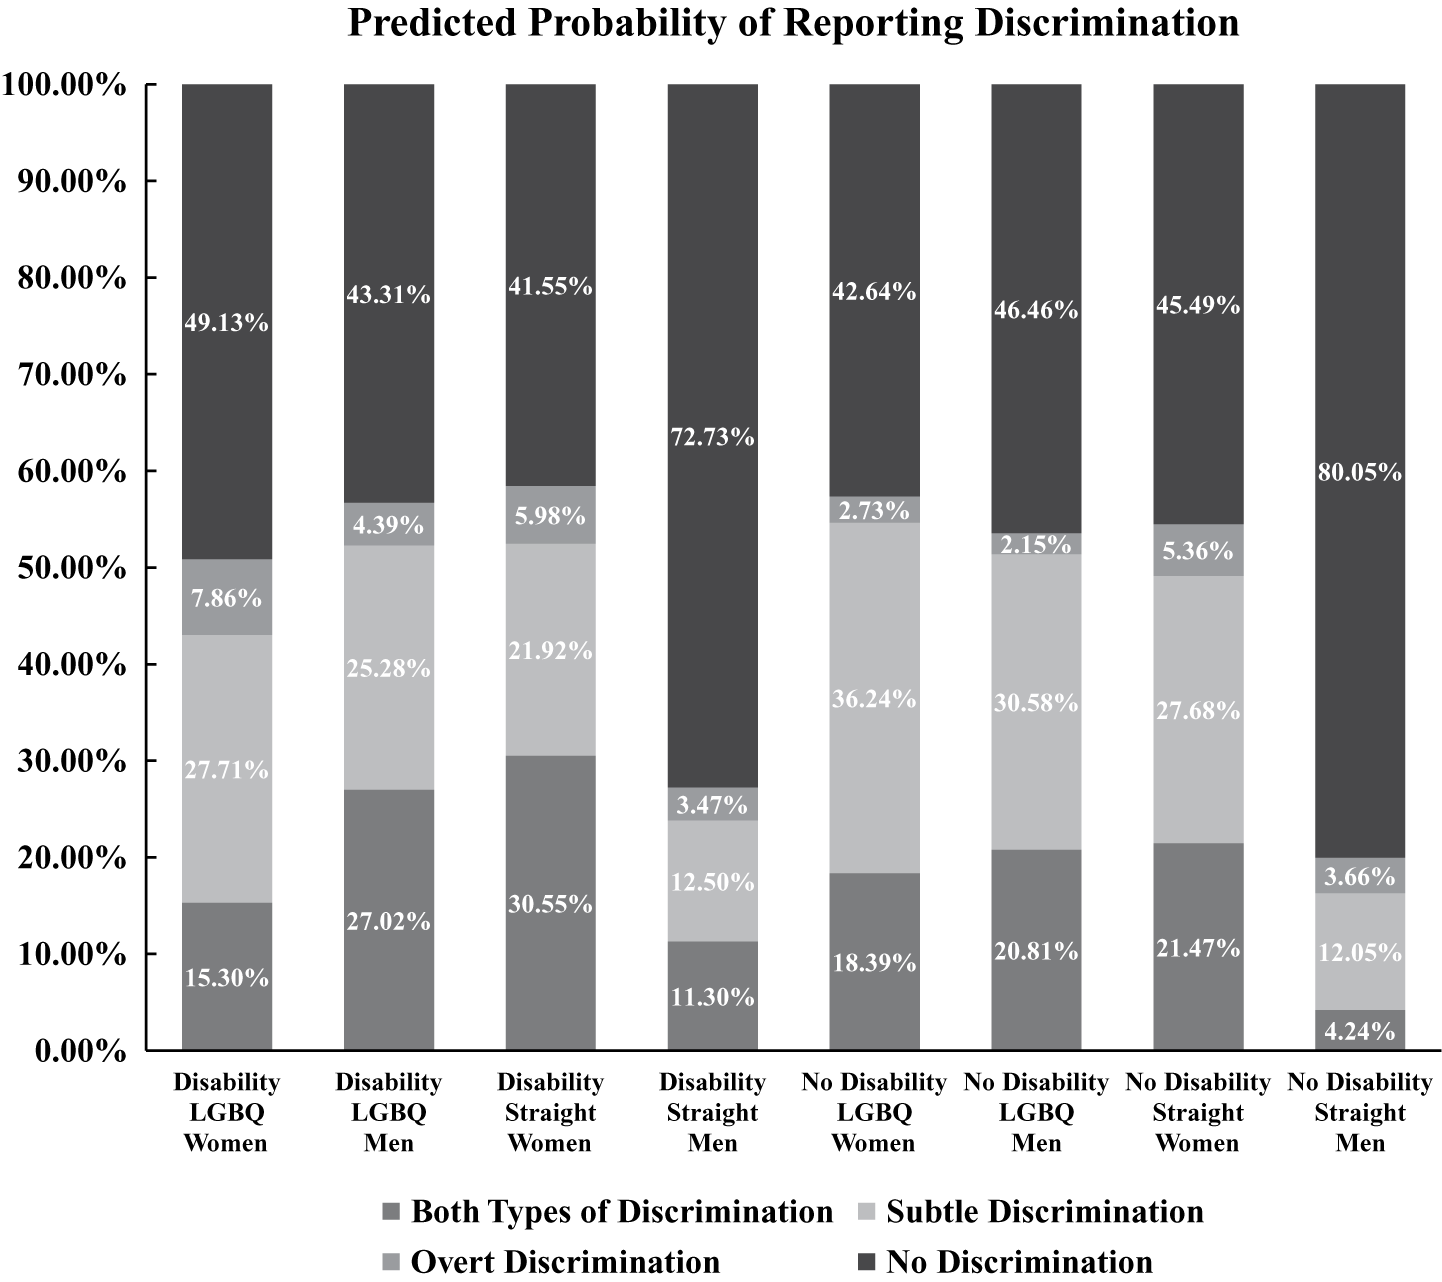
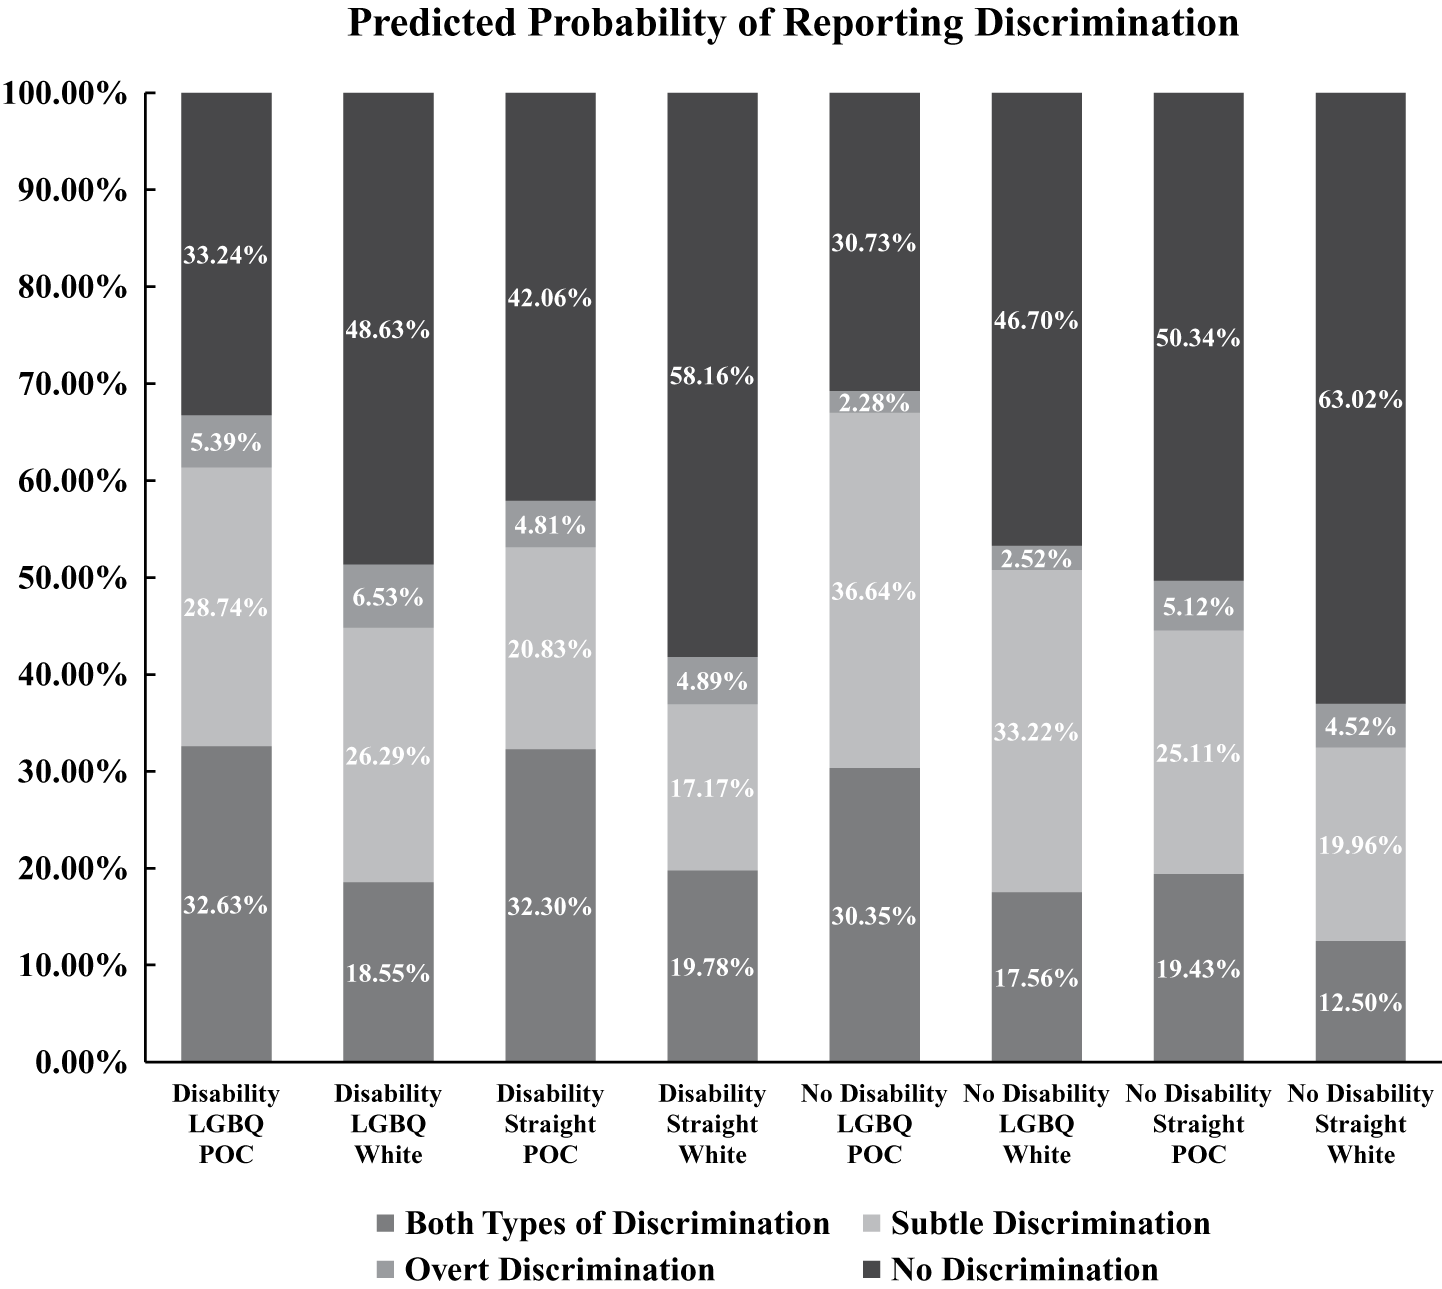
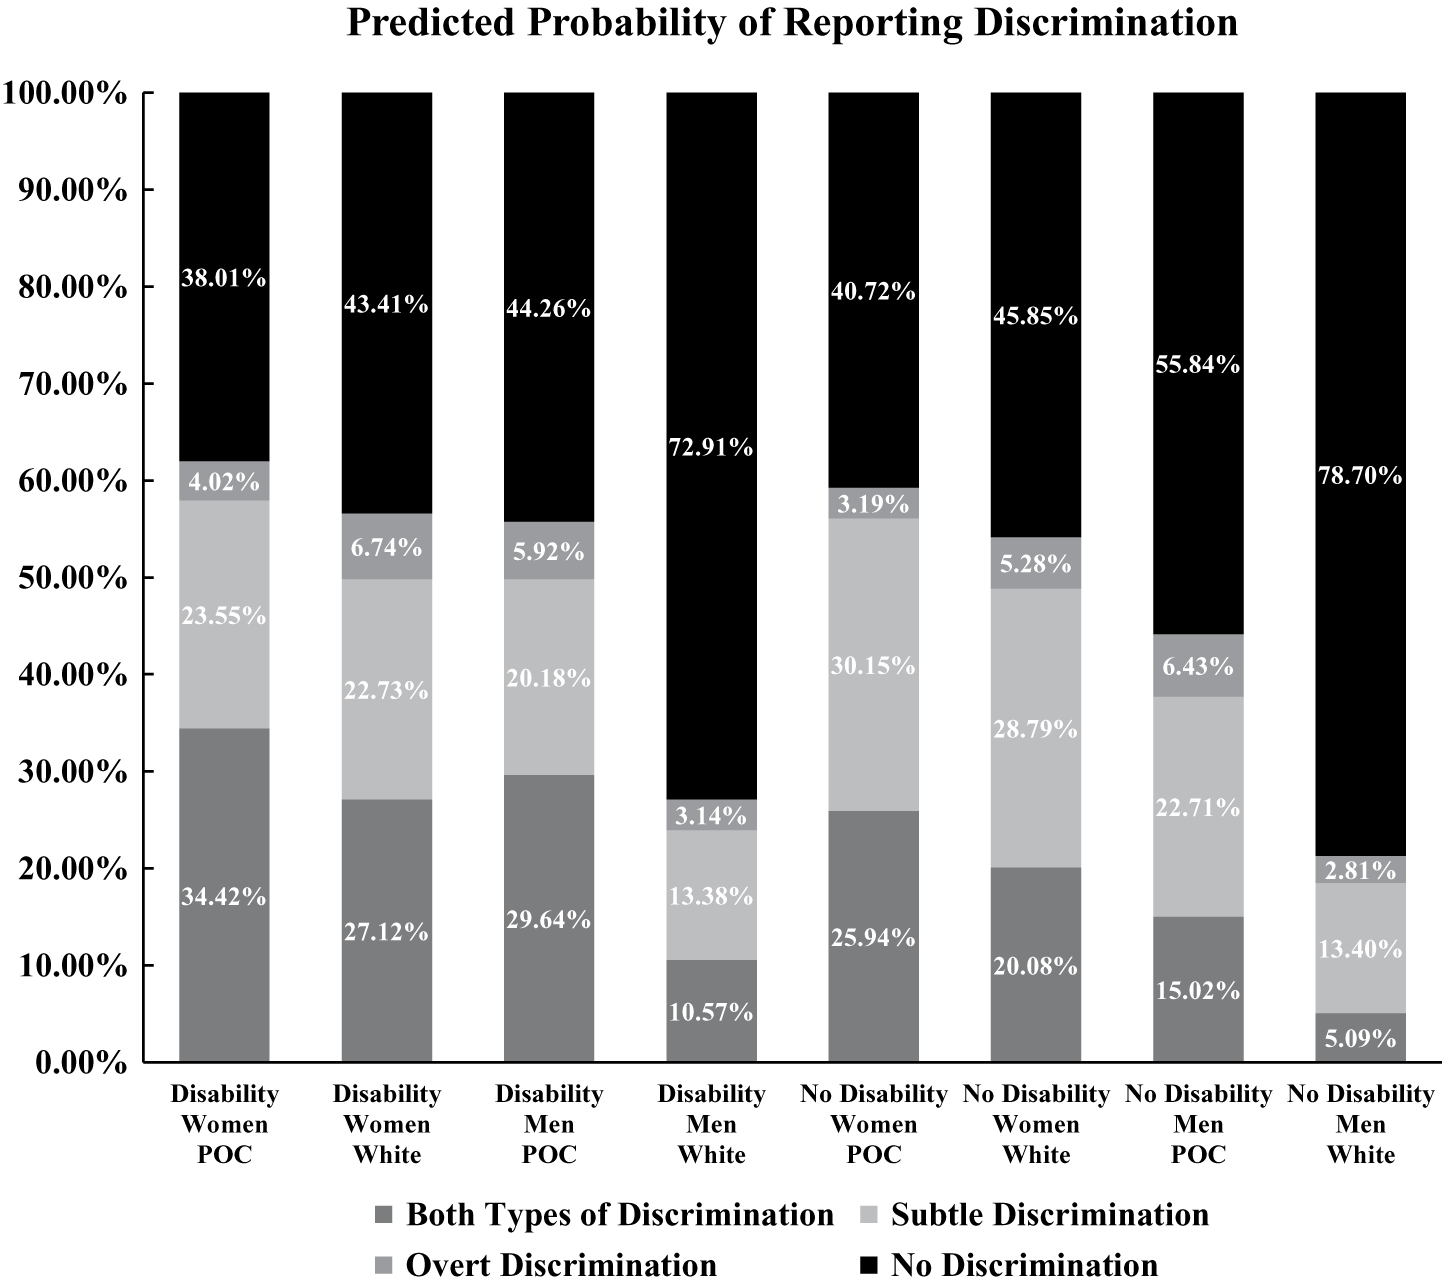
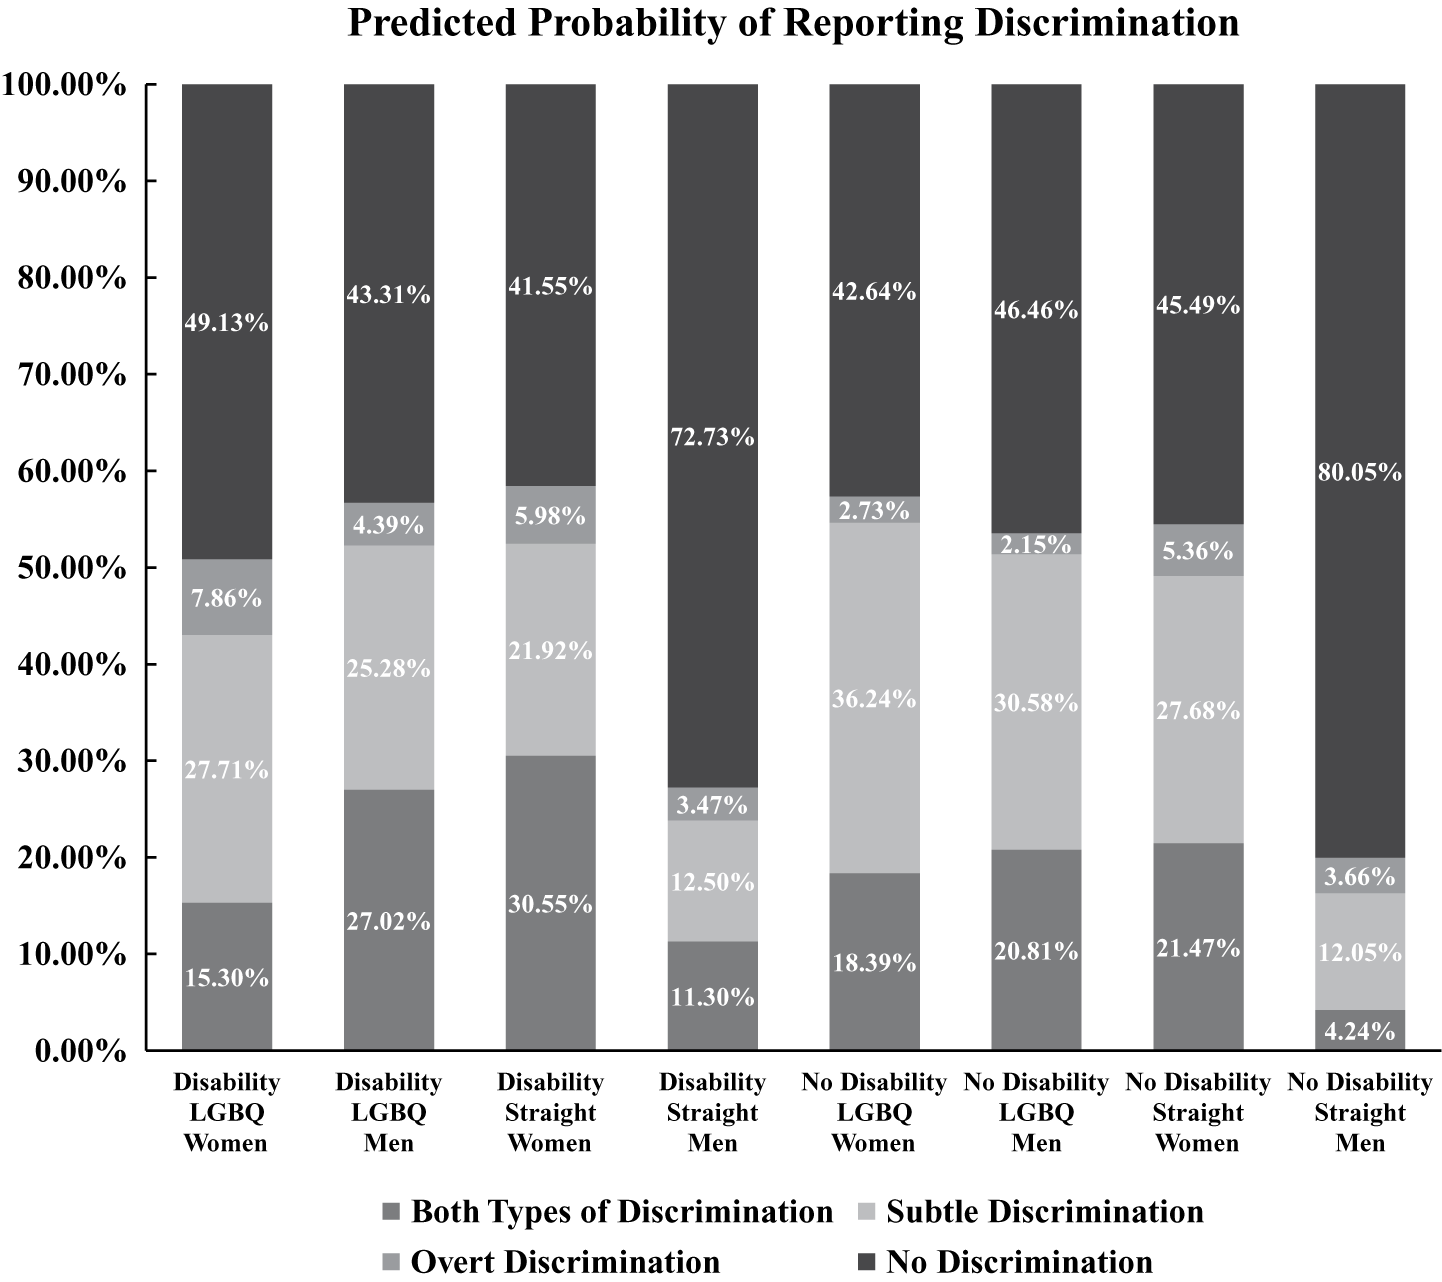
Intersectional Analyses. Exploratory intersectional analyses are presented in Figures 2, 3, and 4. These figures show predicted probabilities for combinations of individual identities comprising disability, sexual orientation, gender, and race/ethnicity. These analyses are exploratory at this stage because we do not know, for example, which of these identities may be considered primary or in unique combination, and how they might be affected across time, circumstance, and context.Footnote 118
Predicted probability of reporting discrimination for all combinations of disability, sexual orientation, and gender (only men and women)
Notes: We use Average Adjusted Predictions at Representative values (APR) to calculate the expected probability of reporting discrimination. Specifically, we compute the average predicted probabilities at representative values of disability, sexual orientation, and gender, all else remaining as it is in the data.
Predicted probability of reporting discrimination for all combinations of disability, sexual orientation, and race/ethnicity
Notes: We use Average Adjusted Predictions at Representative values (APR) to calculate the expected probability of reporting discrimination. Specifically, we compute the average predicted probabilities at representative values of disability, sexual orientation, and race, all else remaining as it is in the data.

Predicted probability of reporting discrimination for all combinations of disability, gender (women and men only), and race/ethnicity
Notes: We use Average Adjusted Predictions at Representative values (APR) to calculate the expected probability of reporting discrimination. Specifically, we compute the average predicted probabilities at representative values of disability, sexual orientation, and race, all else remaining as it is in the data.

The far-right column of Figure 2 shows that straight men without disabilities have the highest probability of not reporting discrimination (80%), followed by straight men with disabilities (73%). For reports of both types of discrimination, straight women with disabilities show the highest probability (31%). For subtle-only, LGBQ men and women without disabilities (the fifth and sixth columns from the left, at 36% and 31%), show among the highest relative probabilities of reporting. The overall incidence and range of overt discrimination is low, but LGBQ women with disabilities show the highest probability of reporting this type of discrimination (8%).Footnote 119
The results in Figure 3 show predicted probabilities for a different set of identity combinations, in this case disability, sexual orientation, and race/ethnicity. Paralleling the findings in Figure 2, the far-right column of Figure 3 shows that straight White lawyers without disabilities have the highest probability of not reporting discrimination (63%), followed by straight White lawyers with disabilities (58%).
Figure 3 shows that for both types of discrimination, among the higher predicted probabilities for reporting are: LGBQ individuals who are racial/ethnic minorities with disabilities (33%), straight individuals who are racial/ethnic minorities with disabilities (32%), and LGBQ individuals who are racial/ethnic minorities without disabilities (30%). For subtle-only discrimination, among the higher predicted probabilities for reporting are: LGBQ individuals without disabilities who are racial/ethnic minorities (37%), LGBQ White individuals without disabilities (33%), and LGBQ individuals with disabilities who are racial/ethnic minorities (29%). For overt-only discrimination, the incidence is lower, and thus it is difficult to discern meaningful differences among the groups, but the highest relative probability for reporting is among LGBQ individuals with disabilities who are White (7%).
The results in Figure 4 display predicted probabilities for a last set of exploratory identity combinations: disability, gender, and race/ethnicity. As before, Figure 4 shows that White men, with and without disabilities, have the highest predicted probabilities for reporting no discrimination (far right column at 79%, and fifth column from right at 73%).
By contrast, women of color with disabilities show the highest probabilities for reporting both types of discrimination (34%), with second highest for men of color with disabilities (30%). Women without disabilities who are racial/ethnic minorities show the highest probabilities for reporting subtle-only discrimination (30%).Footnote 120 For overt-only, the incidence is relatively low, and among those reporting the highest probabilities are White women with disabilities (7%), men who are racial/ethnic minorities with disabilities (6%), and men who are racial/ethnic minorities without disabilities (6%).
V. DISCUSSION
Our program of investigation and our current study aim to provide an incremental step in understanding the non-monochromatic and intersectional aspects of individual identity in the legal profession, with particular focus on disabled and LGBTQ+ lawyers. The findings illustrate that individual minority identities—disability, sexual orientation, gender, race/ethnicity, and age—are associated with reports of discrimination in the legal workplace.Footnote 121
Although context and circumstance are important and determinative, the findings show that lawyers with disabilities and who identify as LGBQ are at a significantly higher relative risk of reporting both types of discrimination (versus no discrimination) when compared to their peers. The findings support those of prior studies that individuals with these minority identities often experience forms of ill-treatment, oppression, and discrimination in the legal profession,Footnote 122 as well as in other professions.Footnote 123
The findings further illustrate that the effects of disability on the reporting of discrimination vary by sexual orientation and gender. Thus, women lawyers with disabilities and LGBQ lawyers with disabilities show a lower risk of reporting both types of discrimination as compared to their counterparts. These findings, however, do not decrease significantly the overall probability of reporting discrimination for LGBQ individuals with disabilities, as shown in Figures 2 and 3. The trends align with those of Ryan Miller and colleagues who find that LGBTQ+ students with disabilities report high levels of microaggressions.Footnote 124 Nonetheless, the constraints of their study, similar to those of ours, mean that Miller and colleagues are not able to determine that such experiences are a direct response to disability or sexual orientation disclosure, or a unique response to the intersection of these two identities.
In an analogous manner, our findings are in accord with those of Carrie Griffin Basas, showing that lawyers with disabilities who are women evidence high relative rates of discrimination reports, and that they tend to self-accommodate to avoid drawing attention to their disabilities and the associated threats of stigma, despite their ADA accommodation rights.Footnote 125 Yet other studies show that women with disabilities have a higher likelihood of reporting unmet workplace support needs compared to nondisabled men.Footnote 126 Similar complex psychological mechanisms and stigma-avoidance strategies involving identity disclosure likely are present in regard to the reporting of workplace discrimination, which also may be highly situationally dependent.Footnote 127 In our forthcoming studies on identity disclosure in the legal profession, we are examining such considerations as associated, for example, with less and more stigmatized disability identities.Footnote 128
As said, individuals who identify as LGBQ are more likely to report both types of discrimination, as well as subtle-only discrimination, when compared to those who identify as straight. Studies show, however, that LGBQ individuals also experience overt forms of workplace discrimination, including harassment, bullying, abuse, and vandalism.Footnote 129 Lee Badgett and colleagues estimate that between 12% and 30% of heterosexual co-workers reported witnessing discrimination in the workplace against LGB individuals.Footnote 130 Other studies show that prejudice and discrimination against LGBQ employees often manifest as microaggressions and other less overt forms of discrimination,Footnote 131 trends supported by our findings.
Reported discrimination on the basis of sexual orientation also varies by gender and disability. As predicted, it appears that the degree of identity “visibility,” whether for disability or LGBQ individuals, is associated with identity disclosure (e.g., when disclosure is made for request and provision of workplace accommodations)Footnote 132 and with likelihood of stigma and discrimination at the time of disclosure and subsequently.Footnote 133
In a thoughtful review of this Article and its implications for diversity and inclusion in the legal profession going forward, Ryan H. Nelson and Michael Ashley Stein offer their suggestion that close future attention be paid to how workplace discrimination (perhaps as reflected by a culture tolerating such behavior) serves to deter workers from disclosing their multiple minority identities.Footnote 134 Indeed, Nelson and Stein point out that the disclosure process itself, for less visible identities, may be associated with subsequent reports of overt and subtle discrimination.Footnote 135
Shain A. M. Neumeier and Lydia X. Z. Brown, in their insightful review of this Article, additionally call for close exploration of individual differences in the disclosure process, particularly when individuals with less obvious identities request unique forms of workplace accommodation.Footnote 136 Our next planned studies will be more detailed and comprehensive as to information on the accommodation interactive process. We will examine moderating variables associated with common and less customary accommodation requests, and factors of individual self-advocacy, manager attitudes and experience, organizational trust and culture, and perceived costs and benefits over time. This line of study will enable closer exploration of the multifaceted reasons for accommodation request and provision, as well as the development of individual and systemic interventions designed to enhance the efficacy of the accommodation interactive process and its outcomes.Footnote 137
In accord, studies by Anna Brzykcy and Stephan Boehm, and others, show that, alone, the categorization of individuals with differing disabilities, often required to make an individualized assessment for the provision of effective workplace accommodations and supports, actually leads to perceptions and experiences that result in fewer opportunities for relationship-building and trust in the workplace.Footnote 138 The tricky calculus is to incentivize positive and proactive ways to encourage meaningful and fair disclosure of invisible and potentially stigmatized individual identities in ways that encourage productive, respectful, and effective supports in work tasks, work groups, and workplace cultures, and in accord with civil rights laws and policies.Footnote 139
We also find a generally higher relative risk of reports of discrimination to be associated with women and people of color. The results in this study comport with other research examining the workplace experiences of people of color and women.Footnote 140 Our findings that women experience all three types of discrimination at a higher relative rate than men comport with the recent exploratory findings of Caroline Jalain showing that women are more likely to experience one or more forms of discrimination in the workplace as compared to their male counterparts.Footnote 141 As could be expected, straight White men without disabilities report among the lowest probabilities of discrimination and evidence the highest probability of not reporting discrimination.Footnote 142
Individual and organizational factors, such as tenure, and type and size of organization, are important.Footnote 143 For instance, our results suggest that working in a private organization reduces the likelihood of reporting discrimination, while working for a large organization increases the risk of reporting subtle-only discrimination. Longer tenure generally is associated with a higher rate of reporting subtle-only discrimination, but not with the other types of discrimination assessed. These trends correspond with findings from Debbie Foster and Natasha Hirst on the role of seniority in the United Kingdom’s legal profession.Footnote 144 Currently, we are examining associations with variations in organization type and size, and particular organizational characteristics will be of focus in the next survey phase.
The findings here are both exploratory and illustrative, and as such must be considered with caution. We could not, and did not, delve fully into the underlying myriad reasons and circumstances associated with reported discrimination, such as those linked to issues of remuneration, disclosure,Footnote 145 identity visibility, personality characteristics, work team structure and task, firm culture, and support for D&I by leadership at the organization.Footnote 146
We do, however, expect to look into some of the circumstances. For example, we are currently examining the relationship between reports of discrimination and wage levels over time. We may expect that lawyers with lower relative wages, indicating less economic security and power in the organization, experience higher risks such as job turnover or accommodation-request rejection when reporting workplace discrimination. Conversely, as salaries increase, individuals with minority identities may increase their likelihood of calling out discrimination in their firms.Footnote 147 These ideas for future study are supported by our preliminary findings showing substantial pay gaps for individuals with minority identities.Footnote 148
In our ongoing studies, we are examining factors in firms that may mitigate discrimination and bias experienced and reported by individuals with multiple minority identities, both at the individual, team/work-group, and organizational levels, and in terms of attitudinal and structural barriers to equal work opportunities.Footnote 149 Extant studies show disability employment inclusion strategies and practices to be beneficial, especially in relation to hiring.Footnote 150 Our future research will directly consider and address disability inclusion strategies and employment outcomes in the legal profession.
The current study was conducted during the year and one-half before the global health and economic emergency of 2020. The issues identified have been further complicated by the pandemic and the resulting reevaluation of how work is performed and structured in the legal and other professions.Footnote 151 The pandemic is drastically affecting the personal, health-related, and social experiences of persons with disabilities, especially those with multiple minority identities of race, ethnicity, class, sexual orientation, gender identity, and age.Footnote 152
Research is necessary to examine the extent to which the new norms about work and the workplace resulting from the ongoing pandemic, such as working remotely and from home, affect identity disclosure, individual and team work, collaboration and leadership, and potential workplace discrimination on the basis of physical and mental disability, as well as other individual characteristics.
Our preliminary and forthcoming findings suggest that lawyers reporting mental health conditions are less likely to disclose their conditions in the legal workplace, and that they are more likely to report certain types of discrimination, as compared to individuals with other conditions such as sensory disabilities.Footnote 153 Our findings are supported by keen observations from leading scholars—such as Elyn Saks, who commented on this Article—describing the unique and pervasive stigma and discrimination experienced by individuals living with mental health conditions.Footnote 154 The stigma associated with mental health and other less visible conditions, in light of public health restrictions that limit social interactions within and outside the workplace, may exacerbate tendencies for subtle and other forms of discrimination.Footnote 155 If not addressed, these trends may negatively affect career opportunities for lawyers with multiple minority identities and further impact their physical and mental health.Footnote 156
In light of the impact of COVID-19 on the nature of work, the workplace, and organizational culture, future studies are needed to explore the provision of workplace accommodations and supports during and after the pandemic. Prior to the pandemic, among the most commonly reported workplace accommodations for persons with physical disabilities were modifications of job responsibilities, changes in workplace policies, flexible scheduling, and the provision of assistive technology.Footnote 157 We still do not know how the new work norms necessitated by the pandemic will affect the provision of workplace accommodations for individuals across the spectrum of disabilities.
Do pervasive attitudinal stigma and prejudice, as well as structural discrimination, imposed on individuals with multiple marginalized identities still exist today in the United States and in the legal profession? Of course they do; our findings here support this conclusion.Footnote 158 But discrimination takes many forms, from simple avoidance, to implicit and subtle bias, to overt discrimination, exclusion, and hostility. As lawyers, we seek to redress discrimination and oppression in society at large. The current study is one helpful (and hopeful) step towards eradicating workplace discrimination, in all its pernicious forms, in the legal profession and elsewhere.Footnote 159
A. Limitations and Next Steps
This study relies upon individual lawyers to report their experiences of perceived bias and discrimination in the workplace. There are recognized limitations to studies involving self-reports about personal experience with discrimination, such as not being able to observe the purported injustice or discrimination in context and in real time.Footnote 160 Still, relying on co-workers’ or managers’ reports of such experiences, or on official records from complaints or litigation, does not necessarily capture the deeply personal and unique perceptions and experiences of discrimination and bias, in all their forms. In forthcoming studies, we will make a more individualized analysis of the experiences of our respondents through qualitative survey responses to offer additional insights into our respondents’ perceptions and workplaces. This approach is meant to advance our longer-term objective of improving knowledge and efficacy of organizational D&I+ efforts and promoting them.
Due to underlying systems and organizational structures that produce and allow discrimination to continue in the workplace, we would expect parties to underreport experiences of discrimination. In our current efforts, we are considering new ways to capture the multifarious nature of discrimination and bias in the profession, such as using multiple perspectives from team or work groups and exploring the associations of workplace discrimination with remuneration and benefits, promotions, assignments, hours worked, aspects of job satisfaction, and quality of work/life balance.Footnote 161
We again recognize that the use of overly broad terms such as “disability,” “LGBTQ+,” and “racial/ethnic minority” or “person of color” does not adequately acknowledge the unique individual and multiple identities, often associated with inequality and oppression, that exist across and within these individual categories of convenience. In this investigation, we collect qualitative responses to document the experiences of individuals with multiple marginalized identities. Our forthcoming articles present such information, further illuminating the complex ways in which discrimination is experienced, reported, and addressed for individuals with multiple minority identities.Footnote 162
The same lack of nuance is found in our reports of individual “discrimination” and “bias” as “overt and subtle” and “intentional and unintentional.” This labeling scheme is a place to start, but it is overly simplistic. That is why we are now examining in detail the quantitative measures and rich qualitative descriptions of reports of discrimination and bias that we have generated from the surveys deployed.
We further recognize that, although in certain aspects the current sample is consistent with national labor demographics, in other aspects it is not. This is due, in part, to our purposeful oversampling of legal professionals with disabilities and who identify as LGBTQ+, which was the primary focus of phase one of this investigation.Footnote 163 Nonetheless, these and other multiple-identity marginalized groups remain underrepresented in the literature on discrimination in the legal profession. In our phase two survey of this longitudinal investigation, we aim to explore in additional detail the experiences of individuals with multiple marginalized identities from an intersectional perspective.Footnote 164
No study released during this era can ignore how the pandemic is changing all our life experiences, and rarely for the better. As noted earlier, our survey was distributed, and the data collected, shortly before the pandemic. Future study will need to look closely, among other things, at how the pandemic has affected the lives of a profession in which many members already struggle with stress and discriminatory approaches to mental health issues of various kinds.Footnote 165 It is a profession that increasingly must be mindful of the value of the inherent diversity of its members, and its members must call out and address the uneven effects of the pandemic on historically marginalized members of the profession.Footnote 166
A further note is in order: while the legal profession is often a stressful and competitive one, it is also a distinctive, and generally privileged, profession. Lawyers, as a group, are relatively higher paid and educated professional workers, and they are often in positions that offer relatively greater access to job security and economic power.Footnote 167 Presumably, for this cohort there would be relatively enhanced access to workplace accommodations and other benefits of employment, and an overall mitigation within the profession of discrimination and bias.Footnote 168 Unfortunately, we are not able to support that position at this time based on the responses of this cohort.Footnote 169 We currently are examining concurrent data collected from about 800 legal support professionals, primarily paralegals, as a comparator to the cohort of lawyers.
Lastly, despite efforts to sample underrepresented and marginalized groups, and despite attaining a relatively large sample in relation to prior studies, generalizing the current findings must proceed with caution given the relatively small number of respondents with multiple minority identities. Nonetheless, as mentioned, in phase two of this longitudinal investigation we will closely examine these complex personal experiences over time.Footnote 170 We will also study, as suggested by Neumeier and Brown, changes over time in D&I and D&I+ policies and practices across and within organizations, and the implications for attorneys identifying as disabled and LGBTQ+, along with their other individual identities.Footnote 171 This will shine additional light on largely unreported cohorts and carry important implications for the development of future research and the efficacy of potential intervention strategies in this program of study and others, as well as on the associated development of organizational culture and relevant case law.Footnote 172
VI. CONCLUSION
This study examined discrimination and bias reported by lawyers with multiple marginalized identities in a conceptual framework of enhanced D&I+ practices in the legal profession. The body of study considers the dynamic and multidimensional experiences of people with disabilities and those who identify as LGBTQ+, along with other identities across race/ethnicity, gender, and age.
Future articles in this series will examine considerations over time associated with how identity disclosure, stigma, and reported discrimination and bias play out in the legal workplace.Footnote 173 The longer-term objective is to contribute to efforts to mitigate bias and discrimination facing persons with minority identities and to further a culture of inclusion—D&I+, as we call it—in the legal profession.Footnote 174
APPENDIX
Determinants of Reporting Discrimination in the Workplace (Multinomial Logistic Regression with Subtle Discrimination as Base Outcome)
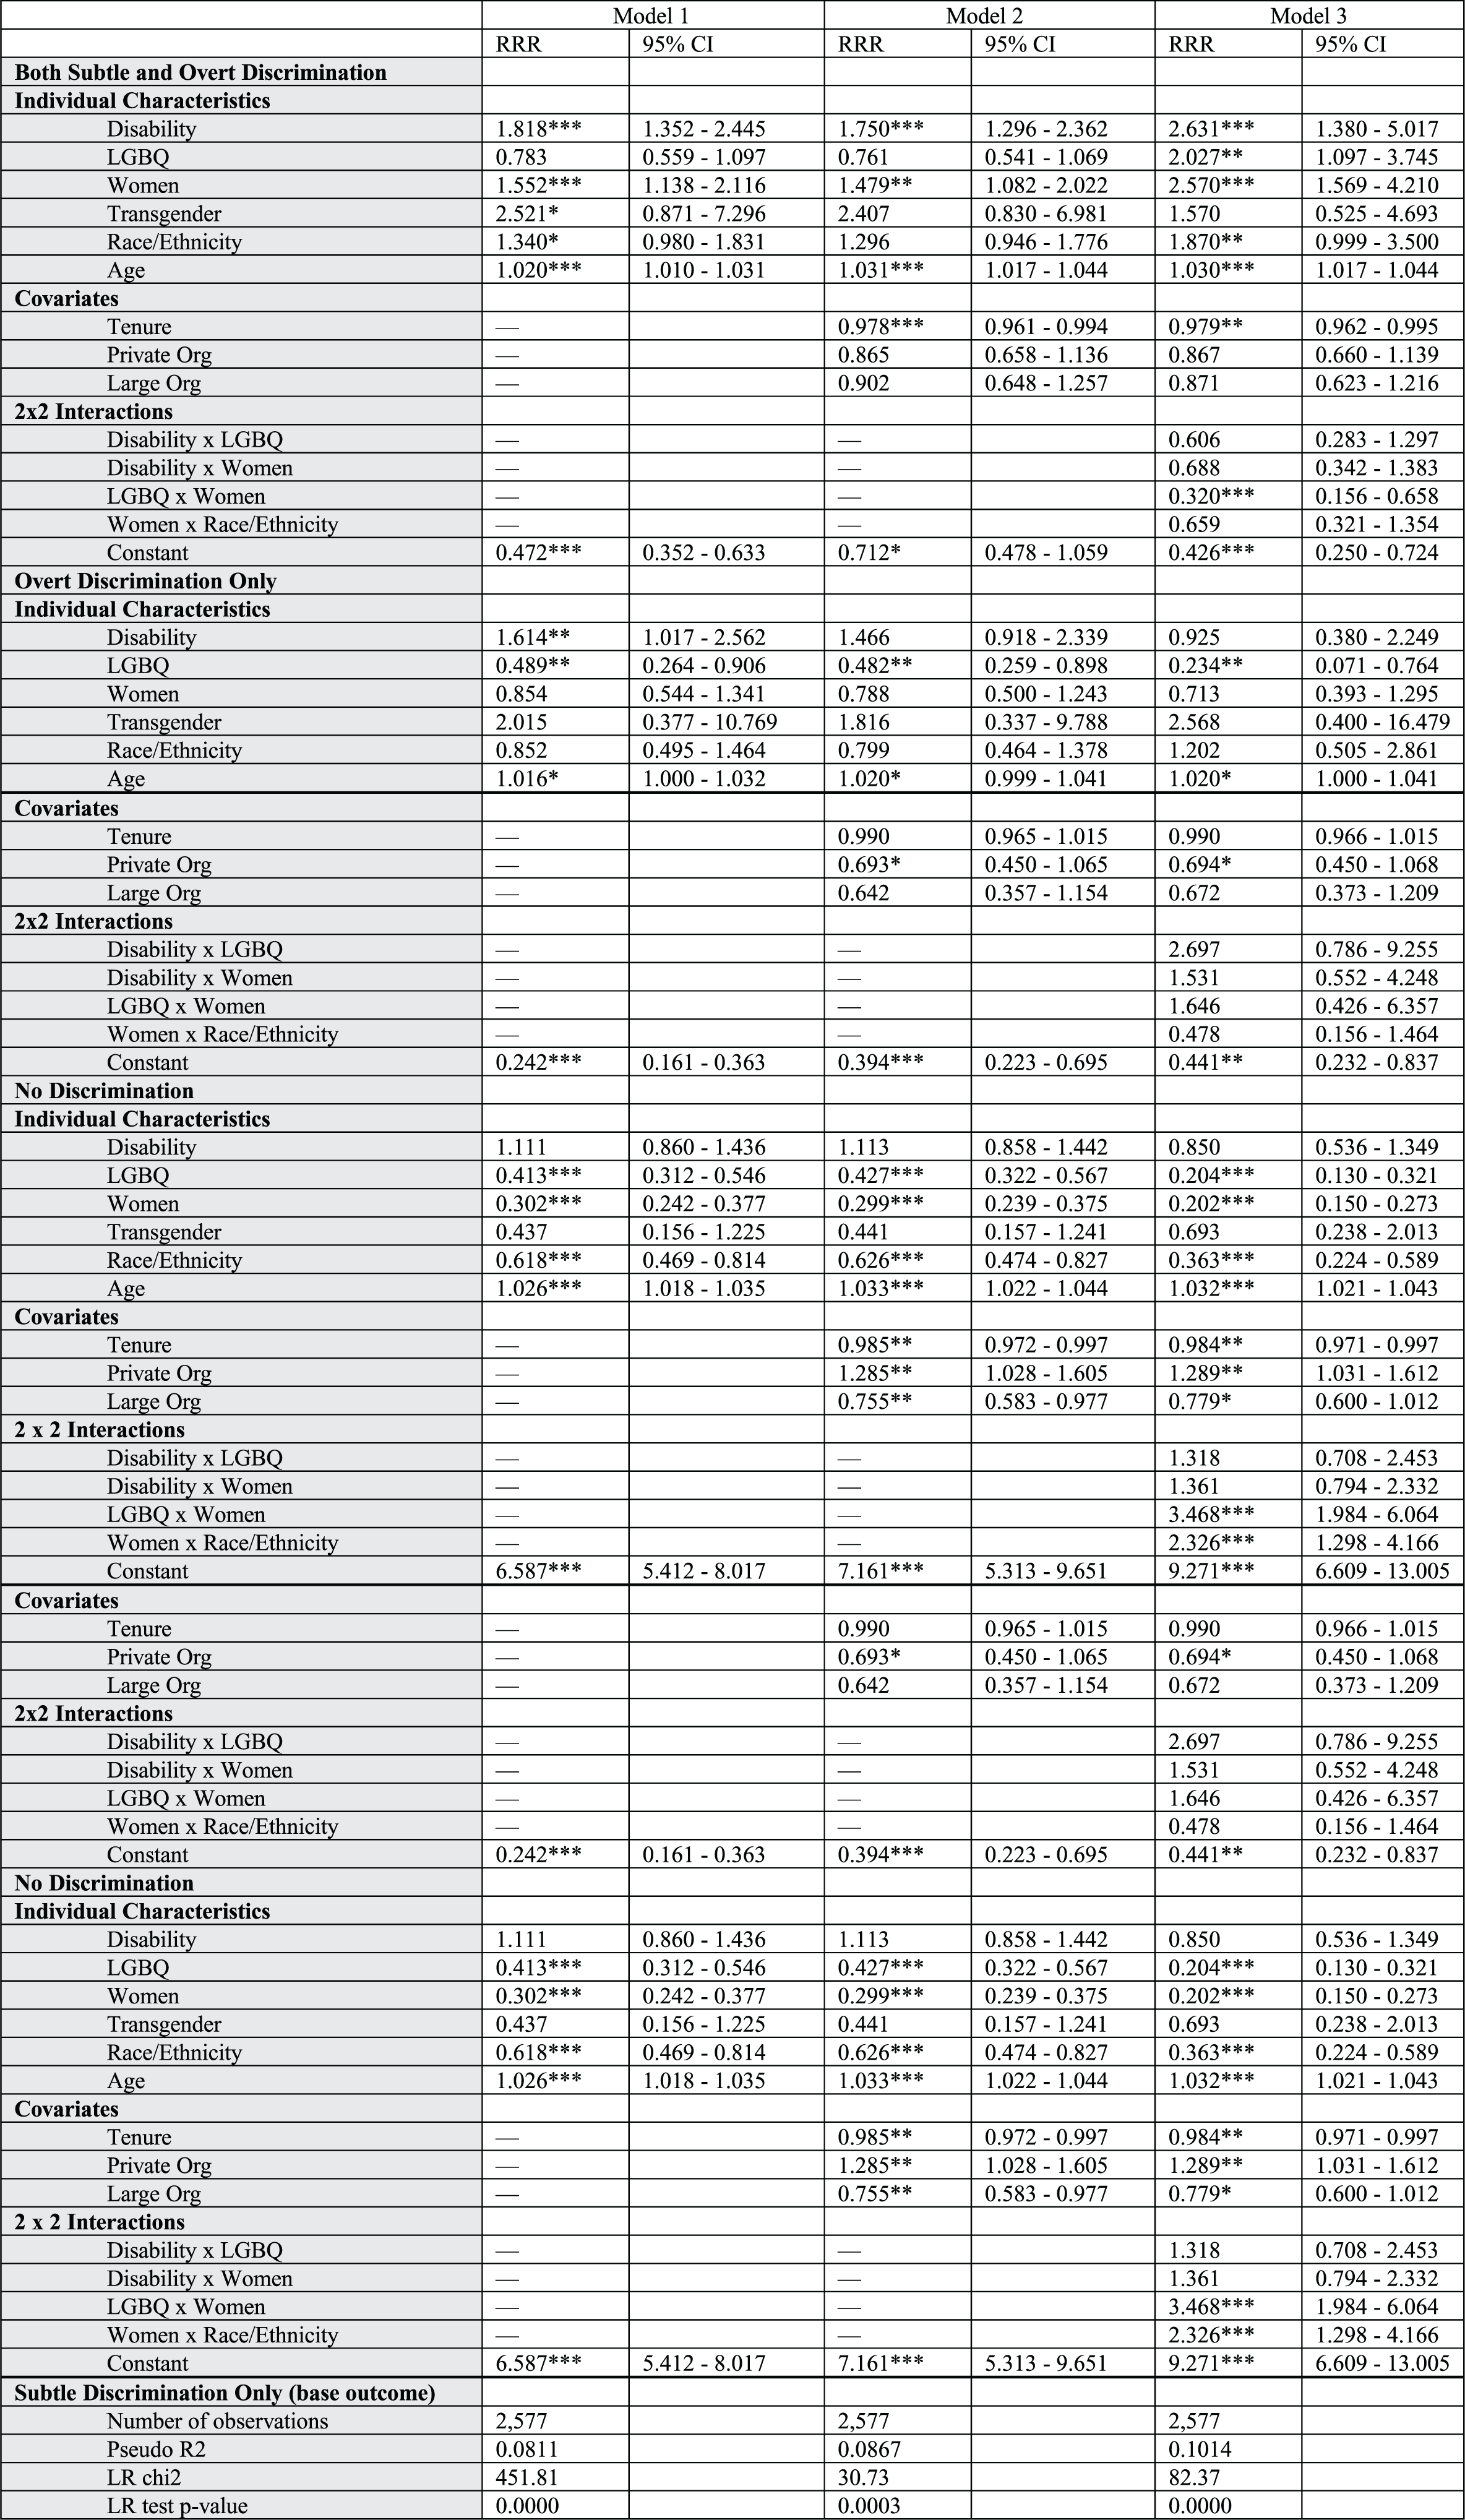
Notes: ***p-value < 0.01; **p-value < 0.05; *p-value < 0.1. Subtle discrimination is the base outcome. Age is mean centered at 49 years.
Predicted Probability of Reporting Both Types of Discrimination by Age
Notes: We use Average Adjusted Predictions at Representative values (APR) to calculate the expected probability of reporting discrimination. Specifically, we compute the average predicted probabilities at representative values of age (from 24 to 89), all else remaining as it is in the data.

Predicted Probability of Reporting Subtle Discrimination by Age
Notes: We use Average Adjusted Predictions at Representative values (APR) to calculate the expected probability of reporting discrimination. Specifically, we compute the average predicted probabilities at representative values of age (from 24 to 89), all else remaining as it is in the data.

Predicted Probability of Reporting Overt Discrimination by Age
Notes: We use Average Adjusted Predictions at Representative values (APR) to calculate the expected probability of reporting discrimination. Specifically, we compute the average predicted probabilities at representative values of age (from 24 to 89), all else remaining as it is in the data.

Predicted Probability of Reporting no Discrimination by Age
Notes: We use Average Adjusted Predictions at Repsresentative values (APR) to calculate the expected probability of reporting no discrimination. Specifically, we compute the average predicted probabilities at representative values of age (from 24 to 89), all else remaining as it is in the data.