Implications
This study describes the inherent limitations that characterize the utilization of the factorial and empirical methods, which are widely used under commercial conditions to estimate nutrient requirements in growing animals. The two methods provide different nutrient recommendations and have important limitations that should be considered when seeking to optimize the response of individual pig or pig populations. The relationship between the factorial estimation of nutrient requirements and animal responses is described. This new knowledge is essential for the establishment of optimal nutrient allowances for the swine industry. The study illustrates the need to have a better understanding of the dynamic nature of animal responses and the differences between individual pigs and population responses with respect to nutrient requirements.
Introduction
In industrial and semi-industrial swine production systems, feed cost may represent more than 60% of the overall production cost. The variation in feed cost among geographical regions relates to the feed ingredient availability and the feeding strategies adopted in regard to production objectives. Increasing nutrient efficiency by reducing nutrient excretion may help to reduce production costs and improve production efficiency while meeting government policies (Jean Dit Bailleul et al., Reference Jean Dit Bailleul, Bernier, van Milgen, Sauvant and Pomar2000).
Under commercial conditions, nutritional programs are established by seeking to achieve a reasonable balance between the nutrients provided by the diet and the estimated nutrient requirements of the animals. However, the nutritional value of feed ingredients depends not only on the nutrient composition of the ingredient, but also on the metabolic fate of these nutrients in animals (Noblet et al., Reference Noblet, Fortune, Shi and Dubois1994). Therefore, precise knowledge of the metabolic availability of dietary nutrients and a proper definition of nutrient requirements are key factors to be addressed to improve nutrient efficiency (Pomar et al., Reference Pomar, Dubeau and van Milgen2009).
When all other nutrients are provided in adequate amounts, the requirements for a specific nutrient can be defined as the minimal amount of this nutrient needed to prevent deficiency and allow the animal to perform its physiological functions (Lassiter and Edwards, Reference Lassiter and Edwards1982). For pig populations; however, nutrient requirements can be defined as the amount of nutrients needed for specified production purposes such as optimal growth rate, feed conversion ratio or maximal revenue. This definition applies to the context of feeds provided to heterogeneous populations over long periods of time (Ferguson et al., Reference Ferguson, Gous and Emmans1997; Knap, Reference Knap2000; Pomar et al., Reference Pomar, Kyriazakis, Emmans and Knap2003).
Empirical and the factorial methods are the most common approaches used nowadays to estimate optimal dietary nutrient levels in commercial animal production systems. In the empirical method, nutritional requirements are defined as the minimal amount of nutrients needed to maximize or minimize population responses for one or several performance criteria (e.g. weight gain) during a given time period. In the factorial method, daily requirements are obtained for an individual pig at a specific point in time by combining the estimated requirements for maintenance and production (growth, milk production, etc.). When the factorial method is used to estimate the requirements of a given population, the chosen individual should be the best representative for the population. Thus, the empirical method estimates optimal nutrient allowances from a population perspective, whereas the factorial method estimates the needs of a reference animal during a very short period of time, normally 1 day (Pomar et al., Reference Pomar, Kyriazakis, Emmans and Knap2003). Therefore, if we want to use the factorial method to estimate optimal nutrient allowances in populations of growing pigs, the relationship between the requirements estimated with these two methods needs to be established. The objectives of this study were (i) to estimate nutrient requirements of a given pig population based on the empirical and factorial methods, (ii) to establish the relationship between the nutrient requirements estimated with these two methods and (iii) to study the limitations of these methods with respect to determining the amount of a given nutrient that is needed to optimize individual and population responses of growing pigs.
Material and methods
Animal data
Data from a population of growing–finishing female pigs described by Pomar et al. (Reference Pomar, Pomar, Babot and Dubeau2007) were used to estimate the minimum true ileal digestible lysine (Lys) concentration required in feeds to optimize growth according to the empirical and factorial methods. These pigs were used in a project comparing growth performance, body composition, and nitrogen and phosphorus excretion between a three-phase and a daily multiphase feeding program. Pigs from 25 to 105 kg of body weight (BW) were offered feed ad libitum. Complete diets were obtained by combining two premixes for which composition was calculated to meet or exceed the animals’ requirements throughout the experiment (Letourneau Montminy et al., Reference Letourneau Montminy, Boucher, Pomar, Dubeau and Dussault2005). Feed consumption was measured throughout the experiment using an automated recording system (IVOG®-station, Insentec, Marknesse, Netherlands). The animals were weighed at least for every 2 weeks. At the beginning and end of the experiment, total body fat and body fat-free lean tissues were estimated by dual-energy X-ray absorptiometry (DXA) using a densitometer (DPX-L, Lunar Corporation, Madison, WI, USA). Total body protein and lipids were obtained by converting the muscle and fat values obtained with DXA into their chemical equivalents (Pomar and Rivest, Reference Pomar and Rivest1996). Data from 68 animals with regular feed intake and growth patterns were used in this study. The data set used in this study includes measures of daily net energy (NE) intake, 2-week interval BW, and total body lipids and protein at the beginning and end of the experiment. The total growth period lasted for 83 days.
Pig growth modeling
The growing pig module of InraPorc® (van Milgen et al., Reference van Milgen, Valancogne, Dubois, Dourmad, Sève and Noblet2008) was used in this study to estimate the Lys requirements by the empirical and factorial methods and to perform a systematic comparative analysis of the two methods. Because this model estimate animal responses by simulating the utilization of nutrients based on concepts used in NE and ideal protein systems, comparisons between the empirical and factorial methods cannot be attributed to the model itself. Furthermore, the model was modified slightly as described below to optimize utilization of the available data. Individual pigs are characterized by their voluntary feed intake and growth potential, which can be defined, respectively, by the pig’s appetite expressed as NE intake and its potential for protein deposition (PD). The model is based on the transformation of dietary nutrients into body protein (PT) and lipids (LT) (state variables), which are then used to estimate BW. Euler’s integration method is used to solve the differential equations with an integration step (dt) of 1 day. Rate variables are expressed on a daily basis, energy is in megajoules, mass in kilograms, and concentrations are expressed on a kilogram basis when not otherwise specified in the text. Because the animals’ appetite is expressed as NE intake, true ileal Lys requirements estimated by either method are expressed in relation to this element (Lys : NE).
Model modifications
The Gompertz function proposed in InraPorc to represent the potential for PD was not used in this study because sometimes individual growth does not follow the typical Gompertz growth pattern and convergence is difficult in these cases. Thus, a second-order polynomial function was chosen to represent the change in observed weight and daily NE intake of each animal over time. Although the parameters in this polynomial model have little biological meaning, they allow proper representation of the observed individual BW and feed intake data over the 83 days during which animals were fed in the original trial. All results presented in this study were obtained with the modified InraPorc model.
Individual animal characterization
BW is estimated in the model by a quadratic function of time (t) fitted to data from the four weightings of each pig. The first derivative of this function is used to estimate daily weight gain (∂BW/∂t), while PD is estimated according to Schinckel and de Lange (Reference Schinckel and de Lange1996) as follows,

where PD/∂t is the simulated daily PD and ADPG and ADG are the average daily PD and weight gain calculated from initial and final BW and protein masses measured on individual pigs. PD/∂t and ∂BW/∂t are therefore always equidistant. Energy intake was estimated based on the daily measures of NE intake in relation to BW using a quadratic function. BW was chosen to drive NE intake to maintain the same driving forces as in the InraPorc model.
Initial conditions and animal variation
Initial LT and PT masses for each simulated pig were estimated from DXA measurements, from which simulated initial BW was estimated using the empirical relationships proposed in InraPorc. However, initial BW was not normally distributed and showed low variability between animals (s.d. = 1.2 kg; coefficient of variation (CV) < 5%). Thus, a new population was generated randomly having normally distributed initial BW, the same average BW and a s.d. of 3.8 kg. The generated initial population variability was chosen to represent the observed variability of commercial conditions (Patience et al., Reference Patience, Engele, Beaulieu, Gonyou and Zijlstra2004; N. Lafond, Aliments Breton Inc., Québec, personal communication). The body composition of the newly generated population was established by giving each new pig the identification and body protein and lipid proportions of the pig having the same weight rank in the original population.
Evaluation of the modified pig growth model
The ability of the modified model to simulate individual pig average daily feed intake (ADFI) and BW was evaluated by comparing measured and predicted data within each feeding phase. For this evaluation, the initial conditions of the original population were used. For BW, only data measured and predicted at the end of each feeding phase were compared. The model was calibrated to predict the observed ADFI and BW of each pig. All the pigs were fed according to the three feeding phases used in the original experiment. All feeds contained 10 MJ NE/kg and were assumed to have all other nutrients in excess, including Lys. The quality of fit was evaluated by following the procedure of Theil (Reference Theil1966) in which the mean square prediction error (MSPE) is calculated as the sum of the square of the difference between simulated and observed measurements divided by the number of experimental observations. The MSPE was decomposed into error in central tendency, error due to regression (ER), and error due to disturbances and expressed in % of MSPE as suggested by Benchaar et al. (Reference Benchaar, Rivest, Pomar and Chiquette1998).
Predicting lysine requirements
The Lys : NE requirements were estimated by the modified growth model for each of the three 28-day feeding phases for which the initial BW averaged 24.5 ± 4.1, 54.4 ± 4.9 and 81.6 ± 5.4 kg, respectively.
The empirical method
The optimal dietary Lys : NE concentration for each feeding phase was estimated by simulating individual pig growth based on feeds containing 10 MJ NE/kg but 11 graded levels of Lys. The Lys : NE ratios ranged from 0.51 to 1.41, from 0.41 to 0.99 and from 0.36 to 0.86 g/MJ in phases one, two and three, respectively. In all simulations, all nutrients other than Lys were assumed to be not limiting. The Lys level of the basal diet was assumed to be limiting for growth while the 11th level was formulated to provide excess Lys during the 28 days of each feeding interval. In the simulated experiment, Lys-HCl was added to the basal diet to obtain the 10 additional Lys : NE dietary levels.
Animal performance was assessed in each feeding phase on the basis of the simulated individual average daily weight gain (ADG) and feed conversion ratio (FCR). The relationship between population ADG or FCR and the Lys : NE ratio was estimated by fitting a quadratic linear-plateau model using the NLIN procedure of the Statistical Analysis System (SAS) software (1999). Individual ADG and FCR responses for each diet were combined with the estimated feed cost and BW value to estimate individual feed cost and revenue. Feed cost was estimated as follows,

This relationship was obtained by fitting the cost of the most common commercial pig feeds sold in Québec from March to June 2008 to its Lys : NE content (N. Lafond, Aliments Breton Inc., Québec, personal communication). Pigs were assumed to be sold at $1.4/kg BW, which was the average value of the pigs sold in Québec from June to July 2008 (Fédération des Producteurs de Porcs du Québec, 2008). Feeding cost per kg of gain, gross margin and revenue in relation to Lys : NE levels were then obtained as follows,

The factorial method
The modified pig growth model was inverted in this study to estimate the daily Lys requirement according to the animal’s current state and its potential for PD, that is, the main factors determining, respectively, the requirements for maintenance and growth. Those requirements are calculated using the method suggested by van Milgen et al. (Reference van Milgen, Valancogne, Dubois, Dourmad, Sève and Noblet2008). The optimum Lys : NE ratio was obtained by dividing the daily Lys requirement by the estimated NE appetite. For any given Lys : NE diet on any experimental day, the proportion of animals above requirements can be estimated by that approach. With reference to current state, factorial nutrient requirements are frequently estimated by assuming that the average pig in the middle of the growing period is the best criterion for estimating the requirements of a population over the growing period (NRC, 1998). However, when the objective is to maximize animal performance, maximum Lys : NE requirements normally appear at the beginning of each feeding phase (Brossard et al., Reference Brossard, Dourmad, Rivest and van Milgen2009). In this study, the last method was used to estimate the requirements of a given pig during any feeding interval.
Results and discussion
Evaluation of the model under adequate nutritional conditions
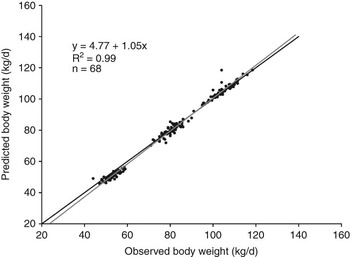
Across all feeding periods, the simulated and observed values were similar for both ADFI (2.44 v. 2.43 kg, P = 0.99; Figure 1) and average BW (79.40 v. 78.30 kg, P = 0.70; Figure 2). Model accuracy as estimated by the MSPE values was 0.01 kg/day for ADFI and 3 kg for BW. Deviations between observed and simulated performance values were small, which is consistent with the fact that model parameters were estimated for each pig in the population. However, the slope between the predicted and observed ADFI was 1.15, which is higher than 1 (P < 0.001), indicating that the model underestimated ADFI during the first feeding phase and overestimated this variable in older pigs. In fact, 43% of the observed error between the predicted and observed feed intake is given by the difference between the slopes (ER error). Observed feed intake seemed to approach a plateau at the end of the last feeding period, a trend that was probably not captured by the quadratic function used in this study. The slope between the predicted and observed BW (b = 1.05) was also higher than 1 (P < 0.001). However, in contrast with the predicted ADFI, the model underestimated BW slightly during the first feeding phase.
Predicted v. observed average daily feed intake for a balanced growth diet over a period of 83 days using a modified version of the InraPorc model. Mean predicted average feed intake (kg/day) = 2.44; root mean square prediction error (kg/day) = 0.01; error in central tendency (%) = 0.29; error due to regression (%) = 43.4; error due to disturbances (%) = 56.31. Regression line ( ); line of equality (
 ). Equality line has intercept = 0 and slope = 1.

Predicted v. observed body weight for a balanced growth diet over a period of 83 days using a modified version of the InraPorc model. Mean predicted body weight (kg) = 79.4; root mean square prediction error (kg) = 3.0; error in central tendency (%) = 19.3; error due to regression (%) = 1.51; error due to disturbances (%) = 79.18. Regression line ( ); line of equality (
 ). Equality line has intercept = 0 and slope = 1.

The effect of the simulated Lys : NE ratios on feed intake
As expected, feeding pigs diets with different levels of Lys had little effect on feed intake, which varied from 1.95 to 2.00 kg/day, from 2.47 to 2.51 kg/day, and from 2.80 to 2.82 kg/day for phases one to three, respectively (data not presented). Model assumptions include the following: simulated animals had free and continuous access to a single homogenous feed at all times; the feed contained no toxins and the rate of intake was not limited by the digestive capacity of the pig; and the environment was thermally neutral at all times. Under these conditions, it is assumed that pigs were able to eat an amount of feed that was sufficient to satisfy their NE requirements. As is also assumed in other pig growth models (Whittemore et al., Reference Whittemore, Green and Knap2001; van Milgen et al., Reference van Milgen, Valancogne, Dubois, Dourmad, Sève and Noblet2008), the modified InraPorc model used in this study assumed that pigs do not modify feed intake during or after lysine-deficient periods. The assumption that pigs do not increase feed intake to meet their requirements when fed lysine-deficient diets is supported by some authors (Owen et al., Reference Owen, Knabe, Burgoon and Gregg1994; Nam and Aherne, Reference Nam and Aherne1994) but not by others (Smith et al., Reference Smith, Tokach, O’Quinn, Nelssen and Goodband1999; Cline et al., Reference Cline, Cromwell, Crenshaw, Ewan, Hamilton, Lewis, Mahan and Southern2000). Feeding pigs at levels below Lys requirements limits protein growth and pigs become fatter and lighter. The small differences in feed intake observed in this study across the different Lys levels resulted from differences in ADG.
Estimating lysine requirements in populations of growing pigs
The empirical method
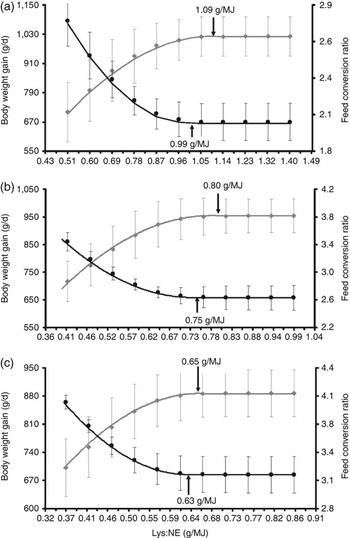
Lysine requirement was estimated according to the empirical method by simulating the response of pig populations when fed different levels of dietary Lys. Because all pigs in the population were subjected to treatments, the effect of the heterogeneity of the population is embedded in the solution (Figure 3). Population responses for ADG varied from 710 to 1021 g in phase one, from 717 to 954 g in phase two and from 701 to 866 g in phase three. Average FCR values ranged from 2.78 to 2.02 in phase one, from 3.44 to 2.63 in phase two and from 4.01 to 3.18 in phase three. The ADG increased and the FCR decreased with increasing dietary Lys : NE ratio according to a quadratic linear-plateau model in the three feeding phases. In linear-plateau models, the slope of the response between Lys deposition and Lys intake represents the marginal efficiency of dietary Lys retention, whereas the intercept between the linear and plateau sections can be interpreted as the Lys requirements. In quadratic-plateau models, the first derivative of the ascending part of the response function, which is curvilinear, represents the instant marginal Lys efficiency and the intercept with the plateau section represents the Lys requirement. In this study, population ADG increased according to this model from 0.51 to 1.09 g/MJ of Lys : NE ratio in phase one, from 0.41 to 0.80 g/MJ in phase two and from 0.36 to 0.65 g/MJ in phase three. Population FCR decreased from 0.51 to 0.99 g Lys/MJ NE in phase one, 0.41 to 0.75 g/MJ in phase two and 0.36 to 0.63 g/MJ in phase three. These simulated results show that the marginal efficiency of dietary Lys decreases as the level of this nutrient approaches the levels at which the population shows maximum ADG or minimum FCR values. In these simulations, the maximum response estimated by the quadratic linear-plateau model for ADG was reached at the Lys : NE ratio of 1.09 g/MJ in phase one, 0.80 g/MJ in phase two and 0.65 g/MJ in phase three. Minimum estimated response for FCR was reached in the Lys : NE ratio of 0.99 g/MJ in phase one, 0.75 g/MJ in phase two and 0.63 g/MJ in phase three.
Effect of different Lys : NE ratios on average daily gain (ADG) and feed conversion ratio (FCR) and maximum response estimated for the following mean body weight ranges: 26 to 53 kg (a), 54 to 81 kg (b) and 82 to 106 kg (c). The data presented are the mean ( ; ADG, ●; FCR), standard error of the mean, and curve estimated by the quadratic equation (
 ; ADG,
 ; FCR).

In weight ranges similar to those simulated during the first feeding phase, studies using a quadratic function estimated optimal Lys : NE ratios for maximum ADG responses to be 1.07 g/MJ (Warnants et al., Reference Warnants, Van Oeckel and De Paepe2003) and 1.18 g/MJ (O’Connell et al., Reference O’Connell, Lynch and O’Doherty2005) which are close to the values obtained in this study. In the 52 to 78 kg and in the 78 to 109 kg weight ranges, Owen et al. (Reference Owen, Knabe, Burgoon and Gregg1994) obtained optimal Lys : NE ratios of 0.82 g/MJ and 0.75 g/MJ, respectively, for FCR, which are also close to those obtained by simulation in this study.
A decrease in the marginal efficiency of nutrients given to a population at decreasing limiting levels is frequently observed in animal studies (Bikker et al., Reference Bikker, Verstegen, Campbell and Kemp1994; O’Connell et al., Reference O’Connell, Lynch and O’Doherty2005) or in simulation studies (Pomar et al., Reference Pomar, Kyriazakis, Emmans and Knap2003; Brossard et al., Reference Brossard, Dourmad, Rivest and van Milgen2009). Variability among the animals of a given population may contribute significantly to the decrease in nutrient efficiency over varying nutrient levels (Curnow, Reference Curnow1973), independently of animal variation arising from genetic (Pomar et al., Reference Pomar, Kyriazakis, Emmans and Knap2003), environmental or animal-management sources (Wellock et al., Reference Wellock, Emmans and Kyriazakis2004). In this study, the simulated phenotypic variation is the result of between-animal genetic differences (feed intake and growth potentials), their interaction with dietary treatments, and differences in BW and body composition between animals at the beginning of the simulations. Furthermore, Pomar et al. (Reference Pomar, Kyriazakis, Emmans and Knap2003) demonstrated that increasing the time over which animal responses are measured increases the curvilinearity of the responses, which also contributes to the curvilinear Lys marginal efficiency observed in this study.
In the empirical method, the nutrient level at which the optimal population response is observed within a given growing period is generally identified as the population’s requirement for this nutrient for this growing interval. However, the maximum population response is dynamic in nature (Pomar et al., Reference Pomar, Kyriazakis, Emmans and Knap2003) and care must be exercised when attempting to extrapolate optimal nutrient levels to different animals or growing intervals. Furthermore, the response criteria used to estimate the requirements may also suggest different nutrient requirements (Baker, Reference Baker1986). These criteria may be biological, technical, economic and/or environmental in nature (Jean Dit Bailleul et al., Reference Jean Dit Bailleul, Bernier, van Milgen, Sauvant and Pomar2000). In this study, for example, the optimal Lys : NE ratio for ADG was 9%, 6% and 3% higher than the optimal Lys : NE ratio observed for FCR in phases one to three, respectively. Feed intake and ADG evolve differently in response to Lys : NE, which explains why FCR and ADG do not necessarily reach the same optimal values. When gain and voluntary feed intake reach their highest point, gain remains constant but feed intake decreases with additional Lys (Baker et al., Reference Baker, Batal, Parr, Augspurger and Parsons2002). This shows that the Lys requirement for FCR can be higher than for ADG. Previous studies also suggest that the Lys requirement may be higher for maximal feed efficiency than for maximal weight gain (O’Connell et al., Reference O’Connell, Lynch and O’Doherty2005; Main et al., Reference Main, Dritz, Tokach, Goodband and Nelseen2008). In this study, however, the effect was different because the InraPorc model does not represent the effect of Lys deficiency on feed intake.
Nutrient requirements in the empirical method result from the response of each individual within the population, which is affected by its genetic potential, nutritional background, growing conditions, the interval during which pigs are evaluated, and the criterion used to estimate optimal population responses. A question that has given rise to debate concerning this method is how to estimate optimal nutrient requirement on the basis of biological responses that are sensitive to all these factors. Because one of the purposes of this study was to compare the empirical and factorial methods of estimating nutrient requirements, the point on the curve representing the maximum or minimum population response is probably the best compromise (Baker, Reference Baker1986).
The linear-plateau is frequently the preferred model for representing the responses of animals to graded levels of limiting nutrients (Baker, Reference Baker1986) and for the objective estimation of nutrient requirements. Although this model generally provides a good statistical fit, it tends to underestimate optimal nutrient levels since it does not take into account the physiological differences between the individuals in a population (Remmenga et al., Reference Remmenga, Milliken, Kratzer, Schwenke and Rolka1997). In this respect, the model may not be suitable because it does not consider the curvilinear nature of the response of a population to graded levels of a limiting nutrient. A quadratic linear-plateau model has been recommended for describing curvilinear population responses and estimating nutrient requirements (Baker et al., Reference Baker, Batal, Parr, Augspurger and Parsons2002). In this type of model, the optimum nutrient level is attributed to the intersection between the quadratic function and the plateau. From that point onward, increases in the ingestion of the limiting nutrient are assumed not to have any effect on population response. The quadratic linear-plateau model was chosen in this study because it showed a better fit to simulated population responses.
Maximal ADG or minimal FCR may not necessarily result in maximum economic return. This is due to the fact that population responses to increasing levels of limiting nutrients (i.e. Lys) progressively decline as the limiting nutrient approaches the plateau level. Because Lys- or protein-rich diets are more expensive than low-Lys or low-protein diets, marginal economic returns can be expected to decrease faster than Lys marginal efficiency. This is in agreement with some commercial practices in which optimal nutrient recommendations are based on 90% to 95% of the maximal ADG or at 110% to 105% of the minimal FCR.
Determination of nutrient requirements or optimal nutrient levels is therefore difficult due to the curvilinear nature of the population responses. In the empirical approach, minimizing feeding costs or maximizing revenues has been proposed as an alternative (Pack et al., Reference Pack, Hoehler and Lemme2003). In this study, biological data have been linked to economic parameters to estimate the optimum Lys : NE ratios. The Lys requirement for maximal revenue was greater than the level at which feed cost per kilogram of weight gain would be minimized for phase one (9.4%; Figure 4). For this feeding phase, the difference is due to the fact that the marginal increase in ADG is small near the maximal ADG, while feed cost is still proportional to dietary Lys concentration. Furthermore, simulations were performed at Lys : NE increments of 0.09, 0.06 and 0.05 and, in some cases, the optimal response falls between two increment levels. In comparison with optimal response values for ADG, the estimated optimum economic level for revenue was 12% lower in phase one, 5% lower in phase two and 6% lower in phase three. Within the simulated context, the estimated nutritional requirements based on optimal population responses differed from those obtained for economic responses. Other studies have likewise shown that optimal economic returns are not always obtained at optimal biological responses (de Lange and Schreurs, Reference de Lange and Schreurs1995; Jean Dit Bailleul et al., Reference Jean Dit Bailleul, Bernier, van Milgen, Sauvant and Pomar2000). Other performance criteria, such as cost per kg of carcass lean meat and minimal nitrogen or phosphorus excretion, also yield different optimal values (Jean Dit Bailleul et al., Reference Jean Dit Bailleul, Bernier, van Milgen, Sauvant and Pomar2000; Pack et al., Reference Pack, Hoehler and Lemme2003). Nonetheless, the empirical approach can be used to determine the optimal amounts of nutrients that need to be provided to the population to optimize production from an animal, economic or environmental perspective. Any attempt to extrapolate these findings to other production situations calls for caution (Baker, Reference Baker1986; Pomar et al., Reference Pomar, Kyriazakis, Emmans and Knap2003).
Effect of different Lys : NE ratios on feed cost per kg gain ( ) and on revenue (—●—) for pigs with the following mean body weight ranges: 26 to 53 kg (a), 54 to 81 kg (b) and 82 to 106 kg (c). The data presented are the mean and standard error of the mean.

The factorial method
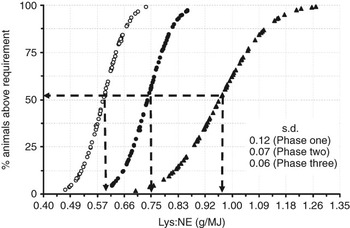
In the factorial method, daily requirements are estimated as the sum of the requirements for maintenance and production. For a given growing period, maximal requirements are assumed to be the requirements that will ensure that the provided Lys will not limit growth. Also, maximal requirements for a given period normally appear at the beginning of the period. The estimated required Lys : NE ratio of the studied pig population ranged from 0.70 to 1.27 g/MJ in feeding phase one, from 0.62 to 0.86 g/MJ in feeding phase two and from 0.47 to 0.72 g/MJ in feeding phase three (Figure 5). Based on the empirical cumulative distribution function, the Lys : NE value corresponding to the average pig of the population requirements was 0.96 g/MJ in phase one, 0.73 g/MJ in phase two and of 0.59 g/MJ in phase three. The estimated individual values were normally distributed, with a s.d. of 0.12, 0.07 and 0.06, and a CV of 13.5%, 9.6% and 9.6%, in feeding phases one to three, respectively. Additionally, the range of Lys : NE requirements of young pigs are much higher than the ranges obtained with older pigs.
Cumulative distribution of estimated requirement for lysine/net energy ratio for pigs during feeding phases one (▴), two (●) and three (○) as described in this study.

Bertolo et al. (Reference Bertolo, Moehn, Pencharz and Ball2005) estimated individual Lys requirements using the amino acid oxidation indicator technique in nine pigs having a weight range similar to that in this study’s first phase and obtained a CV of 9.8%, which is slightly lower that the value obtained in this study. With this method, in which only 2 days of adaptation to each level of Lys are required, sufficient data can be obtained from each pig in a short period of time to estimate individual requirements. Thus, as in the factorial method, the observed variability in requirements among animals can only be attributed to genetic and BW differences. When the factorial method is used to estimate nutrient requirements, it is common to use the average pig to represent the population. Furthermore, unlike the empirical method, the factorial method estimates nutritional requirements based on one individual at one specific point in time. Thus, changes that occur during the growing interval under study are not evaluated. Variation between animals in the estimated requirements for maintenance and growth and in metabolic efficiencies is also not considered.
Comparing the empirical and factorial methods
For the sake of simplicity, only the results from the first feeding phase are used in this section. Similar conclusions can be reached for the results from the other two feeding phases. In this section, we look at the differences between the empirical method and the factorial method when used to estimate optimal nutrient requirements of a population of pigs within a given growth interval.
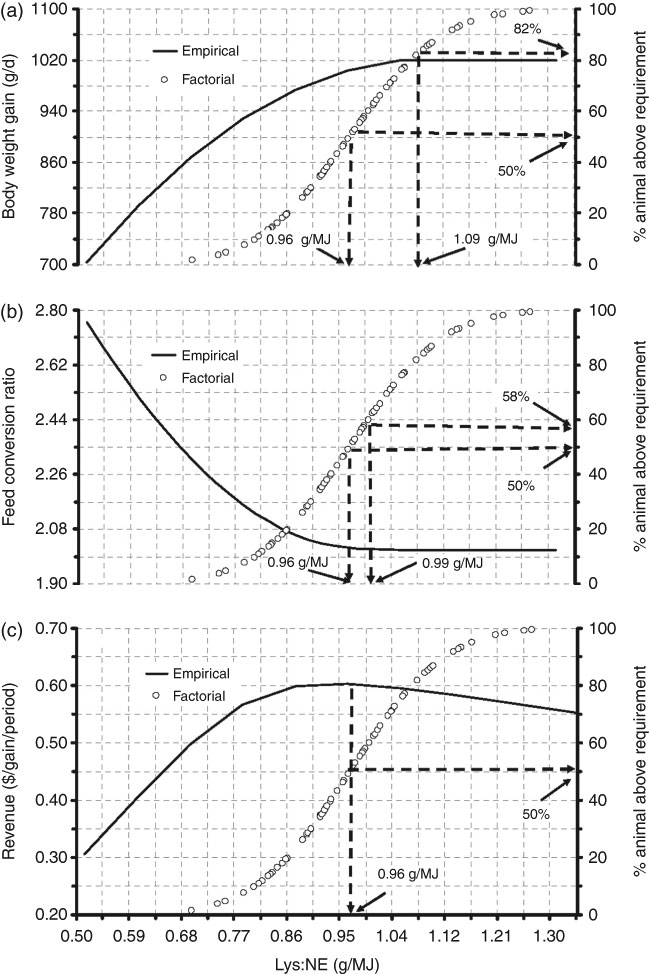
In the first feeding phase, maximum ADG was reached with a Lys : NE ratio 12% higher than the requirement of the average pig estimated by the factorial method (Figure 6). This estimation corresponds to an animal whose requirements are in the 82nd percentile of the population. For the FCR, however, the empirical estimates correspond to those for a pig in the 58th percentile of the population, whereas empirical estimates for optimizing revenues are close to the average pig (50th percentile). These results cannot, however, be generalized to other economic or production contexts, since feed costs are volatile and the relationship between animal responses and costs are linked to market prices.
Cumulative distribution of requirements estimated by the factorial method (○) and effect of different lysine/net energy ratios on weight gain (a), feed conversion (b) and revenue (c) estimated by the empirical method ( ) for the body weight ranges from 26 to 51 kg.
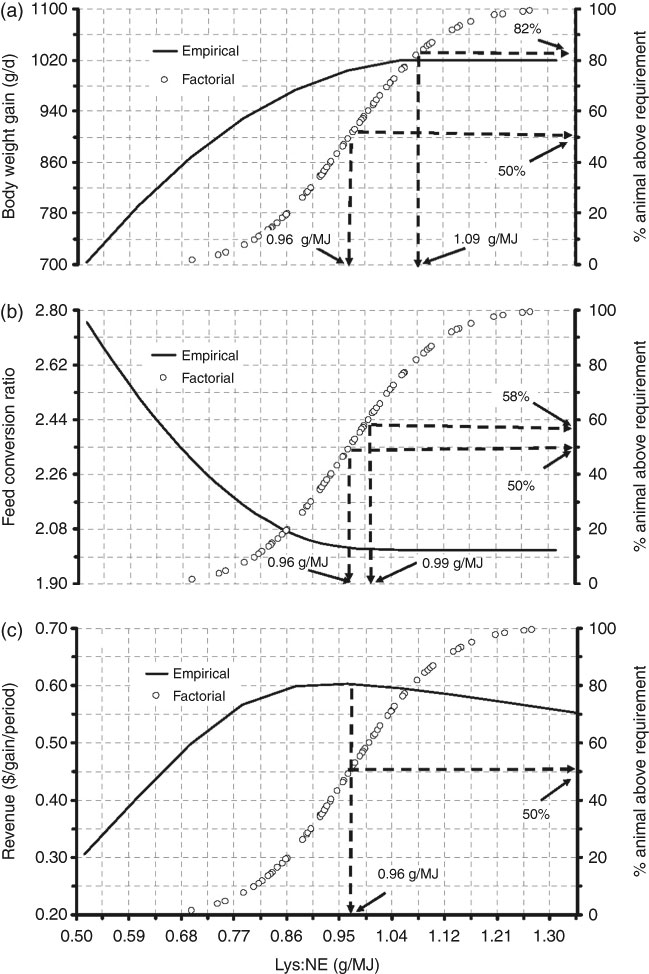
Results of empirical experiments have been used to evaluate the accuracy of the factorial method in estimating population requirements (Bikker et al., Reference Bikker, Verstegen, Campbell and Kemp1994; Main et al., Reference Main, Dritz, Tokach, Goodband and Nelseen2008). In these experiments, the estimated requirements for the average pig were also lower than the nutrient level at which the maximum biological population response was obtained. According to the results of this study, feeding pigs based on factorial methods in which the average pig population is used as a reference tends to limit the growth of an important proportion of the pigs and, therefore, average population responses will be below the maximal population potential. In fact, if the factorial requirements estimated for the average pig are applied to populations exhibiting between-animal variation, only 50% of the population will consume enough nutrients to express full growth potential (Pomar et al., Reference Pomar, Kyriazakis, Emmans and Knap2003; Brossard et al., Reference Brossard, Dourmad, Rivest and van Milgen2009). Furthermore, the difference between the factorial method and the empirical method can be expected to increase with the level of heterogeneity of the population (Pomar et al., Reference Pomar, Kyriazakis, Emmans and Knap2003).
Another point worth noting is that the estimated population responses in this study were obtained in three 28-day growth intervals. The empirical method would provide different requirement estimates if the starting point or the length of the interval were modified. By contrast, in the factorial method only the starting point is considered in estimating nutrient requirements; the time interval over which the diets are supplied is not considered. In this method, feed intake and animal growth are considered static. However, during the growing period feed intake (or energy intake) increases proportionally more rapidly than the requirement for Lys and thus, the optimal nutrient concentration ratio diminish progressively during growth. Besides the fact that requirements are dependent on the criteria used to evaluate population responses, this trend makes the process of identifying the individual and the point during the growth interval that should be used to estimate requirements of a growing population even more complex and subjective. In the comparison between the empirical method and the factorial method made by Pomar et al. (Reference Pomar, Kyriazakis, Emmans and Knap2003) for generic populations, it was not possible to establish a relationship between the two methods. In this study, a systematic comparison was made of the differences between and the limitations of these two methods when used to optimize near-commercial population responses according to different production criteria.
Determining the limitations of the empirical and factorial methods
One of the problems in evaluating the empirical and factorial requirements for optimizing population responses lies in integrating all the factors related to animal response. Variation among animals over time is rarely taken into account. The importance of considering variability among animals in evaluations of biological responses and in nutritional programs has been demonstrated in recent years (Baker, Reference Baker1986; Pomar et al., Reference Pomar, Kyriazakis, Emmans and Knap2003; Main et al., Reference Main, Dritz, Tokach, Goodband and Nelseen2008). Between-animal variation shapes population responses and, therefore, the overall efficiency of nutrient utilization (Pomar et al., Reference Pomar, Kyriazakis, Emmans and Knap2003) and optimal nutrient levels (Leclercq and Beaumont, Reference Leclercq and Beaumont2000; Pomar et al., Reference Pomar, Kyriazakis, Emmans and Knap2003; Brossard et al., Reference Brossard, Dourmad, Rivest and van Milgen2009). Current methods, when aimed at optimizing population responses, estimate requirements on the basis of the potential of a single individual at a given point in time (factorial) or the response of a population to the intake of a given nutrient level in a fixed interval (empirical). The response of a population to the intake of a given nutrient in a specific environment as part of a given diet, however, is dependent on the daily response of each animal. An estimate of requirements based on a single animal at one point in time does not necessarily correspond to the level of nutrients that will optimize population responses. Similarly, the mean population response estimated by the empirical method cannot be used to represent the daily response of each animal, as both types of responses differ in form and magnitude over time (Pomar et al., Reference Pomar, Kyriazakis, Emmans and Knap2003; Wellock et al., Reference Wellock, Emmans and Kyriazakis2004). In addition, these differences increase with the degree of heterogeneity of the population, which is determined by genetic, environmental or management factors which may be specific to each production situation (Pomar et al., Reference Pomar, Kyriazakis, Emmans and Knap2003). Since the response of a population to the intake of a given nutrient is influenced by its heterogeneity, requirements may be different for each population condition. Therefore, this study illustrates the need to gain a better understanding of the dynamic nature of animal responses before making strategic nutritional decisions. In this context, the approaches used to estimate requirements with a view to optimizing population responses must be re-evaluated. New methods are required that take into account the daily biological response of the animals in a given environment for a given diet so that the ideal level of a nutrient can be estimated.
Conclusions and perspectives
The optimum Lys : NE ratios estimated for growing–finishing pigs (25 to 105 kg) differ between the empirical method and the factorial method. For daily weight gain and feed conversion ratio, the factorial method based on the average animal did not optimize the population response simulated by the empirical method. In the simulated environmental context, however, maximal population revenue was obtained at levels of dietary Lys close to those required by the average pig. Because of the between-animal variation and the dynamic nature of the responses, it is difficult to determine which animal in a population should be used to estimate the population requirements. Thus, the results of this study confirm that caution should be exercised in using the factorial method to estimate the level of nutrients that will optimize the response of heterogeneous populations fed a given diet over long periods of time. On the other hand, although population heterogeneity and length of the feeding period are taken into account in the empirical method, the estimated requirements obtained with this method should be used with caution to estimate the requirements for other feeding intervals or populations. In addition, the empirical method does not track changes in the requirements over time and does not show the point in time when maximum response is achieved. Thus, both methods present serious limitations with respect to estimating the optimum level of nutrients for optimizing individual and population responses.
Acknowledgements
The authors acknowledge the financial support of the Ministry of Education in Brazil (CAPES) and of Agriculture and Agri-Food Canada.