


Introduction
Carbon is abundant in biotic and abiotic system at the Earth’s surface. Notably, it is a major component of wood, which is a natural archive of data from the past. Analysis of changes in the ratio of stable carbon isotopes in annual tree rings, combined with dendrochronological analysis, provides information about the conditions under which trees grew.
From year to year, a tree produces successive layers of wood, called rings or annual increments. The average width of annual increments in a given tree is a function of many variables, including species, age, soil nutrient availability, and climatic factors that include temperature, precipitation, sunshine, humidity and wind speed (Vaganov et al. Reference Vaganov, Anchukaitis, Evans, Hughes, Swetnam and Diaz2011). In years with unfavorable growing conditions for a species, narrow growth rings are produced, while in years with favorable growing conditions the tree produces wide rings. Based on the width of a tree’s annual increments, it is possible to determine the climatic conditions under which the tree grew (Zielski and Krąpiec Reference Zielski and Krąpiec2004). Usually, trees of one species, respond similarly to changes in local to regional environmental factors. In contrast, different species have different sensitivity to these factors. However, the amount of data obtained from ring-width variability may not provide a full environmental picture. A much broader spectrum of information can be provided by including analysis of changes in stable isotope ratios in individual annual increments (Gagen et al. Reference Gagen, McCarroll, Loader, Robertson, Hughes, Swetnam and Diaz2011; Kłusek et al. Reference Kłusek, Grabner, Pawełczyk and Pawlyta2019).
The classical dendrochronological variables (tree-ring width and maximum latewood density) are determined by factors limiting tree growth. In contrast, stable isotope ratios can record additional environmental information (McCarroll and Loader Reference McCarroll and Loader2004). The correlation between isotope ratios and climatic parameters is often strong, because the relationship is heavily influenced by the tree’s direct response to a specific change in weather conditions. The relationship between climate change and changes in the ratio of stable carbon isotopes in the plant, is determined by the mechanisms of isotopic fractionation during the assimilation of carbon dioxide in the process of photosynthesis (Farquhar et al. Reference Farquhar, O’Leary and Berry1982; Francey and Farquhar Reference Francey and Farquhar1982). Under dry, moisture-limited conditions, carbon isotopic fractionation is controlled by the conductance of carbon dioxide into the leaf stomata as the principal gate or inlet for CO2/O2 exchange and H2O evaporation. In contrast, under unlimited moisture conditions, carbon isotopic fractionation is controlled by the rate of photosynthesis, which is regulated by temperature and insolation (McCarroll and Loader Reference McCarroll and Loader2004; Farquhar et al. Reference Farquhar, Hubick, Condon, Richards, Rundel, Ehleringer and Nagy1989; Pazdur et al. Reference Pazdur, Nakamura, Pawełczyk, Pawlyta, Piotrowska, Rakowski, Sensuła and Szczepanek2007).
In temperate regions, where adequate moisture is often available throughout the growing season, stable carbon isotopes in annual tree rings have been successfully used to reconstruct past climatic changes, such as summer insolation (Dorado-Liñan et al. Reference Dorado-Liñán, Sanchez-Lorenzo, Gutiérrez Merino, Planells, Heinrich, Helle and Zorita2016; Hafner et al. Reference Hafner, McCarroll, Robertson, Loader, Gagen, Young and Levanič2014; Kłusek et al. Reference Kłusek, Grabner, Pawełczyk and Pawlyta2019; Pazdur et al. Reference Pazdur, Nakamura, Pawełczyk, Pawlyta, Piotrowska, Rakowski, Sensuła and Szczepanek2007) and summer temperatures (Haupt et al. Reference Haupt, Weigl, Grabner and Boettger2011; Kłusek et al. Reference Kłusek, Grabner, Pawełczyk and Pawlyta2019; Pawełczyk et al. Reference Pawełczyk, Pazdur and Halas2004; Pazdur et al. Reference Pazdur, Nakamura, Pawełczyk, Pawlyta, Piotrowska, Rakowski, Sensuła and Szczepanek2007). In areas where summer moisture deficiency limits the conductance of carbon dioxide in stomata, carbon isotope variation can be used to reconstruct summer precipitation and drought (Kress et al. Reference Kress, Saurer, Siegwolf, Frank, Esper and Bugmann2010).
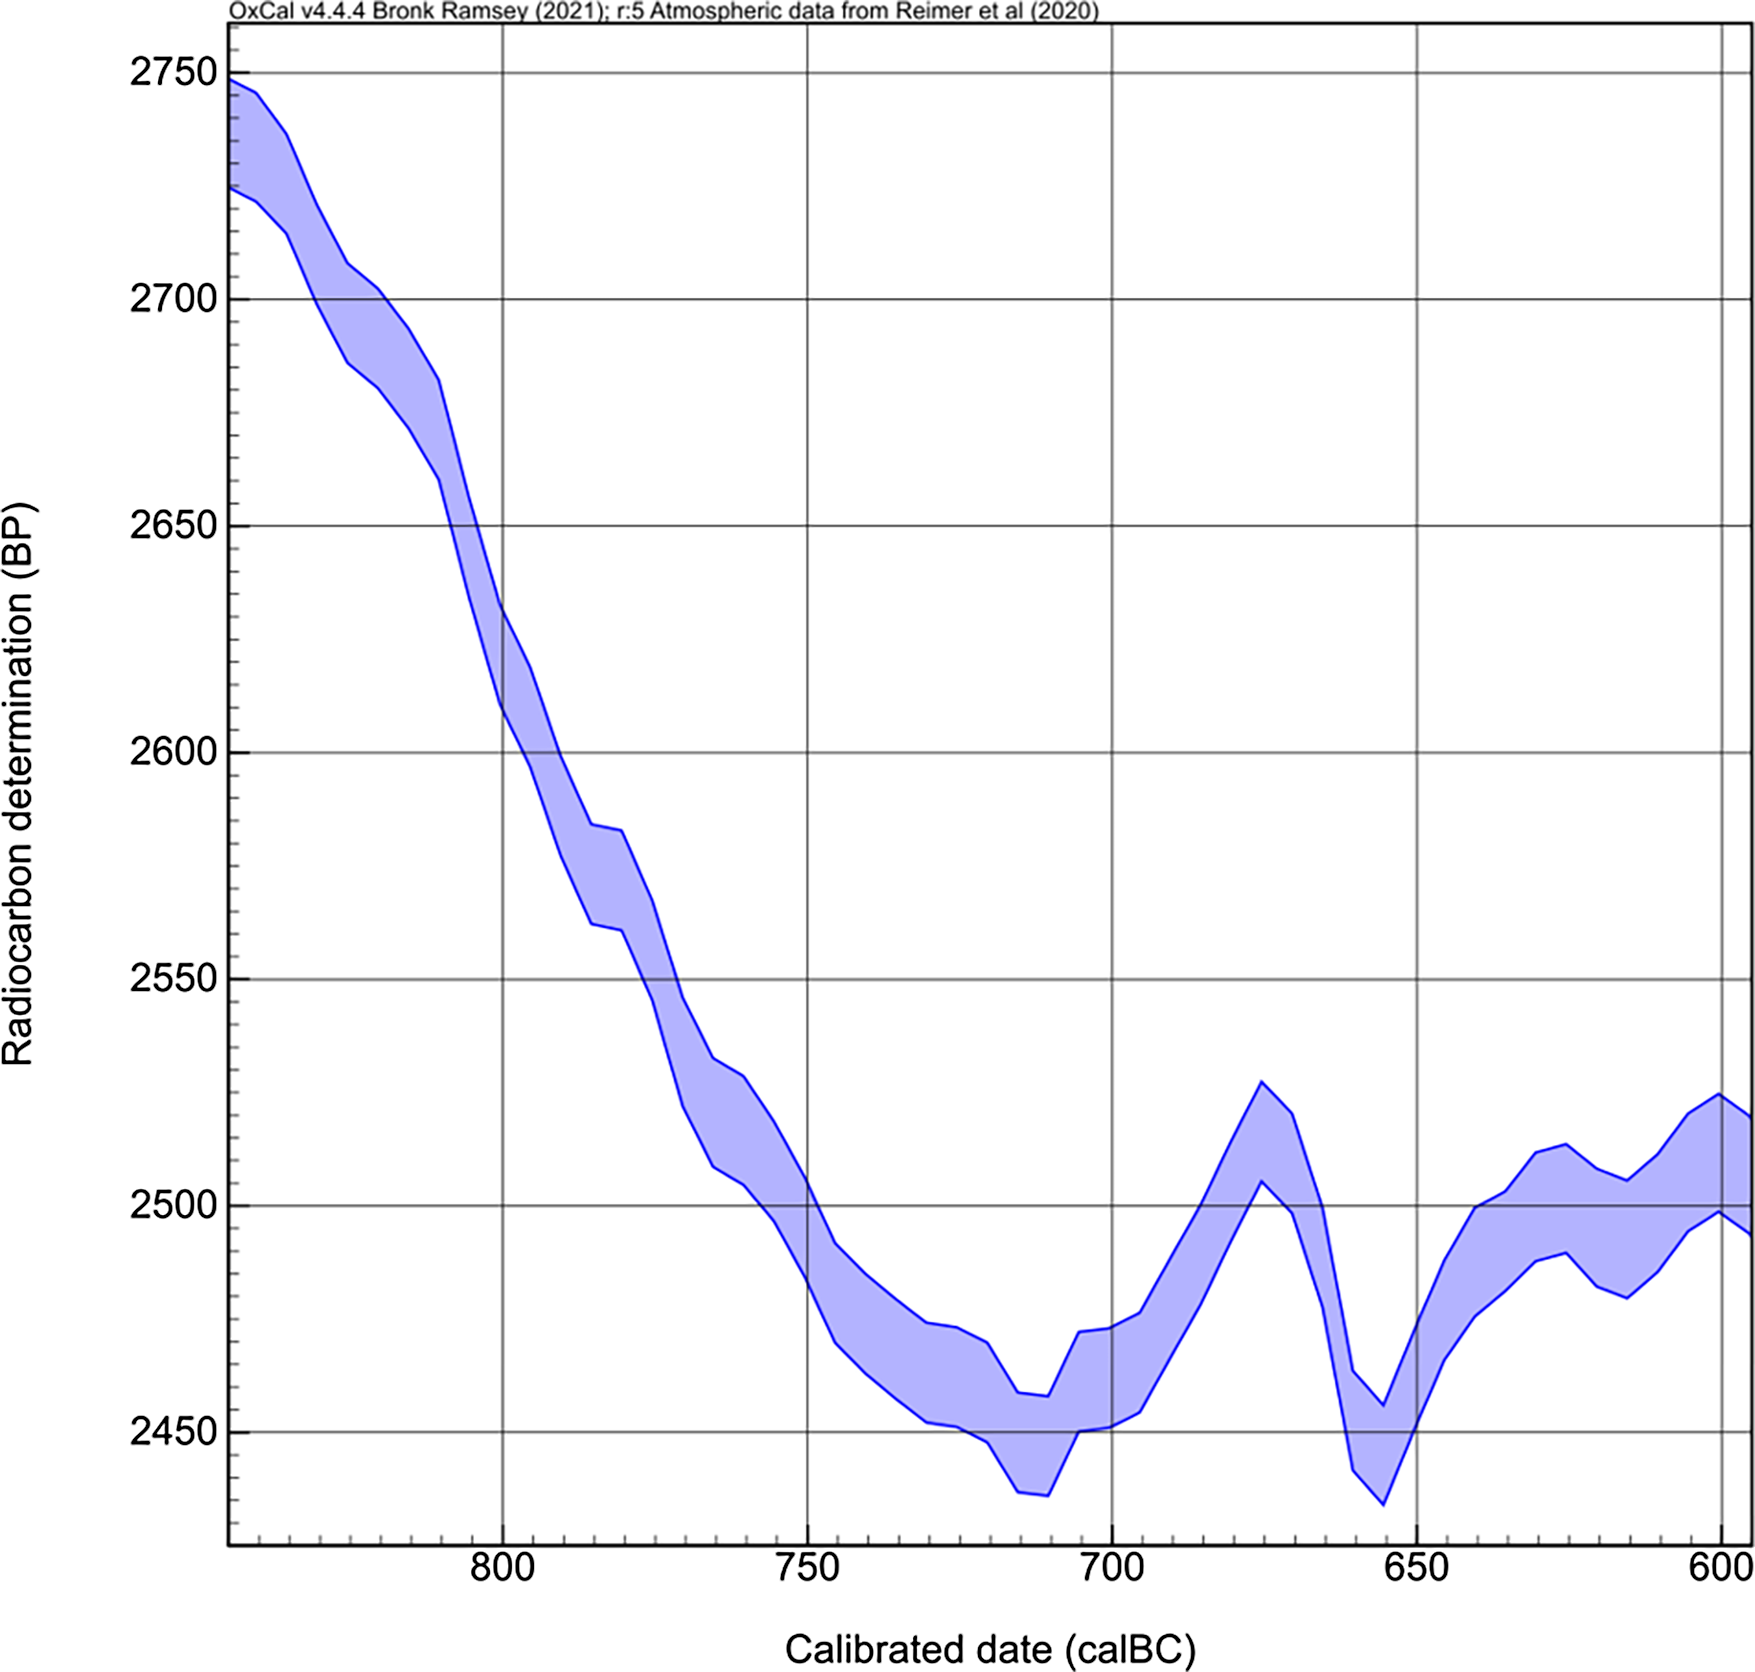
In this publication, we focused on reconstructing paleoclimate changes between 830 BCE and 650 BCE, a period of critical significance marked by the Hallstatt Catastrophe, a shift from a warm and dry climate to a cool and humid one. This period also coincides with the onset of the Hallstatt plateau on the radiocarbon calibration curve (Figure 1).
The IntCal20 Northern Hemisphere radiocarbon age calibration curve for the analyzed period (Reimer et al. Reference Reimer, Austin, Bard, Bayliss, Blackwell, Ramsey, Butzin, Cheng, Edwards, Friedrich, Grootes, Guilderson, Hajdas, Heaton, Hogg, Hughen, Kromer, Manning, Muscheler, Palmer, Pearson, van der Plicht, Reimer, Richards, Scott, Southon, Turney, Wacker, Adolphi, Büntgen, Capano, Fahrni, Fogtmann-Schulz, Friedrich, Köhler, Kudsk, Miyake, Olsen, Reinig, Sakamoto, Sookdeo and Talamo2020).

Materials and methods
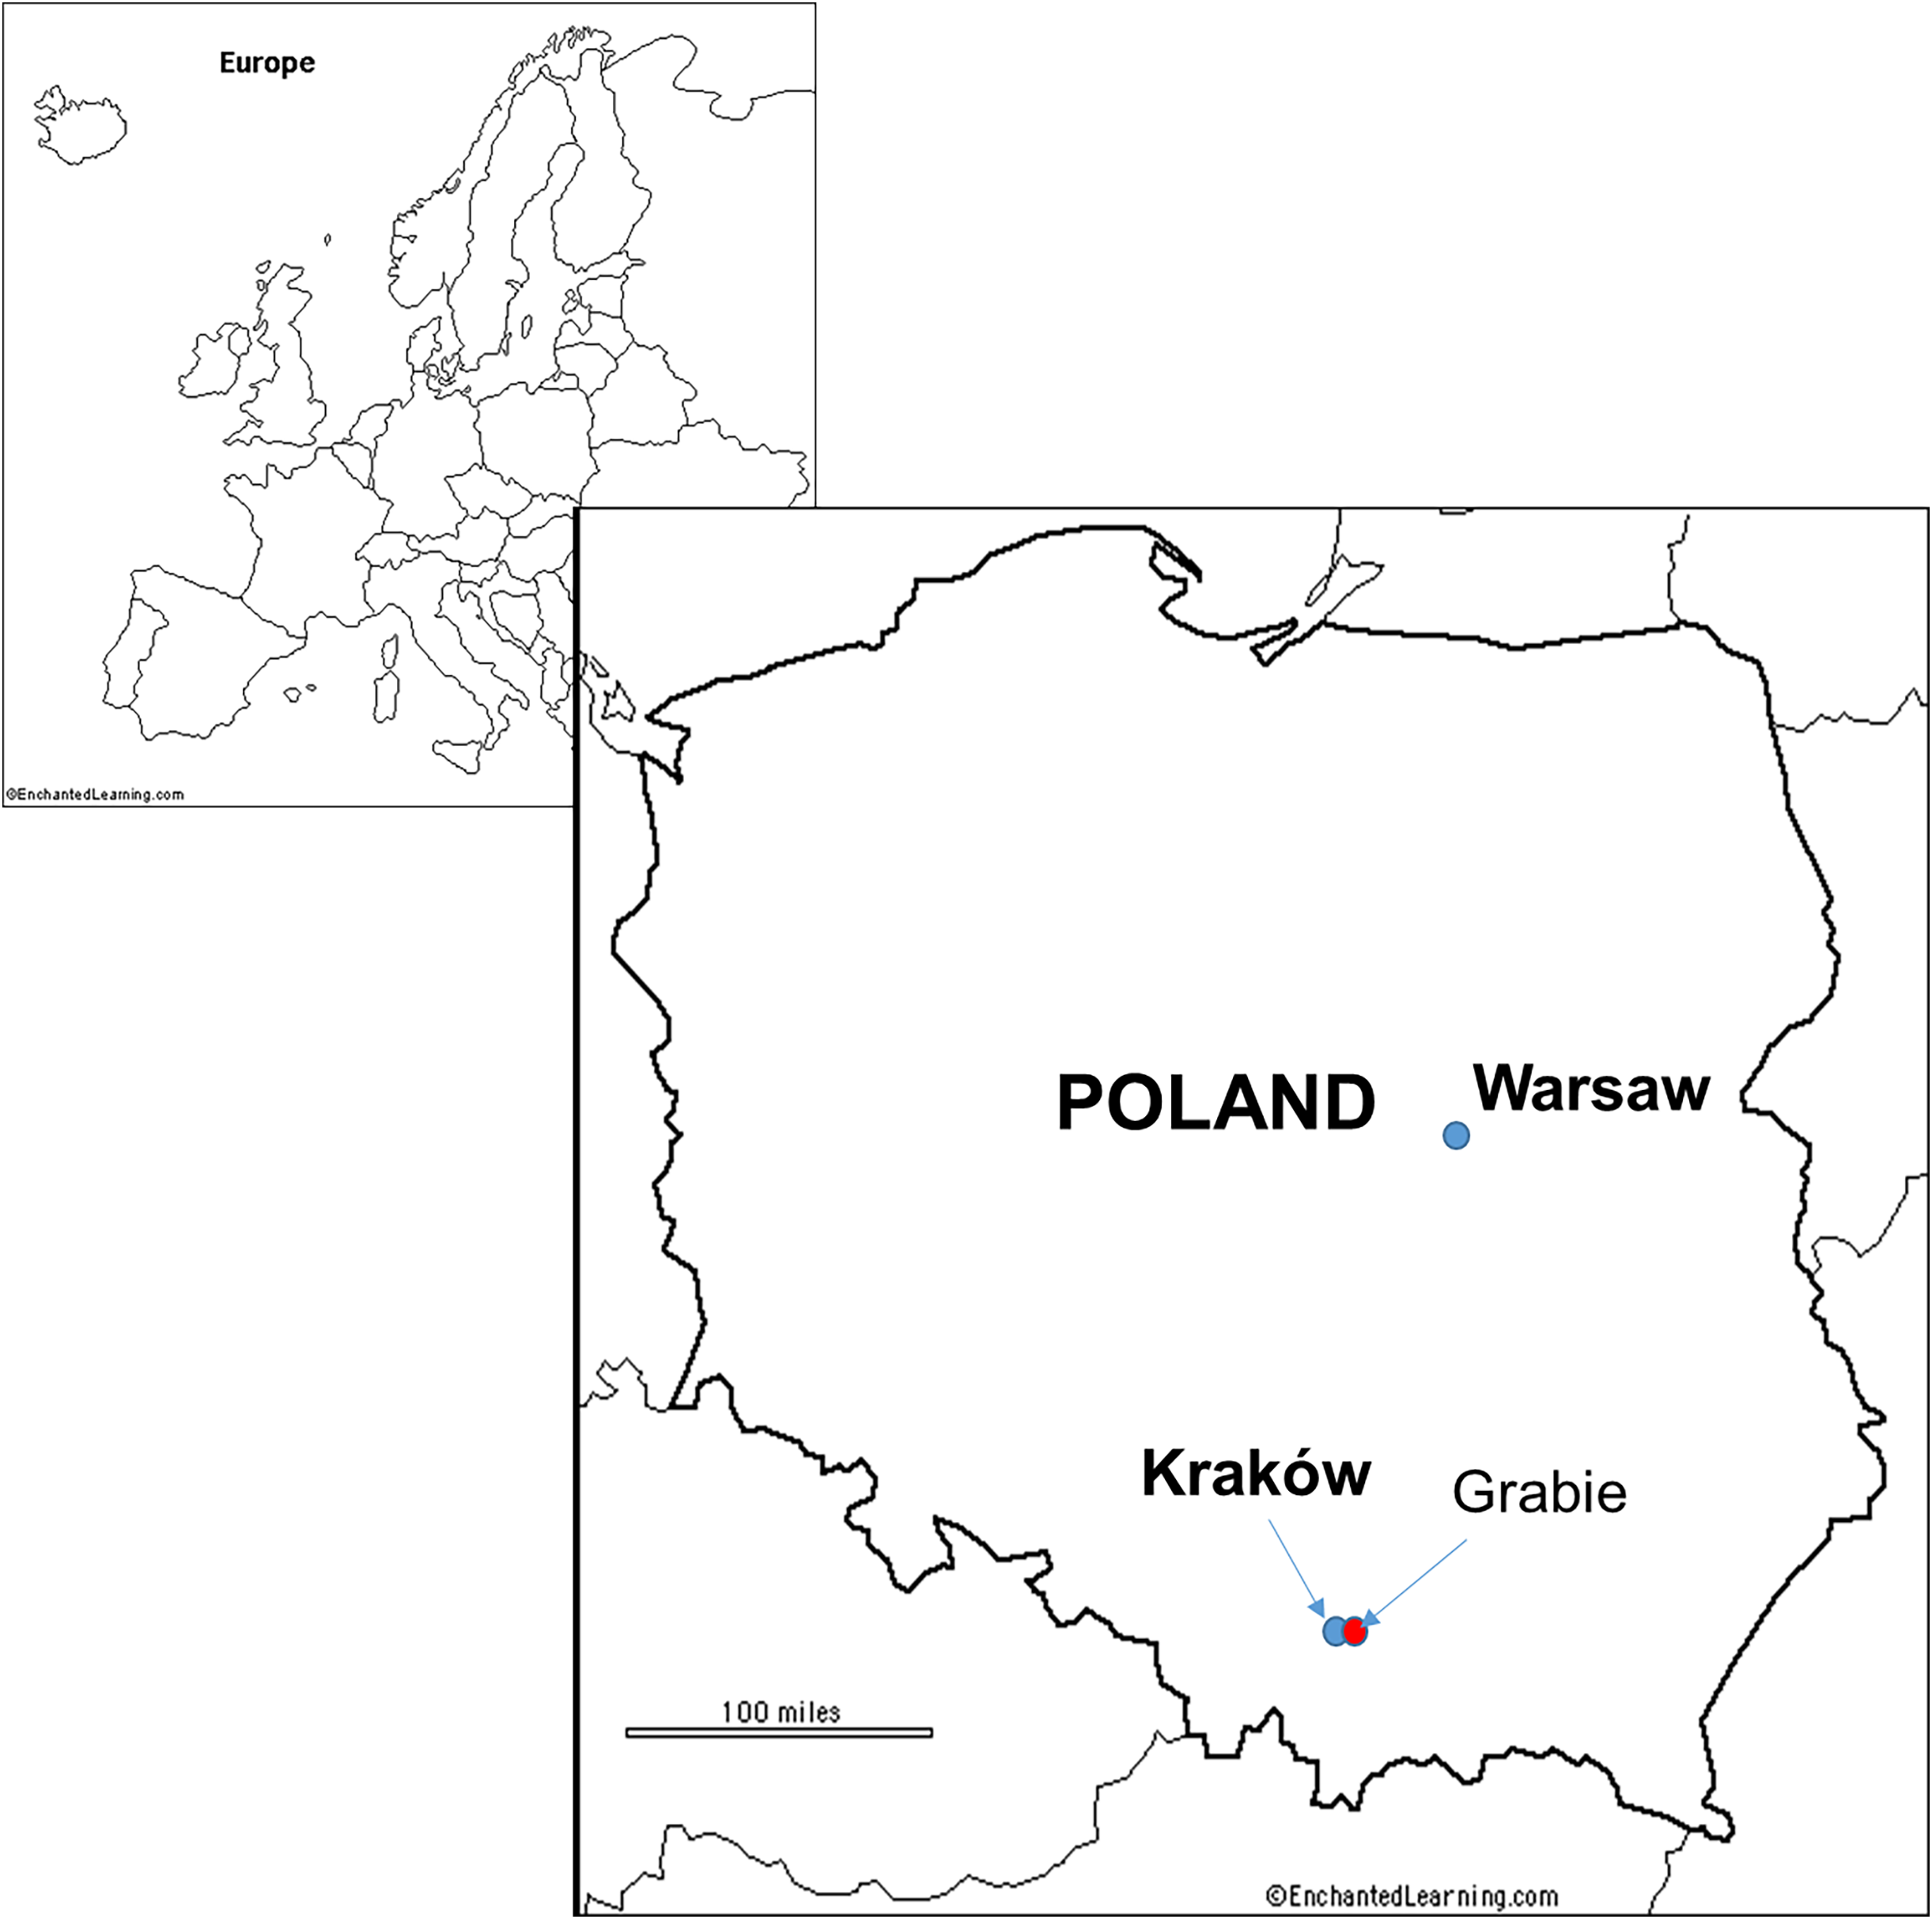
All the samples used in this study are from the archives of the AGH Dendrochronology Laboratory in Kraków. Sub-fossil oaks (Quercus robur L.) were recovered from a site in a gravel pit by the Vistula River in the village of Grabie, near Krakow (50.0391 N, 19.992 E) (Figure 2). Dendrochronological measurements were made with 0.01 mm accuracy using a DENDROLAB 1.0 measurement system (Zielski and Krąpiec Reference Zielski and Krąpiec2004). The measured tree-ring sequences were processed using the TREE-RINGS software (Krawczyk and Krąpiec Reference Krawczyk and Krąpiec1995) and the TSAP computer program (Rinn Reference Rinn2005). Crossdating of the sample was statistically validated using “t-coefficient” (Baillie and Pilcher Reference Baillie and Pilcher1973) and “Gl coefficient” (Gleichläufigkeit; Eckstein and Bauch Reference Eckstein and Bauch1969). The accuracy of the measurements and the quality of the series were verified by COFECHA software (Holmes Reference Holmes1999).
Location of Grabie village (50.0391 N, 19.992 E).

The oaks from Grabie were felled in the last two millennia BC. Because some of them were up to 400 years old, it was possible to construct two reference chronologies (Krąpiec Reference Krąpiec2001). The GAA_1U chronology, covers the years 1750–1018 BC, and the GAA_3U chronology, covers the years 994–612 BC.
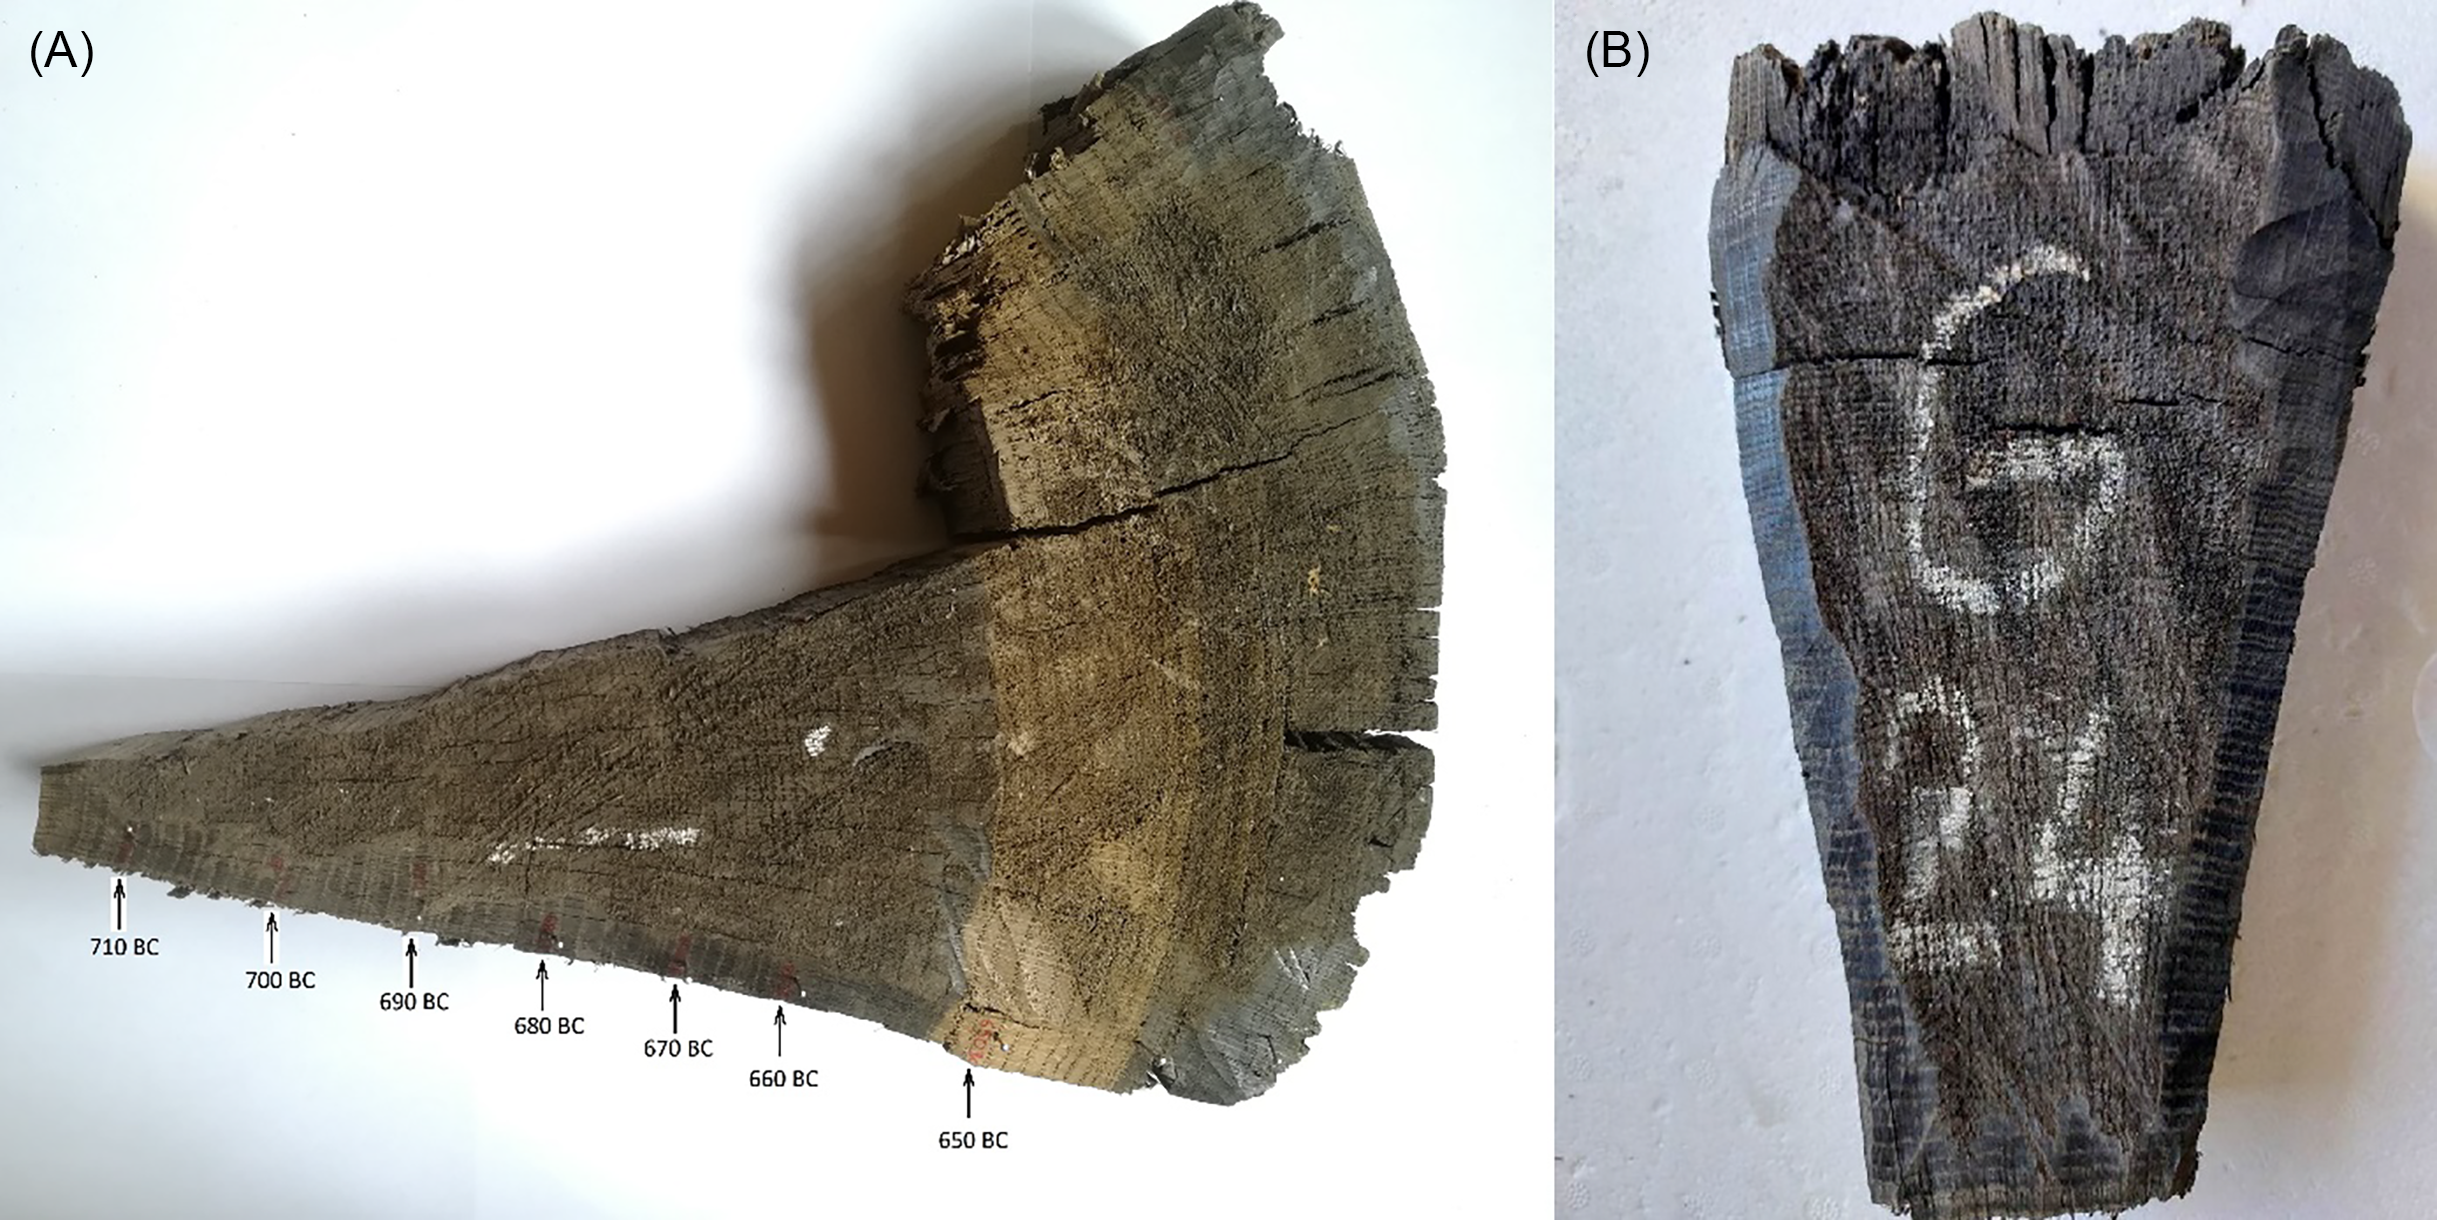
Two samples included in the GAA_3U chronology, covering the period 830–650 BC, were used in this research (Figure 3). The first is a sample with code “G58”, dendrochronologically dated to 797–620 BC. Its correlation with the GAA_3U chronology is very high, with t = 20.2 and Gl = 77%. The second is a sample with code “G24”, dendrochronologically dated to 833–707 BC. Its correlation with the GAA_3U chronology is t = 6.8 and Gl = 74%. The t-value represents the significance of the correlation of two series in relation to their overlap (Baillie and Pilcher Reference Baillie and Pilcher1973). The Gleichläufigkeit (Gl) was developed by Eckstein and Bauch (Reference Eckstein and Bauch1969) as a special tool for crossdating of tree-ring series. The degree of similarity based on the positive or negative trend of each width is expressed as a percentage of the number of intervals.
Cross-section of the trees (Quercus robur) used in our study: (A) sample G58 and (B) sample G24.

The identification of the Miyake event around 660 BC in the Δ14C results from the Grabie tree rings corroborated the dendrochronological dating (Rakowski et al. Reference Rakowski, Krąpiec, Huels, Pawlyta, Hamann and Wiktorowski2019, Reference Rakowski, Pawlyta, Miyahara, Krąpiec, Molnar, Wiktorowski and Minami2024). Moreover, sample “G58” from Grabie was used to precisely date the floating chronology for pine wood from Józefowo (nothern Poland) (Wiktorowski et al. Reference Wiktorowski, Krąpiec, Pawlyta, Barniak and Rakowski2024).
At the time of the project, only two trees—G58 and G24—were available and suitable for proper sampling and cellulose extraction. Consequently, it was not possible to follow the standard practice of averaging the isotopic signal across multiple trees. More material has become available since, but during the project’s execution, G58 and G24 were the only viable options.
Moreover, the 9-year overlap between G58 and G24 falls within the period of poorest wood preservation for G24. In this case, the outermost rings of G24 (representing the end of its life) were available for sampling, whereas for G58, only the central portion of the stem was preserved. Due to the degraded condition of the material, extending the overlap beyond this period was not feasible.
The α-cellulose samples for stable isotopes measurements were prepared in the Dendrochronological Laboratory at AGH University, Kraków (Krapiec et al. Reference Krąpiec, Rakowski, Huels, Wiktorowski and Hamann2018; Wiktorowski et al. Reference Wiktorowski, Krąpiec, Rakowski and Cherkinsky2020). Each annual tree ring from 830–650 BC was washed in distilled water, and α-cellulose was extracted using the Green (Reference Green and Whistler1963) protocol using sodium chlorite for delignification with some modifications. Among other things, our procedure used an ultrasonic bath (Pazdur et al. Reference Pazdur, Korput, Fogtman, Szczepanek, Hałas, Krąpiec and Szychowska-Krąpiec2005), with HCl instead of acetic acid to avoid any possible acetylation (Nemec et al. Reference Nemec, Wacker, Hajdas and Gäggeler2010).
Measurements of stable carbon isotope ratios were made at the Laboratory for Environmental Radioisotope Analyses (LERA), located at the Center for Sustainable Development and Energy Conservation at the Faculty of Geology, Geophysics and Environmental Protection at the AGH University of Krakow in an outpost in Miękinia near Krzeszowice.
Two sub-samples were taken from α-cellulose samples, representing each year, for carbon stable isotope measurements. 170 ± 25 μg of prepared sample cellulose, intended for stable carbon isotope measurements, were packaged and crimped in tin foil capsules. Next, the samples were combusted at 1020 °C and converted into carbon dioxide, using the elemental analyzer Thermo Fisher Isolink. The carbon isotopic composition of the samples was measured using a Delta Q mass spectrometer.
Each measurement series was preceded by a series of tests to tune the spectrometer for accurate measurement. Each measurement series began with measurements of two empty capsules (so-called blanks to check background) and five measurements of reference samples of different weights (linearity test). For further control, for every twelfth measurement, three reference samples were measured, i.e. benzoic acid (IAEA-601), cellulose (IAEA-CH3), and sucrose (IAEA-CH6).
Carbon isotope measurements were expressed using the delta notation (δ1 3C) following Coplen (Reference Coplen2011). To relate the isotopic composition of the samples to the international Vienna Pee Dee Belemnite (VPDB) scale, the three previously mentioned IAEA reference materials were used. A multi-point calibration method was applied to determine the δ1 3C values of the cellulose samples (Coplen et al. Reference Coplen, Brand, Gehre, Gröning, Meijer, Toman and Verkouteren2006). The δ1 3C values are reported in parts per thousand and expressed in ‰ VPDB, following the convention outlined by Brand and Coplen (Reference Brand and Coplen2012).
Results and discussion
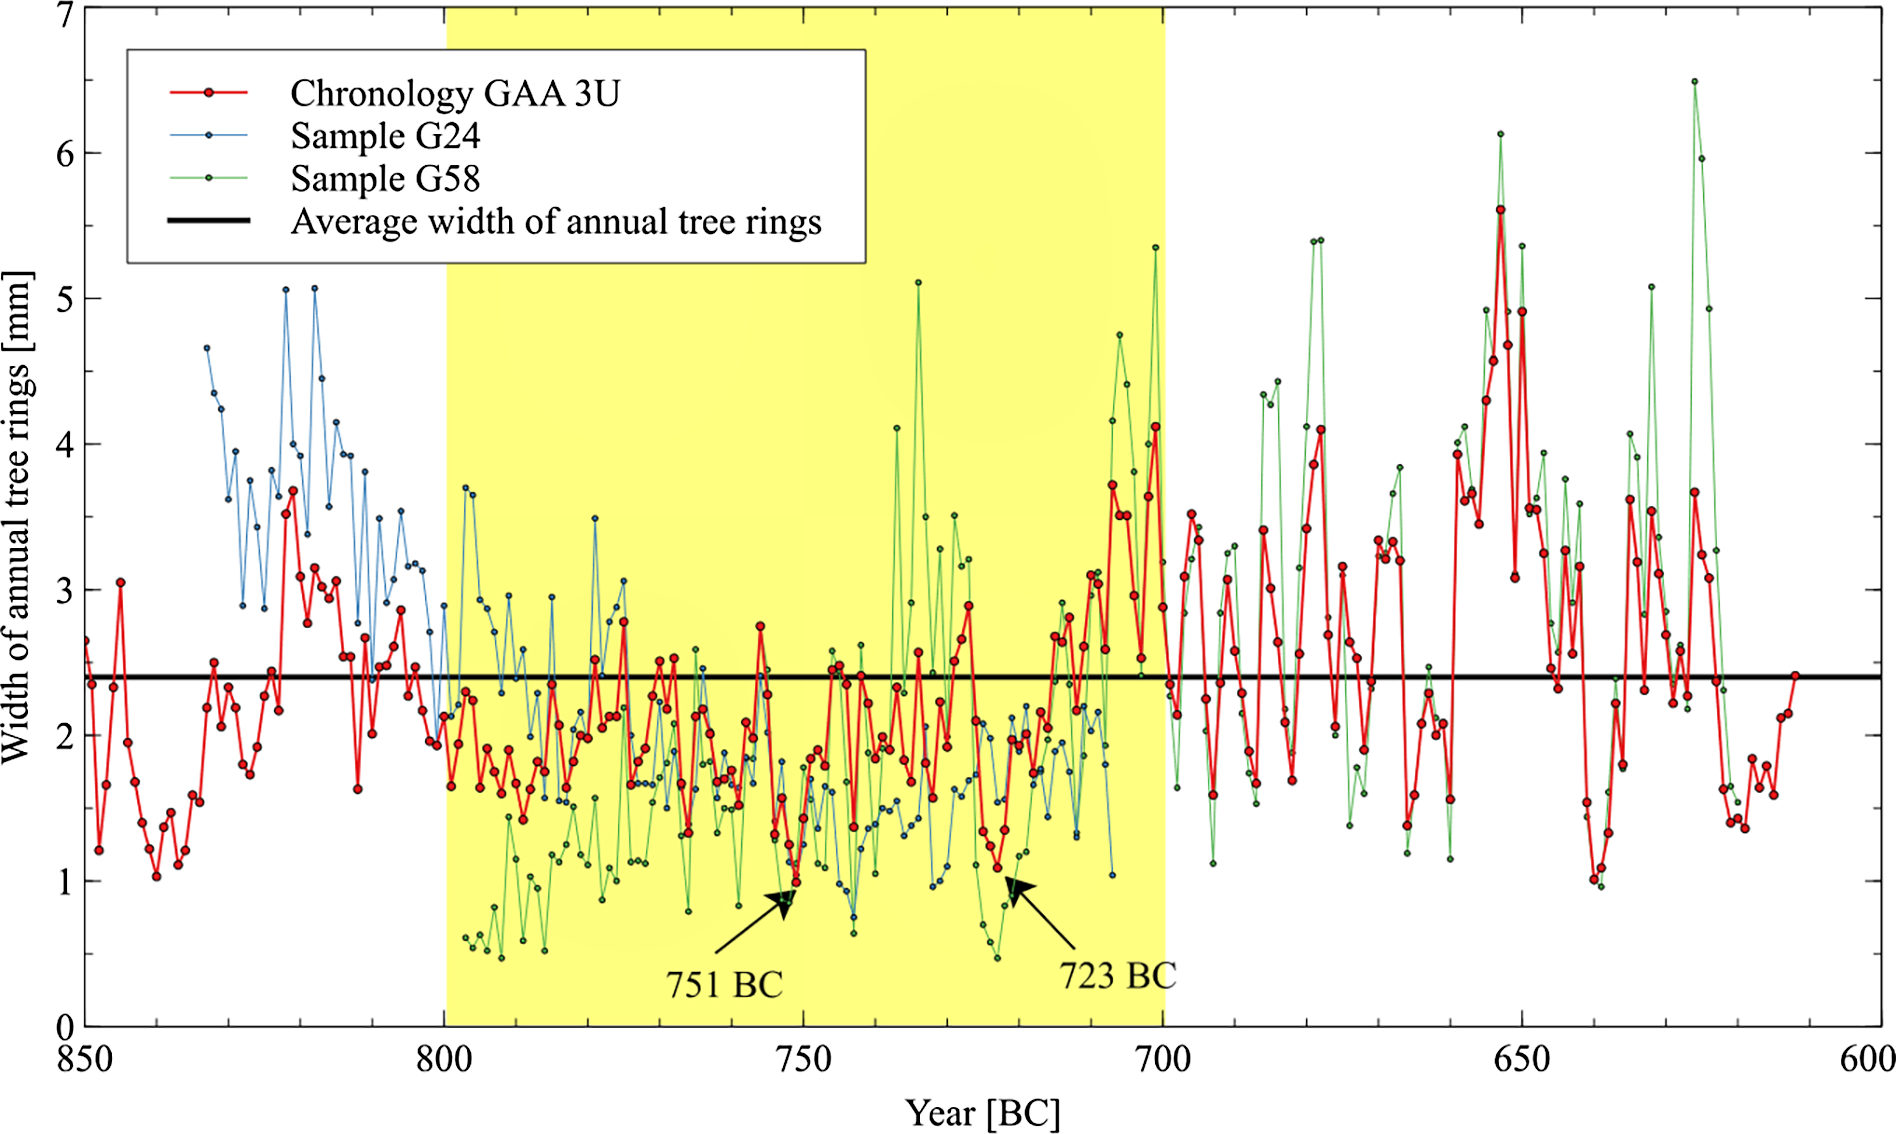
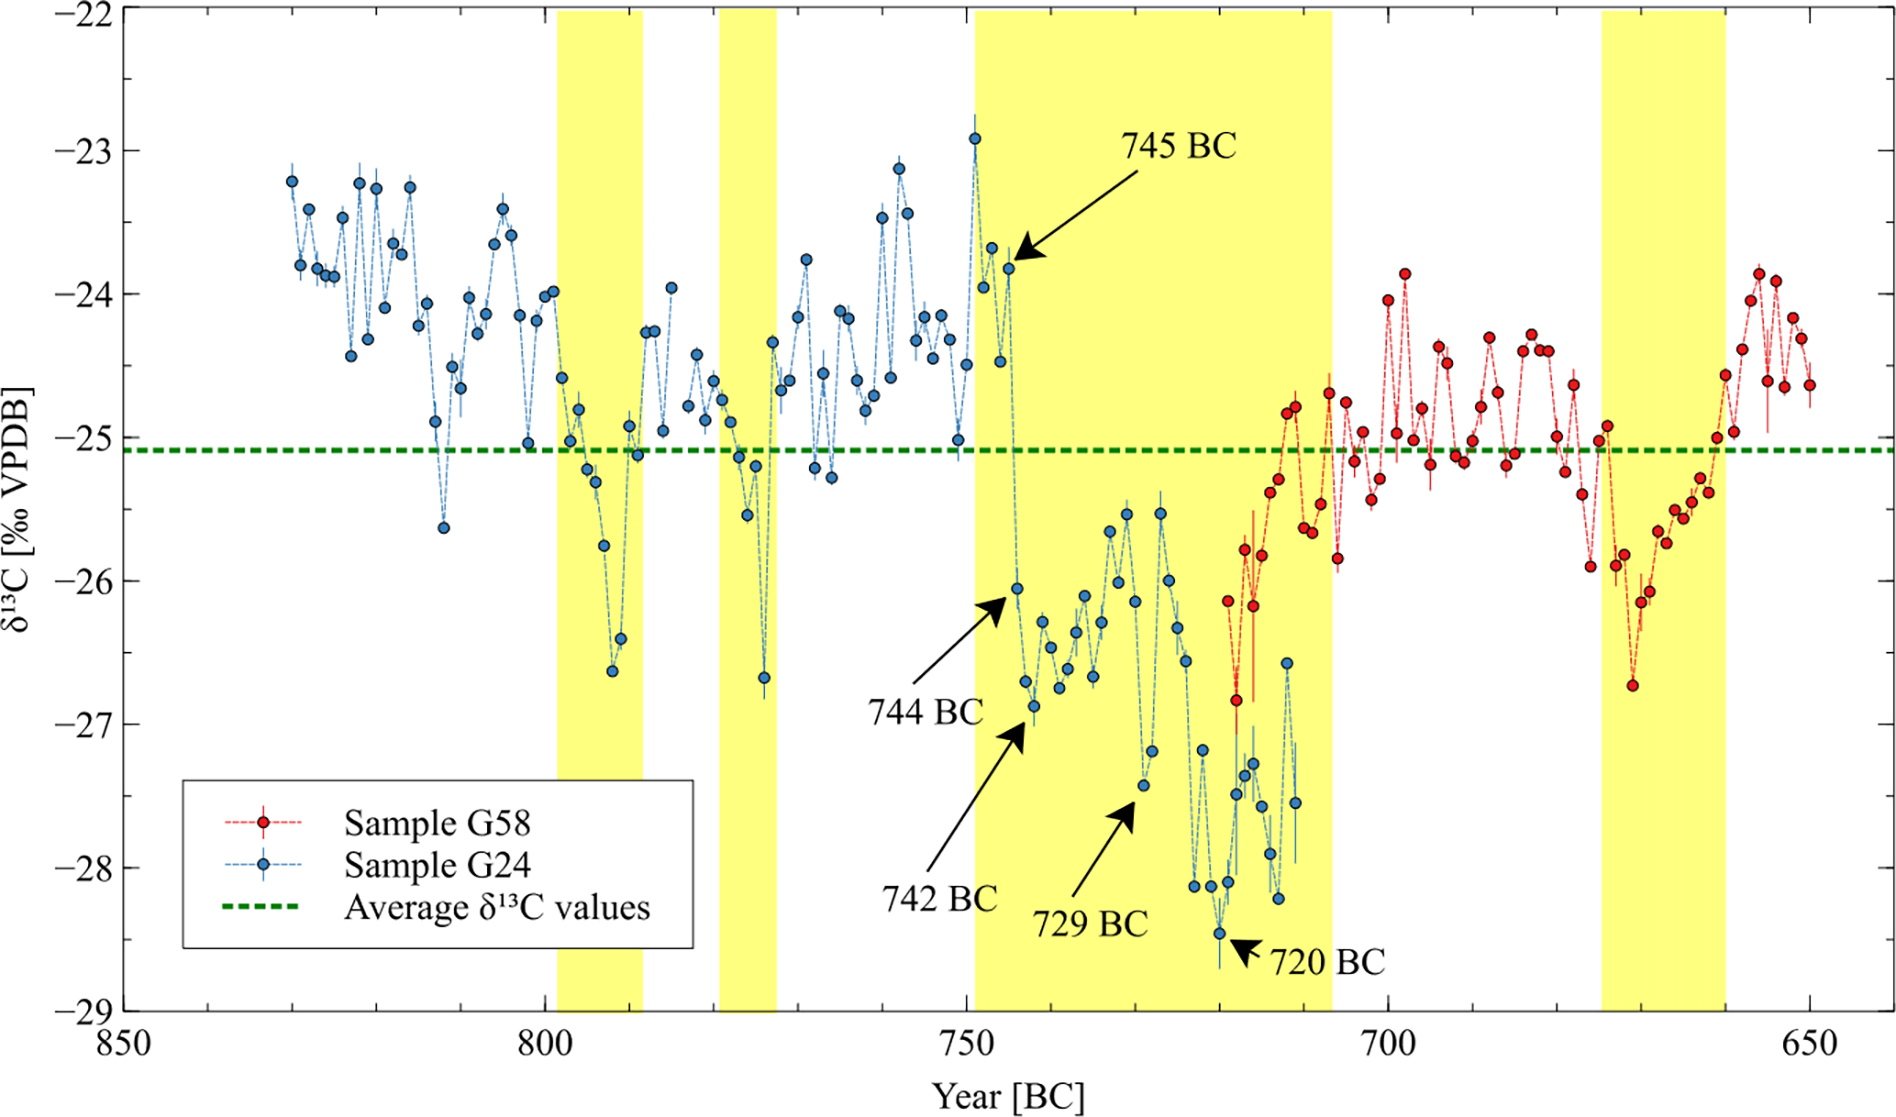
Analysis of changes in the ratio of stable carbon isotopes in annual tree rings, combined with dendrochronological analysis, provides information on the conditions under which a tree lived. Ring widths of dendrochronologically dated samples were precisely measured. This revealed periods with reduced growth, which was the reaction of the trees to unfavorable climatic conditions. It is observed that almost the entire 8th century BC was a period in which the mean widths of annual tree rings persisted below the average, with extremely narrow annual tree rings in 751 BC and 723 BC (Figure 4). During most of the 8th century, distinct climate detoriation is indicated by low tree-ring width and low δ1 3C values, with lowest values in 742 BC, 729 BC and 720 BC (Figure 5).
Graphs showing the widths of annual tree rings for G24 and G58 samples and the standard GAA-3U chronology.

Graphs showing δ1 3C values (in ‰ VPDB) for α-cellulose extracted from annual growth increments.

Four distinct periods characterized by low δ1 3C values were identified: 799–788 BC, 780–773 BC, 749–707 BC, and 674–660 BC. A sharp decline in δ1 3C occurred between 749 BC and 720 BC, reaching a minimum of –28.46‰ VPDB in 720 BC. Notably, between 745 BC and 744 BC, δ1 3C dropped by 2.23‰ within a single year (Figure 5). This abrupt change could be attributed to one of two factors: either an individual physiological response of the tree or a sudden shift in environmental conditions in 745 BC. The latter may have involved decreased solar radiation, lower temperatures, and increased moisture availability—conditions that would have reduced photosynthetic activity, promoted prolonged stomatal opening, and consequently caused significant depletion of 1 3C in the wood.
Given that the samples originated from the Vistula Valley—an area likely with adequate water access—the δ1 3C content was primarily influenced by temperature and solar radiation, which govern photosynthetic intensity. Stomatal activity, while influenced by water availability, played a less significant role.
The abrupt climatic changes during this segment of the Hallstatt period are likely linked to reduced solar activity between 850 and 760 BC (van Geel et al. Reference van Geel, van der Plicht, Kilian, Klaver, Kouwenberg, Renssen and Waterbolk1997). The transition from dry and mild to cool and humid conditions was a global phenomenon (Chambers et al. Reference Chambers, Mauquoy, Brain, Blaauw and Daniell2007) and may have occurred with a delay relative to the decline in solar activity (Swindles et al. Reference Swindles, Plunkett and Roe2007).
A growing body of research suggests a potential link between the so-called Homeric Minimum (circa 800–600 BC)—a period of significantly reduced solar activity—and the so-called Hallstatt Catastrophe. Isotopic data (10Be and 14C) confirm the occurrence of a major solar minimum during this time, which may have caused climatic changes such as cooling, increased precipitation, and greater seasonal variability (Inceoglu et al. Reference Inceoglu, Simoniello, Knudsen, Karoff, Olsen and Turck-Chièze2015; Usoskin et al. Reference Usoskin, Solanki and Kovaltsov2007; Wu et al. Reference Wu, Krivova, Solanki and Usoskin2018). Palynological and archaeological analyses further indicate a decline in agricultural productivity, abandonment of settlements, and disruption of trade networks in regions associated with the Hallstatt culture (Becker et al. Reference Becker, Gearey, Craven and O’Donnell2020; van Geel et al. Reference van Geel, Mauquoy and Blaauw2012).
Conclusions
We are aware of the limitations of the presented results due to the lack of availability of suitable research material. Only two tree trunks were analyzed for the period of interest, with an exceptionally short overlap of just nine years (711–719 BC). Nevertheless, the similarity in the character of the isotopic signal and the tree-ring widths in trunks G24 and G58, as well as comparison with other studies, allow us to draw the following conclusions.
Isotopic and dendrochronological studies conducted on wood samples from Grabie (G58 and G24) support the occurrence of a sudden climate shift during the Hallstatt period, particularly in the 8th century BC. Analysis of stable carbon isotope ratios in α-cellulose revealed periods of climatic deterioration around 812 BC, 791 BC, 774 BC, 752 BC, 745 BC, 720 BC and 670 BC, with the most pronounced transitions occurring around 745 BC and 720 BC. These events marked a shift from a warm and dry climate to a cool and humid one.
Tree-ring widths in our studied samples show reduced annual growth throughout most of the 8th century BC, with exceptionally narrow rings in 751 BC and 723 BC. These results align with previously published data: Ważny (Reference Ważny2001, Reference Ważny and Babiński2009) identified climate deterioration in the years 857–844 BC, 792–782 BC, and again after 745 BC and 720 BC, with the latter strongly associated with the abandonment of the Biskupin settlement. Leuschner (Reference Leuschner and Bartholin1992) observed similar environmental stress between 855–835 BC, 735–715 BC, and 705–685 BC. Schmidt (Reference Leuschner and Bartholin1992) noted rising groundwater levels in northwestern Germany between 717–713 BC, and Barniak et al. (Reference Barniak, Krąpiec and Jurys2014) reported habitat degradation and tree mortality at the Rucianka peatland around 850 BC and 740 BC.
An increasing number of studies point to a possible link between this climatic anomaly—often termed the “Hallstatt Catastrophe”—and the Homeric Minimum (circa 800–600 BC), a phase marked by notably low solar activity. Isotopic evidence (10Be and 14C) confirms the presence of a significant solar minimum during this period, which may have led to cooler temperatures, greater precipitation, and heightened seasonal variability (Inceoglu et al. Reference Inceoglu, Simoniello, Knudsen, Karoff, Olsen and Turck-Chièze2015; Usoskin et al. Reference Usoskin, Solanki and Kovaltsov2007; Wu et al. Reference Wu, Krivova, Solanki and Usoskin2018). This decline in solar activity likely caused an increase in cosmic radiation, as indicated by a pronounced rise in atmospheric 14C levels between 850 and 760 BC (van Geel et al. Reference van Geel, van der Plicht, Kilian, Klaver, Kouwenberg, Renssen and Waterbolk1997).
Supplementary material
To view supplementary material for this article, please visit https://doi.org/10.1017/RDC.2026.10199
Acknowledgments
This work was partly supported by AGH University grant 16.16.140.315.